

Measuring the Bubble


John P. Hussman, Ph.D.
President, Hussman Investment Trust
February 2018
Measure what is measurable, and make measurable what is not so.
– Galileo
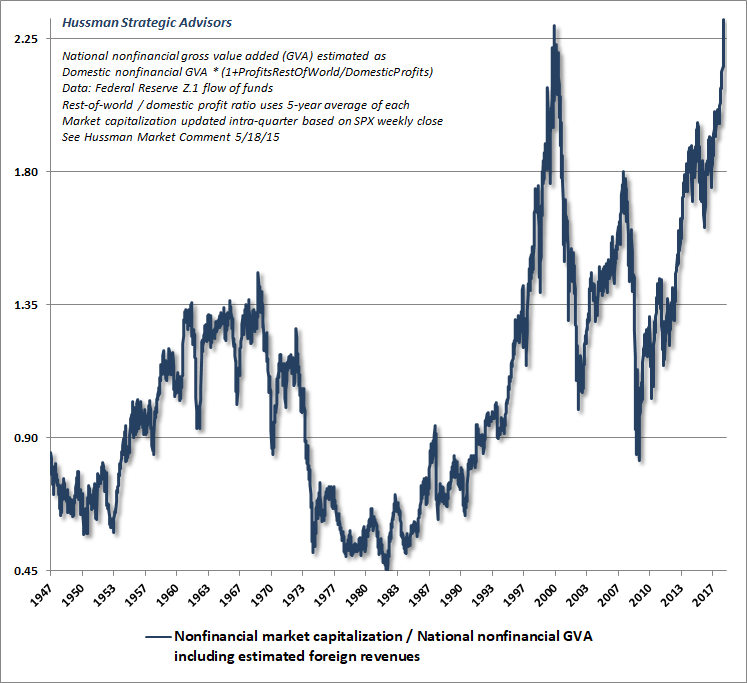
Last week, the U.S. equity market climbed to the steepest valuation level in history, based on the valuation measures most highly correlated with actual subsequent S&P 500 10-12 year total returns, across a century of market cycles. These measures include the S&P 500 price/revenue ratio, the Margin-Adjusted CAPE (our more reliable variant of Robert Shiller’s cyclically-adjusted P/E), and MarketCap/GVA – the ratio of nonfinancial market capitalization to corporate gross value-added, including estimated foreign revenues – which is easily the most reliable valuation measure we’ve ever created or tested, among scores of alternatives.
A few charts will bring the valuation picture up-to-date. The first chart below shows the ratio of MarketCap/GVA, which now stands beyond even the 2000 market extreme.
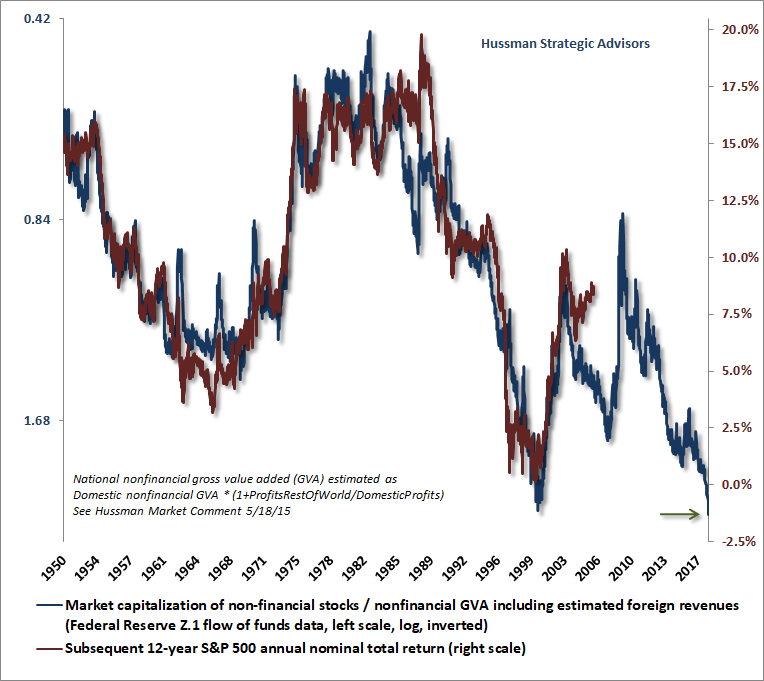
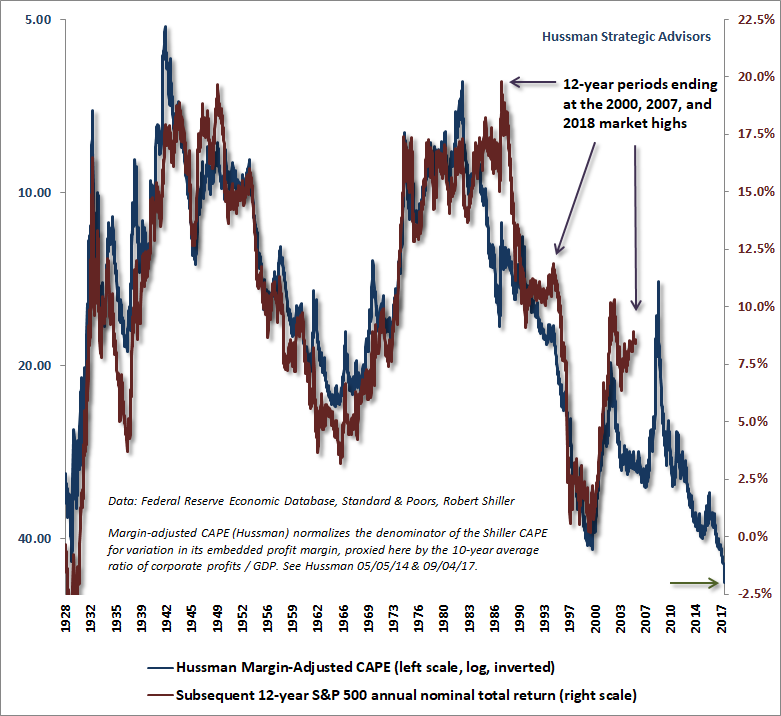
Take MarketCap/GVA, put it on an inverted log scale (left) and you get the blue line below. The red line (right scale) is the average annual nominal total return of the S&P 500 over the subsequent 12-year period. The correlation between the two is 93%. From present levels of valuation, we fully expect the S&P 500 to lose value, on a total return basis, over the coming 12-year horizon. That’s not a worst-case scenario or an outcome that depends on unusual economic outcomes. It’s actually the standard, run-of-the-mill expectation given current valuation extremes, and it assumes substantial expansion in the U.S. economy over this horizon.
The next chart shows our Margin-Adjusted CAPE, in data since the 1920’s, which is also easily at the most extreme level in history. Notably, the relationship between the Margin-Adjusted CAPE and actual subsequent market returns is more reliable than for the raw Shiller CAPE.
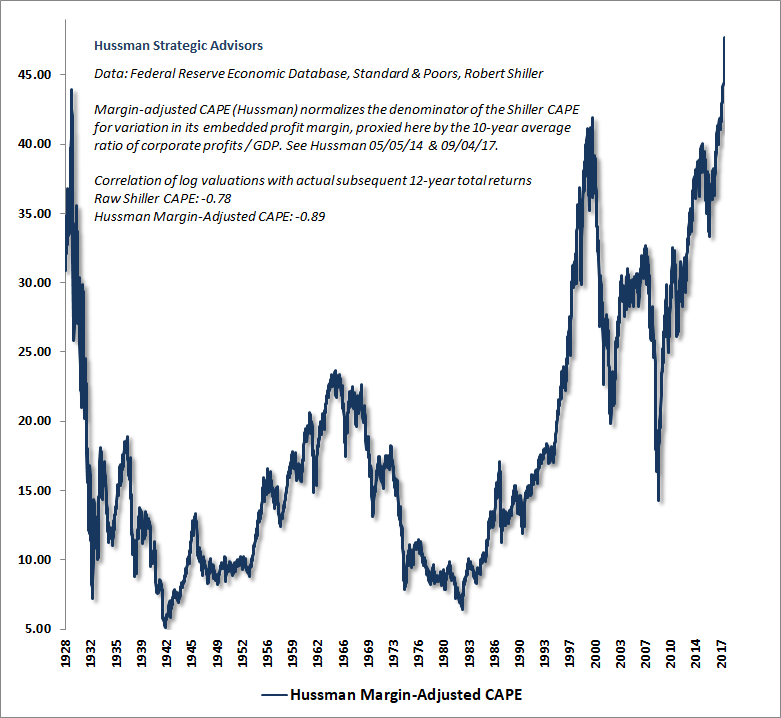
As a side-note, Shiller’s version will retreat by about 10-15% as depressed earnings from 2008-2010 gradually drop out of the 10-year window. Of course, given that Shiller’s raw CAPE is also much less reliable than our margin-adjusted variant, a decline in the Shiller CAPE, driven by a statistical artifact of its own construction, will not make stocks any less hypervalued. Because our Margin-Adjusted CAPE already adjusts for cyclical variations in the embedded profit margin, it does not suffer from similar “dropoff” artifacts when extremely elevated or depressed earnings fall out of the 10-year average.
I expect the S&P 500 to lose approximately two-thirds of its value over the completion of this market cycle.
One might object that the best-performing valuation measures mute the effect of variations in corporate profit margins to one extent or another. These measures would arguably be less extreme if elevated profit margins were given full credit. But that, emphatically, is the point. Stocks are not a claim to next year’s earnings, but to a very long-term stream of cash flows that will be delivered into the hands of investors over decades and decades. While corporate earnings are necessary to generate deliverable cash to shareholders, comparing prices to earnings is actually quite a poor way to estimate future investment returns. The reason is simple – most of the variation in earnings, particularly at the index level, is uninformative. Corporate earnings are more variable, historically, than stock prices themselves.
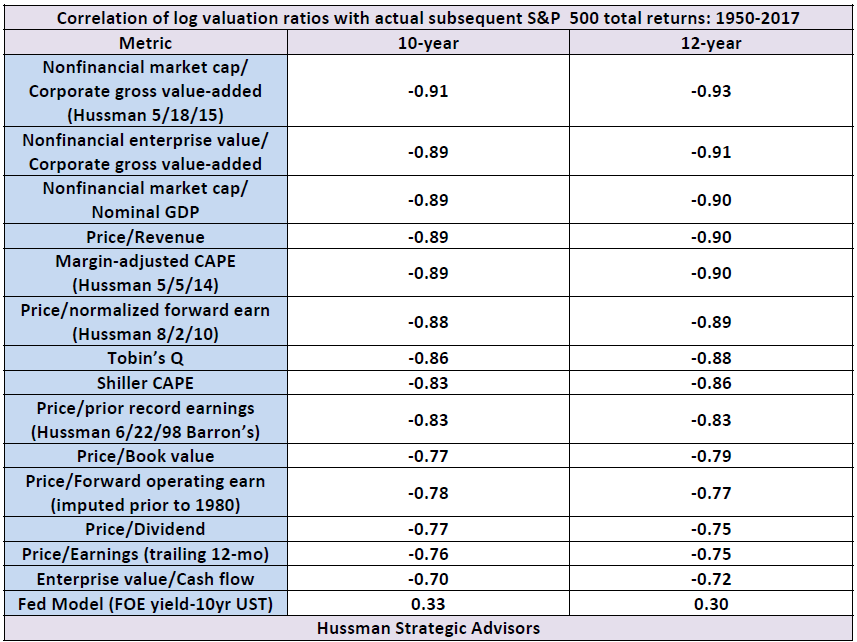
Though “operating” earnings are less volatile, all earnings measures are pro-cyclical; expanding during economic expansions, and retreating during recessions. As a result, to quote the legendary value investor Benjamin Graham, “The purchasers view the good current earnings as equivalent to ‘earning power’ and assume that prosperity is equivalent to safety.” As a reminder, the table below compares the historical reliability of a variety of alternative valuation measures in data from 1950-2017.
Valuation levels are extreme, but the mapping to long-term returns is intact
Critics of value-conscious investing have argued that even the most reliable valuation measures have been extreme for years now, and can therefore be disregarded, since the market has continued to advance. Hold on Scooter. It’s important to distinguish between the level of valuations, which has indeed become breathtakingly extreme in recent years, and the mapping between valuations and longer-term market returns (which we observe as a correspondence, where rich valuations are followed by poor returns and depressed valuations are followed by elevated returns). That mapping has remained intact, even in recent market cycles.
The essential thing to understand about valuations is that while they are highly reliable measures of prospective long-term market returns (particularly over 10-12 year horizons), and of potential downside risk over the completion of any market cycle, valuations are also nearly useless over shorter segments of the market cycle. The mapping between valuations and subsequent returns is typically most reliable over a 10-12 year horizon. That’s the point where the “autocorrelation” of valuations (the correlation between valuations at one point in time and valuations at another point in time) typically hits zero.
Now, it’s true that when we examine pre-crash extremes, like 2000 and 2007, we’ll typically find that actual returns over the preceding 12-year period were higher than the returns that one would have expected on the basis of valuations 12 years earlier. No surprise there. The only way to get to breathtaking valuations is to experience a period of surprisingly strong returns. Those breathtaking valuations are then followed by dismal consequences. Likewise, when we examine secular lows like 1974 and 1982, we’ll find that actual returns over the preceding 12-year period fell short of the returns one would have expected on the basis of valuations 12 years earlier.
The chart below offers a reminder of what this looks like, in data since the 1920’s. Look at the “errors” in 1988, 1995, and 2006. Count forward 12 years, and you’ll find the major valuation peaks of 2000, 2007 and today that were responsible for the overshoot of actual returns. The 2000 and 2007 instances were both followed by losses of 50% or more in the S&P 500. Look at the “errors” in 1937, 1962, 1966, and 1970. Count forward 12 years, and you’ll find the market lows of 1949, 1974, 1978 and 1982 that were responsible for the undershoot of actual returns. Those market lows turned out to be the best buying opportunities of the post-war era. When market cycles move to extreme overvaluation or undervaluation, they become an exercise in borrowing or lending returns to the future, and then surrendering or receiving them back over the remaining half of the cycle.
As I detailed in Survival Tactics for a Hypervalued Market, the “errors” between actual market returns and those that one would have expected (on the basis of reliable valuation measures 12-years earlier) are tightly correlated with by cyclical fluctuations in consumer confidence (h/t Mark Louis for that insight). Put simply, extreme overvaluation emerges because investors feel exuberant over some portion of the market cycle, not because prices actually belong at those extremes. Likewise, extreme undervaluation emerges because investors feel risk-averse.
Recognizing that valuations matter profoundly over the long run, yet are nearly useless over the short run, is central to navigating complete market cycles. The main driver of market returns over shorter segments of the market cycle is the purely psychological inclination of investors toward speculation or risk-aversion. Aside from an occasional bit of lip-service, followed by reassuring justifications, investors entirely dismiss the level of valuations when they have the speculative bit in their teeth. While investor psychology seems fairly abstract, it’s important, as Galileo advised, to “Measure what is measurable, and make measurable what is not so.”
Fortunately, when investors are inclined toward speculation, they tend to be indiscriminate about it, so in our own methods, we extract a signal about speculation or risk-aversion from the uniformity or divergence of market action across thousands of individual securities, sectors, industries, and security-types, including debt securities of varying creditworthiness. We don’t publish those methods, but suffice it to say that when the market demonstrates divergences and breakdowns in the behavior of various sectors, that loss of “uniformity” is often a signal that investor preferences have subtly shifted toward risk-aversion.
A few caveats are important here. First, the preferences of investors toward speculation or risk-aversion typically shift, on our measures, about twice a year, on average. So it’s important not to assume that just because the uniformity of market internals has improved or deteriorated, the entire cycle has shifted from a bull market to a bear market, or vice versa.
Second, our own admitted difficulty in the advancing period since 2009 did not reflect a shortfall in either our measures of valuation or our measures of market internals. Instead, the difficulty resulted almost entirely from our reliance on (and bearish response to) syndromes of “overvalued, overbought, overbullish” conditions. Previous market cycles across history had taught that those syndromes signaled something of a limit to speculation, and that they were regularly followed by steep air-pockets, panics or market crashes. So one could respond to those syndromes even before the uniformity of market internals deteriorated.
This half-cycle was different in one critical respect. The Federal Reserve’s policy of zero interest rates encouraged continued speculation despite persistently extreme “overvalued, overbought, overbullish” syndromes. We made a series of incremental adaptations to raise the priority of market internals over those syndromes, but it was only late last year that we finally threw up our hands and prioritized market internals over those syndromes with no exceptions. Put simply, extreme market conditions can hold us to a rather neutral outlook (as we continue to maintain at present), but we no longer adopt a hard-negative outlook if our measures of market internals are constructive, regardless of how overextended the market might become.
Recognizing that valuations matter profoundly over the long run, yet are nearly useless over the short run, is central to navigating complete market cycles.
This does not, for even a moment, change the fact that the most reliable measures of valuation are now an average of 3.0 times their historical norms. By the completion of every previous market cycle in history, stock prices have approached or breached those norms. So yes, I expect that the S&P 500 will lose approximately two-thirds of its value over the completion of this market cycle. The short-run issue is just that nothing prevents the speculative inclinations of investors from driving valuations even higher.
Even so, I believe that it’s essential to carry a significant safety net at present, and I’m also partial to tail-risk hedges that kick-in automatically as the market declines, rather than requiring the execution of sell orders. My impression is that the first leg down will be extremely steep, and that a subsequent bounce will encourage investors to believe the worst is over. Study market history. The trouble rarely ends until valuations have approached or breached their long-term norms. In any event, we’ll take our cues from valuations and market action.
On interest rates and corporate taxes
This brings us to the question of interest rates. Don’t low interest rates justify rich valuations? Not so fast. Remember how discounted cash flows work. If interest rates are low because growth rates are also low, no valuation premium is “justified” by the low interest rates at all.
Despite some investors waxing rhapsodic about things like “mass collaboration and sharing enabled by technology and global communications networks,” S&P 500 Index revenues have grown at a nominal rate of just 3.2% annually over the past 20 years, and just 1.6% annually over the past decade, and that includes the benefit of stock buybacks. Even the steep expansion of profit margins over the past 20 years (investors forget that one of the reasons P/E ratios were high in the late-1990’s was because margins were actually below-average) has produced average S&P 500 earnings growth of just 5.0% annually, and only 3.1% annually over the past decade. While these growth rates are already below historical norms, further earnings growth at a rate higher than revenue growth would require profit margins to advance without limit.
Looking at the economy as a whole, the 2.5% real GDP growth observed in 2017 featured 1.2-1.4% growth in employment (depending on whether one uses the household or establishment survey). Average weekly hours per worker also rose, resulting in a 2.1% increase in total hours worked for 2017. That leaves the contribution of productivity growth at only about 0.4% for 2017, which is less than one-quarter of the historical norm, about half of the productivity growth rate we’ve observed in recent decades, and similar to the productivity growth rate of the past 5 years. At a 4.1% unemployment rate and labor force growth now down to about 0.5%, the baseline expectation for real GDP growth in the coming years is approaching just 1% (0.5% labor force growth plus productivity growth of about 0.5% annually). Pushing past even 2% on a sustained basis will require the avoidance of any recession in the years ahead, along with a continued decline in the unemployment rate below 4.1%, or an acceleration of productivity growth beyond anything we’ve observed in recent decades. I can’t emphasize enough that half of the average 2.2% growth rate in real GDP since the depths of the recession in 2009 has been driven by a decline in the unemployment rate.
So yes, interest rates are depressed, but so too are the structural drivers of economic growth and corporate income, and much of that is baked in the cake of demographic factors like population growth. Low interest rates emphatically do not “justify” valuations anywhere near three times their historical norms. What you’re observing is pure speculative psychology on a glorious run through the poppy fields. For a more complete discussion of the impact of interest rates on valuations, see Why Market Valuations Are Not Justified By Low Interest Rates. For more on the drivers of economic growth, see Three Delusions.
We hear numerous observers saying that stocks are “cheap relative to interest rates.” Specifically, analysts argue that the “equity risk premium” – the expected return of stocks over and above that of Treasury bonds – is actually quite satisfactory at present. Well, that’s a nice verbal argument. Now show your work. Anytime you hear an analyst say that the “equity risk premium” is high, demand that they show you the actual performance of their measure versus subsequent market returns, ideally over decades of market cycles.
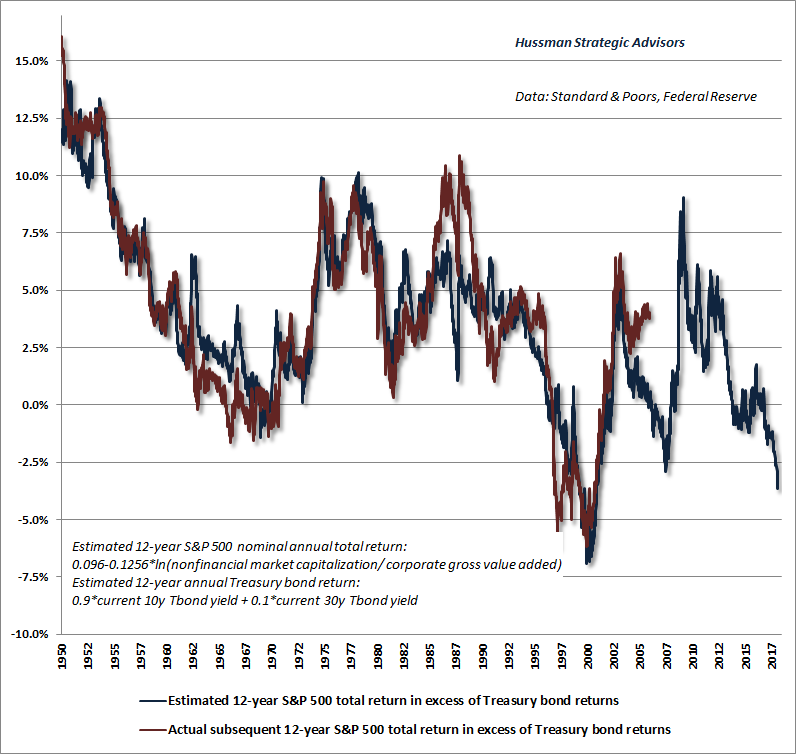
The chart below presents ours. The blue line is our estimate of the expected 12-year total return of the S&P 500 over and above Treasury bond returns. The red line shows the actual subsequent “equity risk premium” over that horizon. The correlation between the two is over 90%. Do the same thing with the Fed Model, or most other “equity risk premium” estimates proposed by Wall Street analysts or academics, and you’ll either cry, or laugh, or cry laughing, but you’ll undoubtedly be distressed that anyone would recommend those models as a basis for long-term investment.
You’ll notice below that we presently expect the S&P 500 to lag the return on Treasury bonds over the coming 12 years by a substantial amount. That interpretation is correct. We fully expect stocks to lose value over this horizon on a total return basis, given present valuations.
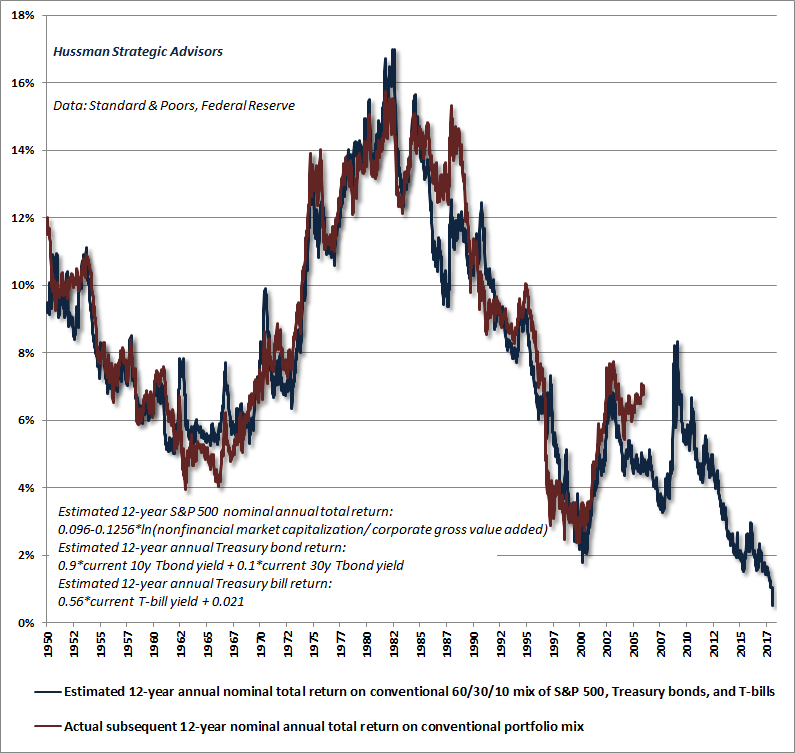
To say that low interest rates justify extreme valuations is also to say that low interest rates justify low prospective market returns. But the situation is actually worse than that. Low interest rates don’t justify elevated stock market valuations at all when growth rates are commensurately low. Presently, depressed interest rates simply add insult to injury, because both stocks and bonds are now at valuations that imply dismal future returns for passive investors. That situation will undoubtedly change over time, but here and now, we estimate an expected total return averaging just 0.5% annually for a conventional mix of passive investments (60% S&P 500, 30% Treasury bonds, 10% Treasury bills) over the coming 12-years.
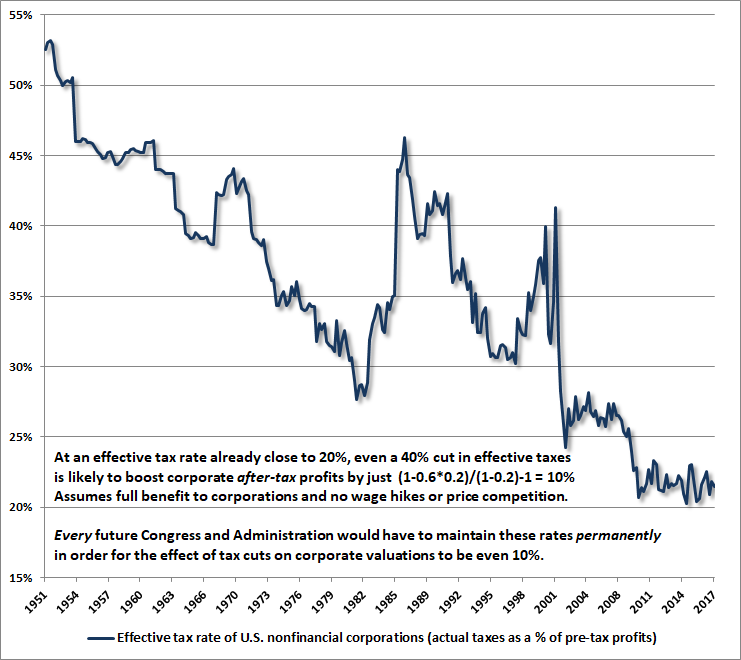
A side-note on corporate tax cuts. Prior to the recent corporate tax reductions, the effective tax rate on U.S. corporations (actual taxes paid as a fraction of pre-tax profits) was already down to just 20%. Even if the recent cuts result in a further 40% reduction in actual taxes paid, the impact on corporate profits will be just 10%. Since stocks are a claim on decades and decades of future cash flows, that 10% increment would only justify a 10% increase in stock prices if the tax reduction can be expected to survive every future U.S. Administration and Congress.
Measure what is measurable
Put simply, in my view, stock prices are rising not because Wall Street has thoughtfully quantified the effect of taxes, interest rates, corporate profits, or anything else. Instead, Wall Street is mesmerized by the self-reinforcing outcomes of its own speculation, relying on verbal arguments, optimistic projections lacking grounds in observable data, and enthusiastic assertions about cause-effect relationships that are accepted without the need for any evidence at all (much less decades of it).
Back to Galileo. Measure what is measurable, and make measurable what is not so. When we do this, come to understand the current speculative extreme as the tension between two observations that are not actually contradictory – just uncomfortable. One is that stock prices are indeed three times the level at which they are likely to end the current market cycle. The other is that there is no pressure for valuations to normalize over shorter segments of the cycle, as long as risk-seeking speculative psychology remains intact.
The combination of these two considerations demands that investors operate with a safety net (ideally that does not require the ability to execute sell orders as prices decline). Yet it also warns investors to refrain from aggressively fighting Wall Street’s speculation until market internals deteriorate more clearly. It’s fine to adopt a neutral stance, but it’s best to accept that over this segment of the market cycle, Wall Street carries neither historical memory nor respect for the disastrous consequences that have ultimately followed previous episodes of speculation.
Yes, speculation can and occasionally does take the market to a multiple of its appropriate value. The only alternative to this view is to imagine that the collapses that followed valuation extremes like 1929, 1973, 2000, and 2007 somehow emerged entirely out of the blue, ignoring the fact that valuations accurately projected likely full-cycle losses, and remained tightly correlated with total returns over the subsequent 10-12 year horizons.
Still, it’s very true that during a speculative bubble, the level of valuations is not sufficient to identify the point that speculation will shift to risk-aversion. While “overvalued, overbought, overbullish” syndromes were useful in previous market cycles, our reliance on those syndromes in recent years has been detrimental. A more dependable measure of these shifts in investor psychology is the uniformity or divergence of market action across a broad range of securities.
Potential and kinetic
Think of valuations three times their appropriate level as measuring “potential energy.” Similarly, think of market internals as helping to identify the point that this potential energy is most likely to be transformed into “kinetic energy” – that is, actual motion in a specific direction.
It’s a statement about potential energy to say that the S&P 500 is dramatically above the level that we expect it to reach over the completion of market cycle. It recognizes what’s essentially baked in the full-cycle cake as a result of measurable deviations between prices and reasonably discounted long-term cash flows.
We can’t make a reliable statement about kinetic energy – that is, market direction – until that downside potential actually becomes vulnerable. That occurs at the point that investors begin a subtle shift toward risk-aversion, which we read through the behavior of market internals. We don’t even need to know what will produce that risk-aversion, because the extent of the market losses over the completion of a market cycle are generally more closely related to the preceding level of overvaluation than they are to the particular event that prompts the risk-aversion. As Didier Sornette correctly observed in Why Markets Crash, “The collapse is fundamentally due to the unstable position; the instantaneous cause of the crash is secondary.” My sense is that investors are going to learn this again the hard way.
On the accelerating slope of the current advance
Speaking of Didier Sornette, I’ve periodically discussed his concept of “log periodic power-law” price behavior, which has accompanied speculative episodes in numerous markets and often precedes inflection points or collapses. This structure is based on a purely mathematical fit to price behavior, and does not reflect any valuation considerations. It’s not part of our own investment discipline, but we occasionally fit the log-periodic structure to price behavior when market movements are particularly extreme.
In recent years, those structures have generally identified inflection points of flat or correcting prices, but certainly not crashes in the S&P 500. Given the increasingly steep slope of the current market advance, along with the most extreme valuations in history and the most lopsided bullish sentiment in more than three decades, it’s quite possible that this instance will be different. In any event, the underlying “arbitrage” considerations described by Sornette are worth reviewing here.
In 2000, as the tech bubble was peaking, Nobel laureate Franco Modigliani observed that the late stages of a bubble can be “rational” in a certain sense, provided that investors are inclined to self-reinforcing behavior.
Imagine a market that you fully believe to be overvalued and at risk of a market crash. Indeed, let’s say that there is a defined probability of a crash, which increases rapidly as the pitch of the market advance becomes more extreme. Should you sell? Well, it depends. Given that an immediate crash is not certain, a speculator must, in each period, weigh the potential gain from holding a bit longer against the potential loss from overstaying. Sornette uses a similar argument to describe a speculative bubble advancing toward its peak (italics mine):
“Since the crash is not a certain deterministic outcome of the bubble, it remains rational for investors to remain in the market provided they are compensated by a higher rate of growth of the bubble for taking the risk of a crash, because there is a finite probability of ‘landing smoothly,’ that is, of attaining the end of the bubble without crash.”
“This line of reasoning provides us with the following important result: the market return from today to tomorrow is proportional to the crash hazard rate. In essence, investors must be compensated by a higher return in order to be induced to hold an asset that might crash. As the price variation speeds up, the no-arbitrage conditions, together with rational expectations, then imply that there must be an underlying risk, not yet revealed in the price dynamics, which justifies this apparent free ride and free lunch. The fundamental logic here is that the no-arbitrage condition, together with rational expectations, automatically implies a dramatic increase of a risk looming ahead each time the price appreciates significantly, such as in a speculative frenzy or in a bubble. This is the conclusion that rational traders will reach.”
The chart below shows our current best-fit parameterization of Sornette’s log-periodic structure, applied to the S&P 500 Index. Notably, unless we allow for the slope of the current market advance to become quite literally infinite, it’s impossible to closely fit the current price advance without setting the “finite-time singularity” – the point at which instability typically emerges – within a few days of the present date. Notably, the singularity is not the date of a crash. Rather, it’s the point where the pitch of the advance reaches an extreme, which may simply be an inflection point (as has been the case for other structures in recent years) or a pre-crash peak.
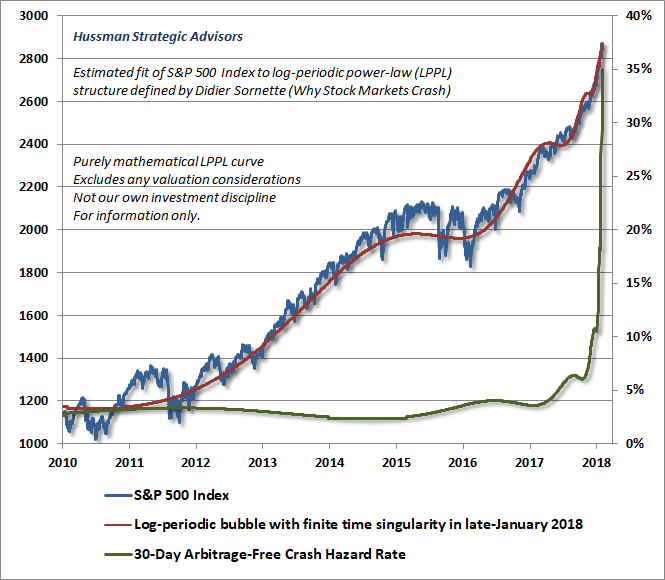
The collapse is fundamentally due to the unstable position; the instantaneous cause of the crash is secondary.
– Didier Sornette
If you want my opinion (which we don’t trade on and neither should you), my opinion is that this singularity will prove to be more than an inflection point. Though nearly every morning prompts the phrase “Yup, they’re actually going to do this again,” the steepening pitch of this ascent – coupled with record valuation extremes, record overbought extremes, and the most lopsided bullish sentiment in over three decades – now produces the most extreme “overvalued, overbought, overbullish” moment in history. In prior cycles across history, similar syndromes were either joined or quickly followed by deterioration in market internals. In this cycle, it has been essential to wait for explicit deterioration in market internals before establishing a negative outlook. Notably, the market has lost value, even since 2009, when overvalued, overbought, overbullish conditions were joined by divergent internals.
I expect the S&P 500 to lose approximately two-thirds of its value over the completion of this cycle. My impression is that future generations will look back on this moment and say “… and this is where they completely lost their minds.” As I’ve regularly noted in recent months, our immediate outlook is essentially flat neutral for practical purposes, though we’re partial to a layer of tail-risk hedges, such as out-of-the-money index put options, given that a market decline on the order of even 5% would almost certainly be sufficient to send our measures of market internals into a negative condition. It’s best not to rely on the ability to execute sales into a falling market, because the range-expansion we’ve recently seen on the upside may very well have a mirror-image on the downside. As usual, we’ll respond to new evidence as it emerges.
Keep Me Informed
Please enter your email address to be notified of new content, including market commentary and special updates.
Thank you for your interest in the Hussman Funds.
100% Spam-free. No list sharing. No solicitations. Opt-out anytime with one click.
By submitting this form, you consent to receive news and commentary, at no cost, from Hussman Strategic Advisors, News & Commentary, Cincinnati OH, 45246. https://www.hussmanfunds.com. You can revoke your consent to receive emails at any time by clicking the unsubscribe link at the bottom of every email. Emails are serviced by Constant Contact.
The foregoing comments represent the general investment analysis and economic views of the Advisor, and are provided solely for the purpose of information, instruction and discourse.
Prospectuses for the Hussman Strategic Growth Fund, the Hussman Strategic Total Return Fund, the Hussman Strategic International Fund, and the Hussman Strategic Dividend Value Fund, as well as Fund reports and other information, are available by clicking “The Funds” menu button from any page of this website.
Estimates of prospective return and risk for equities, bonds, and other financial markets are forward-looking statements based the analysis and reasonable beliefs of Hussman Strategic Advisors. They are not a guarantee of future performance, and are not indicative of the prospective returns of any of the Hussman Funds. Actual returns may differ substantially from the estimates provided. Estimates of prospective long-term returns for the S&P 500 reflect our standard valuation methodology, focusing on the relationship between current market prices and earnings, dividends and other fundamentals, adjusted for variability over the economic cycle.