

Incubation Phase: Gradually and then Suddenly


John P. Hussman, Ph.D.
President, Hussman Investment Trust
June 2020
Key points
1) The May jobs “shocker” was largely a reflection of CARES coverage of corporate payrolls.
2) The gap between Wall Street and Main Street appears similar to the “incubation phase” of other major downturns.
3) Federal support remains essential, but is best targeted toward preserving the “circular flow” of the economy by supporting the basic incomes of families and incentives for productive investment, limited to those actually experiencing economic damage.
4) After years of overborrowing to finance stock repurchases (partly to offset dilution from stock-based compensation), many corporations were overleveraged coming into this crisis. Bankruptcies are likely to increase, but the government can support packaged restructurings and bank purchase-and-assumption transactions without bailing out private investors, who agree to accept these risks in a free-enterprise system.
5) Fed “leverage” of CARES funds to purchase uncollateralized corporate bonds violates FRA 13(3), CARES 4003(c)(3)(B), and potentially Article 1 Section 8 of the U.S. Constitution.
6) Projects that are enabled only by zero interest rates are most likely projects that are speculative and unproductive.
7) Improved market internals currently encourage an agnostic near-term outlook (though not a bullish one) despite several features that suggest the improvement is fragile.
[Interim Update 6/11/20: Given the fragile and whipsaw-prone improvement of market internals (discussed below), the market weakness since this comment was published on 6/8/20 already suggests a shift back to a negative condition. We prefer to make this determination based on a full evaluation of weekly data. Suffice it to say that internals remain unsupportive of a bullish or constructive outlook in any event.]
8) Valuations are again near historic extremes.
9) Continued dispersion within the U.S. equity market suggests particular risk for richly valued large-cap stocks.
Incubation phase
On Friday June 5, the Bureau of Labor Statistics reported that U.S. nonfarm payrolls jumped by 2.5 million in May, following a (downwardly revised) loss of 19.7 million jobs in April, sending Wall Street on a full-tilt, dubstep remix of “Happy days are here again.” It was a fitting choice, given that the song was written in 1929. Of course, the Great Depression also began with a spectacular financial rebound that bore no relationship to the underlying deterioration on Main Street.
Severe economic recessions often feature what might be called an “incubation phase,” where an exuberant rebound from initial stock market losses becomes detached from the quiet underlying deterioration of economic fundamentals and corporate balance sheets. From the post-crash low of November 13, 1929, the Dow Jones Industrial Average enjoyed a 48% rebound, peaking on April 17, 1930, followed by an 86% collapse by July 8, 1932 (an overall loss of 89% from the September 3, 1929 bull market peak).
To understand the apparent jobs report “shocker,” a bit of arithmetic may be useful. As part of the $3 trillion CARES economic bailout package, the “Paycheck Protection Program” (PPP) provides $349 billion to small businesses, which can cover payroll costs for up to 24 weeks, and is payable regardless of whether employees are actually working or not – so long as they are kept on the payroll. Now, median personal income in for U.S. workers is about $34,000 a year, and 24 weeks amounts to $15,700. So $349 billion of PPP funds essentially covers the paychecks – temporarily – of over 22 million U.S. workers.
In the Household Survey, which is used to calculate the unemployment rate, the Labor Department admitted that survey takers mistakenly counted 4.9 million furloughed workers as employed, but did not correct the data, ostensibly “to avoid the appearance of political manipulation.” Accordingly, the reported unemployment rate was 13.3% for the month of May. The corrected data would show a 16.1% unemployment rate.
Even that figure does not reflect the 4.7 million workers who have abruptly dropped out of the civilian labor force since March, and are not included because they are not presently looking for work. To gauge this impact, note that the ratio of May civilian employment (corrected for miscounts) to the March civilian labor force is 0.812. So even if every single worker currently counted as “employed” would still retain that status without PPP or other CARES funds covering their paycheck, a plausible estimate of the U.S. unemployment rate would still be about 18.8%.
A New York Times analysis noted that if one includes marginally attached U-6 workers, those working part-time but looking full-time work, and those reporting they want a job but are not currently looking, the unemployment rate would be 27.0% here. However, that figure can’t be directly compared with the headline number, which never includes these categories.
Still, Wall Street was shocked and exuberant that reported employment bounced back by 2.5 million, evidently not giving a moment’s thought of what has financed this rebound, nor the fact that this support is impermanent. What we are observing is not “recovery,” it’s the impact of a government program that is paying the salaries of employees that are kept on payroll, whether they are actually working or not.
One thing that Wall Street does have going for it, however, is that to the extent that companies are still generating revenues, and are paying workers with PPP funds from the government, some portion of the $349 billion in PPP funds actually represents a pure subsidy to profit. That’s because forgiveness of these loans is not conditional on whether companies have actually suffered economic damage.
While the PPP program is targeted toward small businesses, some portion of the $500 billion slush fund provided to the U.S. Treasury for states, municipalities, and businesses is also likely to feed into profit subsidies – though not enough to offset overall weakness in U.S. corporate earnings.
Many civic-minded members of Congress were distressed at how insistent some legislators were to avoid oversight that could prevent the misuse of public funds. For a discussion of how future policies can better ensure that economic support goes to families and businesses that have been negatively affected, rather than subsidizing corporate profits, extraordinary compensation, and private investment losses, see the economic policy section of last month’s market comment.
Severe economic recessions often feature what might be called an “incubation phase,” where an exuberant rebound from initial stock market losses becomes detached from the quiet underlying deterioration of economic fundamentals and corporate balance sheets.
Part of the current enthusiasm of investors seems to be the idea that the stock market typically reaches its low before the economy does (though this was certainly not true of the 2001 recession). On the idea that the second quarter of 2020 will be the low point for the economy, there is a superficial sensibility in “looking over the valley.” The problem is that post-recession bull markets typically begin at valuations about 40% of those we observe at present.
Investors make the same mistake when they observe that the stock market essentially went nowhere between 1918 and 1920 despite the Spanish Flu pandemic, and then launched into a bull market that extended for nearly a decade. What this argument fails to observe is that market valuations between 1918 and 1920 stood at less than a quarter of current levels, representing the most steeply undervalued period in U.S. history. So yes, if the U.S. stock market loses three-quarters of its value from current levels, I expect that stocks would become fairly resilient in response to additional negative developments, and would likely enjoy an extended bull market from those levels.
Gradually, then suddenly
It’s sometimes said that “risk happens fast.” Yet underlying financial damage often has a long and quiet incubation phase, which is why Hemingway, in The Sun Also Rises, described bankruptcy as occurring “gradually and then suddenly.”
The current “incubation phase” is reminiscent of 2008. Early that year, AIG admitted that it could not “reliably quantify” its losses. In March, Bear Stearns failed. The Associated Press published an article discussing the unprecedented interventions by the Federal Reserve, including Bernanke’s creation of “Maiden Lane” shell companies to absorb bad mortgage-backed debt (which at least represented collateralized debt, unlike the uncollateralized corporate debt the Fed is illegally purchasing today). The article quoted Richard Fuld, the CEO of Lehman Brothers, who argued that this intervention, “from my perspective, takes the liquidity issue for the entire industry off the table.” Clearly, it did not remove the solvency issue.
After the failure of Bear Stearns, after strains in the subprime loan market were fully recognized, and after the Federal Reserve and the U.S. Treasury had already launched unprecedented interventions, the S&P 500 advanced in May 2008 to a level that was within 9% of its October 2007 peak, on the notion that all of the bad news had been “discounted.” The S&P 500 then lost 53% of its value.
The market reaction to the unemployment numbers today is our Bear Stearns ‘systemic risk is off the table’ moment.
– Ben Hunt, Epsilon Theory, June 5, 2020
The same sort of slow incubation characterized the financial markets in May 2001. An economic recession had already started two months earlier, and the S&P 500 had been in a bear market for over a year. But as the S&P 500 rebounded within 14% of the March 2000 bubble peak, the Wall Street Journal observed “Though economists are expecting this year to be the economy’s worst since 1991, only a tiny percentage think the economy is in a recession.” The S&P 500 would lose an additional 40% of its value by October 2002, and the technology-heavy Nasdaq 100 would lose an additional 60% of its value, bringing its overall bear market loss to 83%.
It’s sometimes said that ‘risk happens fast.’ Yet underlying financial damage often has a long and quiet incubation phase, which is why Hemingway described bankruptcy as occurring ‘gradually and then suddenly.’
In the face of a breathtaking disconnect between Main Street and Wall Street, largely based on overconfidence in free money, my sense is that there remains a crisis ahead that will emerge “gradually and then suddenly.” It is important to allow for that possibility, but nothing in our investment discipline relies on that outcome. It is enough to simply align our investment stance with prevailing, observable conditions – primarily valuations and market internals – and to shift our outlook as the evidence shifts.
On fiscal and monetary policy
Amid the enthusiasm of investors about free money, a few observations about fiscal and monetary policy may be useful.
On fiscal policy, it’s important to remember that every dollar that the government spends in transfer payments and business relief is a grant of purchasing power, which enables the recipient to obtain real goods and services from other people in the economy. Even if the money used for this purpose is borrowed or created by a printing press, it has enormous distributional consequences. It matters who gets these funds, because they give the recipient a free claim on goods and services produced by others.
That’s why it’s essential to structure these programs wisely, in a way that creates a level playing field, supplements the basic incomes of families and businesses who have actually experienced actual economic damage, encourages productive investment, and avoids public subsidies for corporate profits, extraordinary compensation, dividends, buybacks, or private investors.
One of the insidious risks that the Fed has taken during this downturn has been to violate Section 13(3) of the Federal Reserve Act. While the Fed has the authority to buy Treasury bonds and other securities that are guaranteed as to principal and interest by the U.S. government, 13(3) requires it to take collateral when it buys corporate debt, or otherwise lends to corporations, and that collateral has to be “sufficient to protect taxpayers from losses.”
The moment the Fed purchases corporate bonds beyond the amount of CARES funds directly provided by the Treasury, without taking collateral, it violates CARES explicit “requirements relating to loan collateralization, taxpayer protection, and borrower solvency.” The moment any of the Fed’s purchases generate a loss beyond CARES funds directly provided by the Treasury, it will have extended this violation to include Article 1 Section 8 of the U.S. Constitution.
See, if the Fed did not require sufficient collateral to prevent losses, and the Fed was to actually lose money as a result, it would have actually engaged in fiscal policy – effectively granting public funds to the corporation, or to the investor that sold the bonds. Of course, the Constitution vests sole fiscal authority in Congress, so transactions by the Fed having fiscal effect would be unconstitutional, which is why the Federal Reserve Act (as well as section 4003(c)(3)(B) of the CARES Act) prohibits this sort of transaction.
Treasury may use a portion of its $500 billion in support to eligible businesses, States, and municipalities, under 4003(b)(4)(B), for the purpose of “purchasing obligations or other interests in secondary markets.” But the Fed claims it has the authority to “leverage” CARES funds by a factor of 10-to-1 to make secondary market purchases of corporate debt, including junk bonds. Even members of Congress have asked Jay Powell to identify why the Fed believes it has that authority.
The moment the Fed purchases corporate bonds beyond the amount of CARES funds directly provided by the Treasury, without taking collateral, it violates explicit “requirements relating to loan collateralization, taxpayer protection, and borrower solvency” that the CARES Act emphasized like a children’s book – using the phrase “For the avoidance of doubt.” The moment any of the Fed’s purchases generate a loss beyond CARES funds directly provided by the Treasury, it will have extended this violation to include Article 1 Section 8 of the U.S. Constitution.
After years of overborrowing to finance stock repurchases (partly to offset dilution from stock-based compensation), many corporations were overleveraged coming into this crisis. Indeed, debt securities and loan obligations of U.S. nonfinancial business hit the 97% of corporate revenues in 2019 – the highest level in history – making the debt-servicing capacity of these companies more vulnerable to profit-margin setbacks than ever before.
Yes, bankruptcies are likely to increase, but the government can support packaged restructurings and bank purchase-and-assumption transactions without bailing out private investors, who agree to accept these risks in a free-enterprise system.
It’s important to understand why it would be so illegal and insidious for the Fed to “leverage” CARES funds to buy corporate bonds. See, when the Fed (legally) buys Treasury bonds and other obligations that are guaranteed as to principal and interest by the U.S. government, it withdraws those government obligations from the hands of investors, and replaces them with other government obligations that we call “base money” (currency and reserves). This is not fiscal policy (government spending) because total publicly held government liabilities don’t change. Monetary policy just changes the mix of government obligations held by the public.
Likewise, when the Fed uses CARES funds provided by the Treasury to buy corporate bonds from investors, it’s using Congressionally approved funds for that purpose. We can still argue that it violates taxpayer protection requirements, but at least it’s using funds approved by Congress.
In stark contrast, if the Fed “leverages” those CARES funds beyond amounts that were approved by Congress, it creates new government liabilities (base money) beyond what was actually budgeted, and hands those funds to investors in return for corporate debt that is not guaranteed as to interest and principal by the U.S. government, and is not backed by collateral “sufficient to protect taxpayers from losses.” In doing so, the Fed fashions itself as an independent fiscal authority equal to Congress. Allowing this would establish the Fed as an independent fiscal authority with the ability to arbitrarily bail out private investors using public funds.
The central principle and Constitutional requirement here is simple: Fed purchases may only involve instruments that are backed either directly by the U.S. government, or by explicit collateral sufficient to avoid loss to the public. That’s the only way to prevent the Fed from becoming a separate fiscal authority.
As for the stock market, keep in mind that when the Fed buys an asset such as a Treasury bond, and pays for it by creating base money, the base money (currency and bank reserves) created in that transaction remains in the form of base money until it is retired by the Fed. The moment a stock buyer puts those dollars “into” the stock market, they go right back “out of” the market in the hands of the seller.
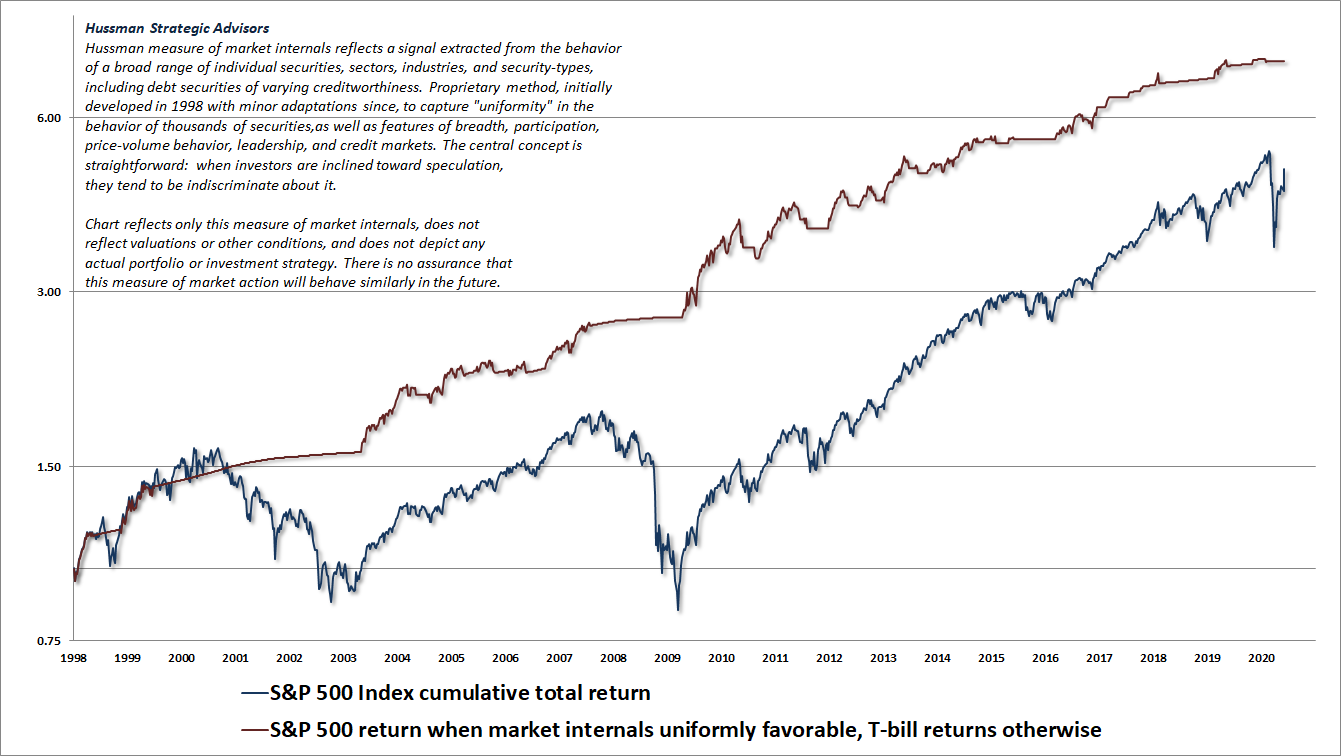
So the notion that the Fed is “pumping money” into the markets reflects a misinterpretation of how monetary policy operates. What the Fed does is to take interest-bearing assets from investors and replace them with base money that bears little or no interest. Fed easing affects the stock market mainly by encouraging yield-seeking speculation by the holders of zero or low-interest base money, who pass it from one investor to the next like a hot potato. As I’ve noted before, this has historically only contributed to net stock market gains in periods where investors have been observably inclined toward speculation (as gauged by the uniformity of market internals).
My impression is that investors have become overconfident in the idea that easy money can support extreme market valuations, regardless of the surrounding economic environment. U.S. equity market capitalization exceeds $40 trillion. The U.S. Treasury has allocated $25 billion of CARES economic support funds for the Federal Reserve’s to purchase outstanding, uncollateralized corporate bonds from private investors. Even if the Fed illegally “leverages” this amount to $250 billion, and even if these funds were entirely diverted to stock purchases, the Fed could absorb less than 1% of U.S. equity market capitalization.
Why excessively easy money is destructive
On the subject of broader Fed interventions, such as interest rate policy, it’s worth taking a moment to think about what interest rates actually mean.
A nominal interest rate determines the number of additional dollars one will owe in the future, in return for a dollar borrowed today. Similarly, a “real” interest rate simply determines the number of additional “goods and services” one will owe in the future, in return for a unit of goods and services borrowed today.
Question: What sort of projects do the Fed encourage with zero nominal interest rates, that aren’t worth doing at even interest rates of 1-2%?
Answer: Only projects with near-zero rates of return – primarily those that involve enormous amounts of leverage, where interest is the primary cost of doing business. The main activity that fits these criteria is yield-seeking financial speculation. This is exactly what produced the mortgage bubble and the global financial crisis, and what has encouraged U.S. corporations to burden themselves with cheap, low-grade covenant-lite debt and leveraged loans, increasing their risk of bankruptcy, for which they now cry for public support.
Question: What sort of projects do the Fed encourage with negative real (after-inflation) interest rates, that can’t even jump the hurdle of a zero real interest rate?
Answer: Only projects with negative real rates of return – primarily those that destroy capital and harm economic productivity. If these marginal projects aren’t worth doing unless the real interest rate is negative, then by definition, they are incapable of producing the same amount of real goods and services that is required to initiate them.
The monetary dogma of the Federal Reserve seems to view the U.S. economy as one big demand curve that always benefits from low nominal interest rates, and negative real interest rates. It is exactly the dogma that produces repeated economic cycles driven first by yield-seeking speculative bubbles, and then by financial crises that count on the bailout of private losses with public funds.
What sort of projects do the Fed encourage with negative real interest rates, that can’t even jump the hurdle of a zero real interest rate? Only projects with negative real rates of return – primarily those that destroy capital and harm economic productivity.
Before these bankruptcies and defaults emerge, understand this: bankruptcies are mainly packaged restructurings, and bank failures are mainly purchase-and-assumption transactions. What amplified the Depression was not bankruptcy and bank failure itself, but disorganized and piecemeal bankruptcy and bank failure. The public shouldn’t support bailouts. We should instead support quick restructurings that preserve corporate assets, jobs, and business activity, but also appropriately wipe out the equity and debt of companies that have been managed irresponsibly. That’s how risk-taking works. Why use public money to absorb losses that private investors willingly agreed to take the moment they bought corporate securities?
Market internals encourage an agnostic near-term outlook (though not a bullish one)
The S&P 500 has rebounded to within 6% of the most extreme level in U.S. history, to valuations that – on the measures we find best-correlated with actual subsequent market returns – again rival the 1929 and 2000 extremes. We currently project negative S&P 500 nominal total returns on both 10-year and 12-year horizons. Our estimate of likely 12-year total returns on a conventional passive investment mix (60% S&P 500, 30% Treasury bonds, 10% Treasury bills) is now also negative, at -0.10%. That’s lower than every historical extreme, including August 1929, except for the first three weeks of February 2020.
Despite these headwinds, the repeated series of bubble-crash cycles of recent decades teach that there is no natural limit to the stupidity of Wall Street. When investors get the speculative bit in their teeth, it’s fine to be neutral, but it’s best not to fight the speculation by adopting or amplifying a bearish outlook.
Over any limited segment of the market cycle, it doesn’t really matter whether the beliefs of investors are well-informed or wildly misguided. It also doesn’t really matter, in the short-run, whether market valuations are consistent with strong positive long-term returns or with negative ones. In the short-run, what matters is whether investor psychology is inclined toward speculation or toward risk-aversion. We gauge that inclination through the uniformity or divergence of market internals across thousands of individual stocks, industries, sectors and security-types, including debt securities of varying creditworthiness.
Largely by the brute force of investor exuberance in response to the May employment report, we observed a speculative shift in our measures of market internals (as of June 5 closing data). This shift may be a short-lived whipsaw, but for the moment, it encourages an agnostic near-term market outlook.
As you may recall, we shifted to a relatively neutral short-term outlook at the March lows, based on the oversold “compression” I noted at the time. In recent weeks, the combination of overbought conditions, extreme valuations, overbullish advisory sentiment and options activity, and other factors has encouraged a more bearish outlook. The shift in internals does pull us back to an agnostic short-term view for now.
Emphatically, this is not a “buy signal,” nor what I would view as a constructive “opportunity” to add investment exposure. Rather, given the likely level of market volatility relative to the volatility currently reflected in index option prices, my inclination is to adopt an investment stance that is fairly neutral in response to “local” market movements, keeps a strong safety net, but for now, refrains from a bearish response in the event of a further advance.
I’ll say that again. In the context of extreme valuations, economic headwinds, and overbought extremes, the shift in market internals here is not a “buy signal” or even a constructive “opportunity.” It’s more like the cast of Jackass showing up on your driveway with skateboards and dynamite. You don’t need to join them, and you expect that it will end badly, but since you don’t know what they’ve got in mind, or how long they’ll hang around, it’s best not to stand directly in front of them.
Largely by the brute force of investor exuberance in response to the May employment report, we observed a speculative shift in our measures of market internals. This shift may be a short-lived whipsaw, but for the moment, it encourages an agnostic near-term market outlook.. Emphatically, this is not a ‘buy signal,’ nor what I would view as a constructive ‘opportunity’ to add investment exposure. Rather, my inclination is to adopt an investment stance that is fairly neutral in response to ‘local’ market movements, keeps a strong safety net, but for now, refrains from a bearish response in the event of further advance.
Shifts in our measures of market internals have a median duration of about 20 weeks, though about a quarter of these shifts persist for 7 weeks or less, and about a quarter persist for 40 weeks or more. About 10% of shifts are whipsaws that persist for less than two weeks. That’s actually what I expect in this instance, but I’ve learned not to make too many assumptions about investor psychology.
Put simply, my impression is that the shift in internals here is most likely a brute-force, speculative “top-tick” whipsaw, but that doesn’t mean we can ignore it, especially when the Fed has extended its interventions to actions that are illegal.
One of the reasons I suspect this particular shift in internals may be a whipsaw is because we observed conditions just shy of current ones at the very peaks of bear market rallies in May 2001 and May 2008, just before the stocks began their respective plunges to fresh lows. Both of these periods occurred early in recessions, as investors raced to “buy the dip” while the ultimate damage of those recessions was still “incubating.” Though those episodes lacked the exuberant employment report that was sufficient to bump our measures positive this month, my discussion of market conditions then was otherwise quite similar to what we observe presently.
The real losers over the coming decade will be investors who insist on holding overvalued stocks as they decline, and who abandon stocks only after the pain of a falling market finally becomes overwhelming. Our strongest assets in the years ahead will likely be discipline, respect for valuation, and a willingness to sit out market rallies that display poor internal strength. It is important to note, however, that overvaluation alone does not determine market direction. When the market is able to recruit ‘trend uniformity’ across a wide range of market internals, an overvalued market can easily become more overvalued. Essentially, trend uniformity means that investors are increasingly willing to take stock-market risk. It does not matter why they are willing to take more risk, or whether their concept of the world is valid. We do believe that the U.S. is already in recession, and that stocks remain in a bear market likely to generate much more serious losses.
– John P. Hussman, Ph.D., May 14, 2001
In recent weeks, investors have chased stock prices higher (on relatively dull volume and narrow, cyclical leadership) like kids riding their bikes up a board they’ve laid over a pile of bricks to take a sweet jump. Once in the air, the question is ‘what now?’ As of last week, valuations remained unfavorable for stocks. Meanwhile, however, market action continued to hover near the point where speculation could begin to feed on itself. In short, the fundamentals continue to appear very poor, but market action is at something of a crossroads. The reality is that as recessions develop (and I continue to believe the U.S. faces a much more significant downturn than we’ve observed to date), the data can take months to accumulate to a compelling verdict, and in the meantime, speculative pressures can remain alive. If the consolidation to clear the current overbought condition is fairly shallow, it will suggest that speculation might begin to feed on itself for a while. A sharp selloff from current levels, particularly on lopsided negative breadth, would suggest that the second round of negative financial and economic news is somewhat nearer.
– John P. Hussman, Ph.D., May 19, 2008
Current valuation extremes suggest that the S&P 500 could lose about two-thirds of its value over the completion of the current market cycle, even without moving below historically reliable valuation norms. Our assessment about long-term returns and full-cycle risk does not change in response to a whipsaw in market internals, nor a short-term shift, nor an intermediate-term shift. Still, internals do frame our near-term response, and encourage us not to fight a rally from here by adding bearish exposures – at least not until we observe a fresh deterioration in these measures.
Valuations are again near historic extremes
Even though the behavior of market internals encourages a rather neutral near-term outlook, at least until we observe fresh deterioration in those measures, it’s essential to understand how extreme valuations are from the standpoint of historical norms, and of the complete market cycle.
The chart below shows our estimate of prospective 10-year returns on a “menu” of broad investment options, where all of these estimates have a correlation of 0.89 or higher with actual subsequent returns on these asset classes, in market cycles across history. Each line shows a notable point in history – either a bear market low such as August 1982, October 2002, and March 2009, or a bull market peak such as March 2000, October 2007, or February 2020. The line labeled “CURRENT” shows the present menu of investment options. It should be clear that investors face among the worst set of passive investment choices in history.
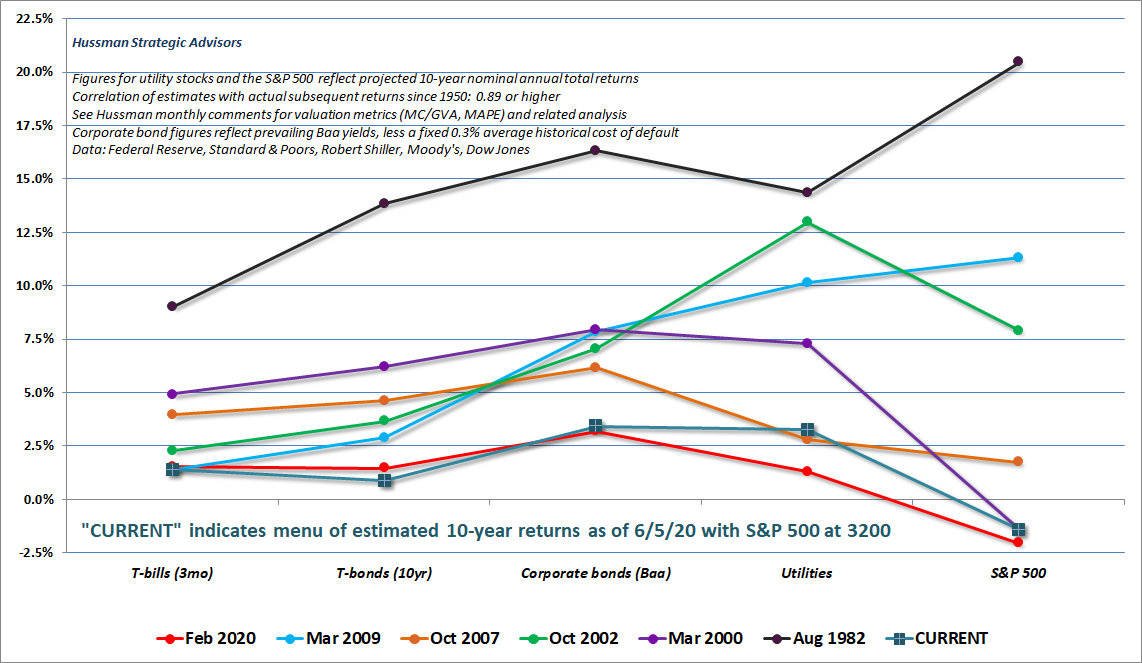
It’s important to understand that while U.S. interest rates are quite low, so too are prospective returns on stocks. When analysts argue that low interest rates “justify” high stock market valuations, what they’re really saying is that low interest rates “justify” low future returns on stocks as well. Raising stock valuations is how those low future returns are established. So when you hear that word “justify,” understand that it’s really an effort to “justify” dismal future stock returns.
The current situation is actually somewhat worse, because producing dismal future stock returns only requires elevated valuations if the trajectory of future cash flows is held constant. Unfortunately, while it’s true that interest rates since 2008 have been about 3% lower than normal, so too has been the growth rate of nominal GDP and S&P 500 revenues (even including the impact of share buybacks).
The result is that above-average valuations are not at all required to reduce stock returns to a level that is “competitive” with low interest rates. Low nominal growth rates do that already, so no valuation “premium” is required. As you can prove to yourself using any discounted cash flow model, if interest rates are low, but growth rates are also low, no increase in valuation multiples is “justified” at all.
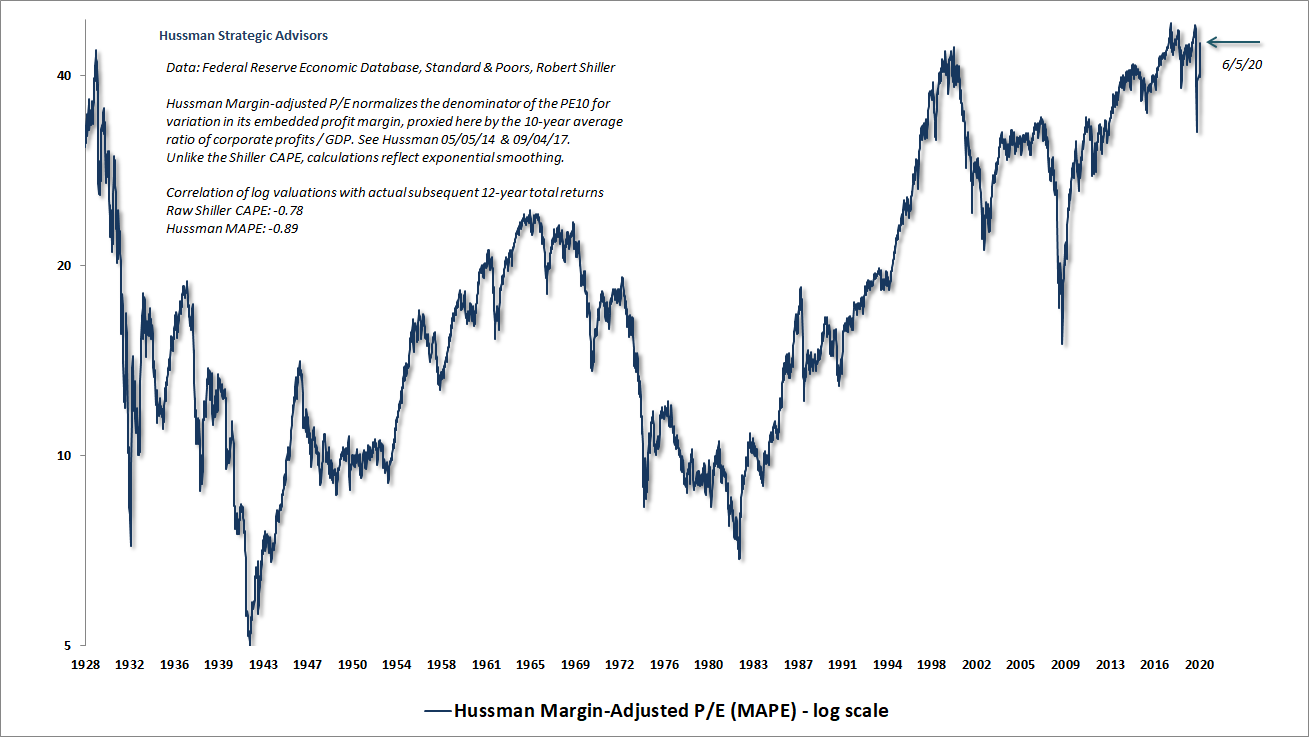
That’s a problem given that the most reliable valuation measures we identify across history are again at nearly three times ordinary, run-of-the-mill historical norms that have been revisited or breached at the bear market low of nearly every market cycle in history.
Above-average valuations are not at all required to reduce stock returns to a level that is ‘competitive’ with low interest rates. Low nominal growth rates do that already, so no valuation ‘premium’ is required. If interest rates are low, but growth rates are also low, no increase in valuation multiples is ‘justified’ at all.
The chart below shows our Margin Adjusted P/E (MAPE) across history. Notice in particular that current extremes rival those of 1929 and 2000, and nearly match those reached in February.
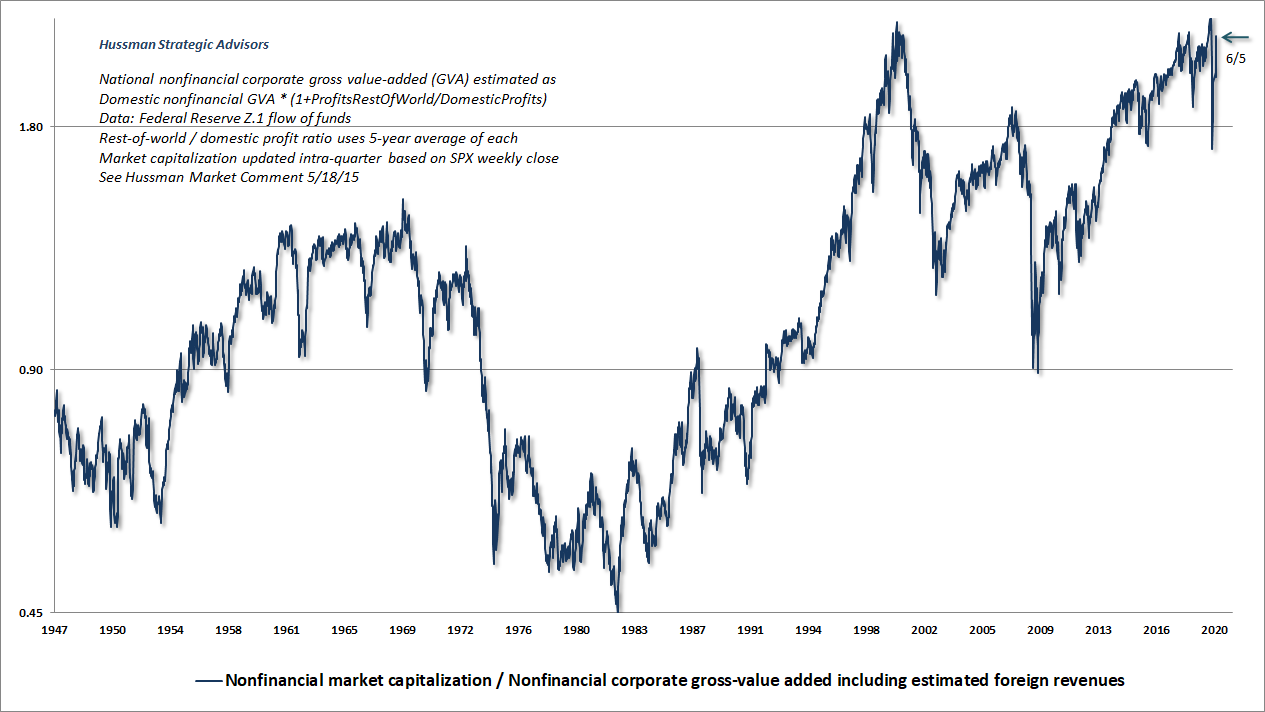
A similar perspective is provided by the ratio of nonfinancial market capitalization to corporate gross-value added, including estimated foreign revenues (MarketCap/GVA), which is the most reliable valuation measure that we’ve studied or introduced over time.
The next chart provides a historical perspective on why I expect, much like I did in 2000, that the market is likely to spend a decade or more “going nowhere in an interesting way.” The green line in the chart is our estimate of run-of-the-mill historical valuation norms. The blue line is the actual S&P 500. The red line is the “durable” level of the S&P 500 that was not revisited at any point in the future. Because advances above the green valuation line tend to be transient, the current red line is set at our present estimate of long-term valuation norms, which stand at roughly the 1180 level on the S&P 500.
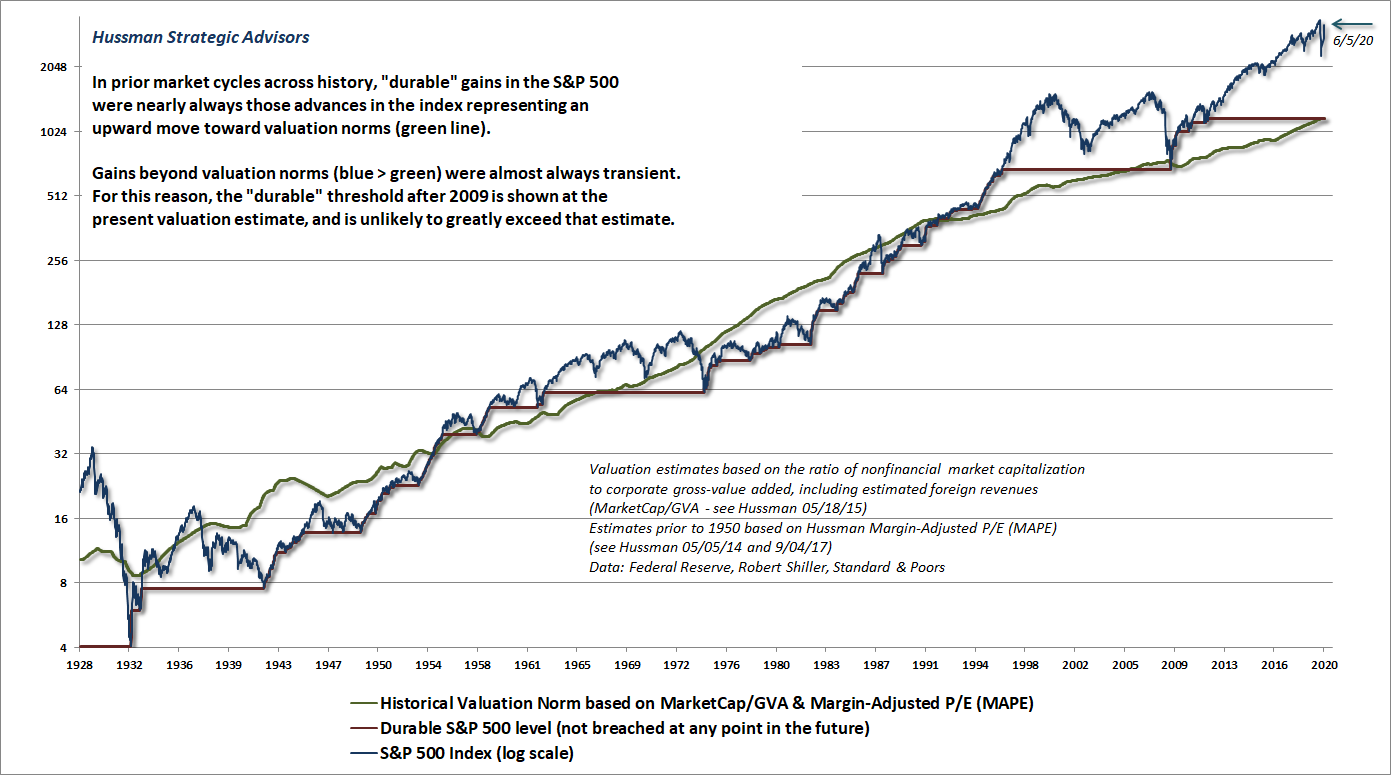
Importantly, our investment discipline neither requires a market retreat to historical valuation norms, nor do we rule out a retreat below those levels. It’s certainly true that lower valuations provide greater latitude to establish unhedged and aggressive market exposure, especially in periods where our measures of market internals are favorable as well. What we require is only adherence to a historically-informed, full-cycle discipline that responds to valuations, market internals, and other factors as they change over time.
That ability to respond to changing market conditions in a disciplined way is the one thing that passive buy-and-hold investors don’t have, and I strongly believe that it’s the primary factor that will determine investment success over the coming decade. Lacking a flexible discipline, my view is that passive investors are doomed to go nowhere in an interesting way over the coming 10-12 year horizon.
Predicting versus identifying
From the standpoint of our value-conscious, full-cycle investment discipline, our exposure to overall market fluctuations, as well as the extent of our defensiveness, will continue to respond to the combination of valuations, market internals, and other observable conditions as they change over time. Our objective here is not to “predict” future market conditions, but to “identify” and align ourselves with prevailing ones. I remain confident that the adaptations we made in late-2017 will help us to navigate a financial market that features breathtaking overvaluation and steep economic headwinds, as well as extraordinary monetary and fiscal interventions.
Presently, our long-term and full-cycle market outlook remains profoundly negative, but our immediate outlook is rather agnostic because of the shift in market internals that we observed in response to the May jobs report. My impression is that this may prove to be a very brief whipsaw, given the similarity of current conditions to those of May 2001 and May 2008, but we don’t ignore shifts in internals on that basis. If you want a near-term forecast, I don’t have one. We’ll respond to the evidence as it comes.
My overall investment view is this: I continue to expect profound market losses over the completion of the current cycle, but my immediate market outlook is fairly neutral. My preference is for investment positions that have little sensitivity to “local” market movements, but ideally have the ability to benefit from large market movements in either direction. Until we observe a fresh break in internals (which could occur as early as next week, but may occur later), I wouldn’t be inclined to “fight” an extension of the recent market rebound with fresh bearish positions.
I describe the recent shift in our measures of internals as “brute force” and vulnerable to “whipsaw” because even though we observe enough uniformity across asset classes to shift these measures to the speculative classification, we certainly don’t observe a great deal of uniformity within the stock market itself.
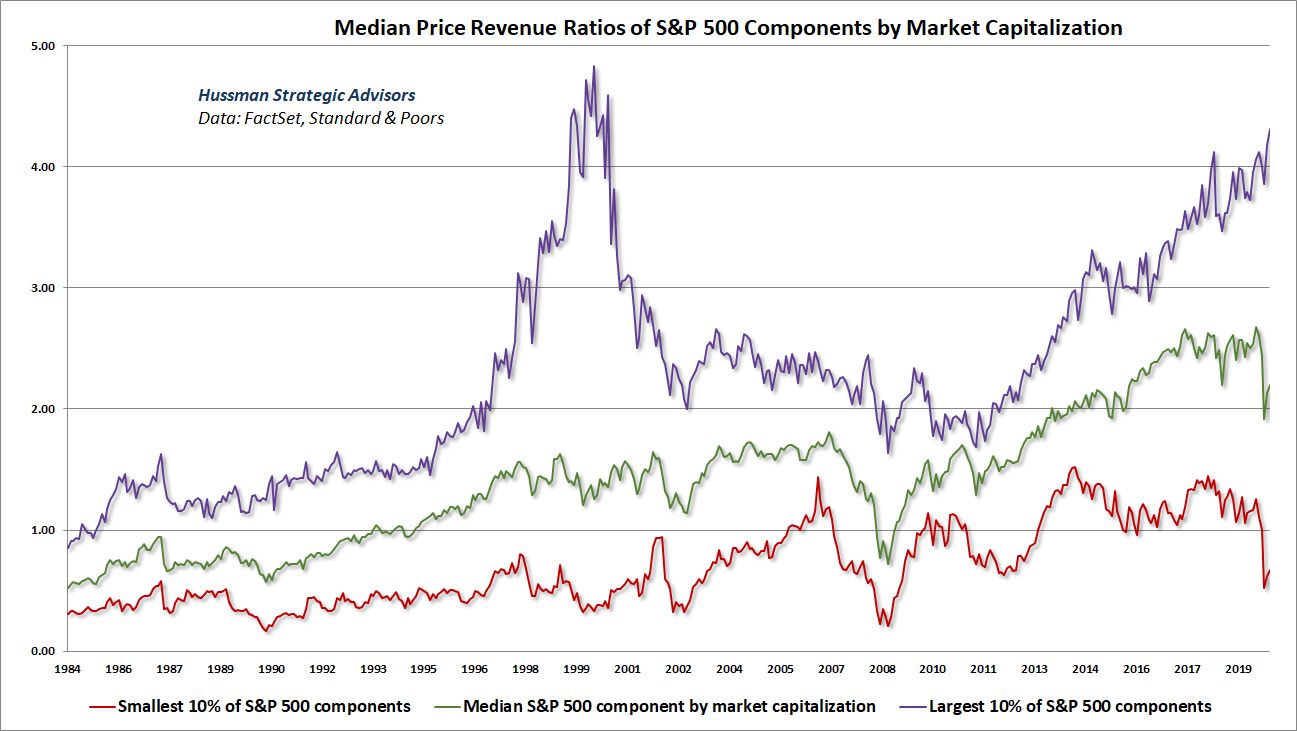
The following charts will give you a sense of what I’m observing here. Below, we’ve partitioned the S&P 500 into 10 deciles of 50 stocks each. The charts show median price/revenue ratios over time and across groups.
The first chart divides S&P 500 stocks by market capitalization. The purple line shows that the largest 10% of S&P 500 components are at median valuations that approach the 2000 extreme. Not surprisingly, the largest 10% of S&P 500 stocks suffered much deeper losses than the overall index in the subsequent bear market. Note also that the current group doesn’t simply comprise a handful of glamour tech stocks, but reflects the valuations of the largest 50 stocks in the S&P 500.
Notice the difference in behavior between the top 10% of S&P 500 stocks and the median S&P 500 stock, as well as the smallest 10% of S&P 500 components. This sort of internal dispersion is part of the reason I’m a bit skeptical about the latest shift in market internals – though again, we can’t ignore these shifts even if we’re skeptical about them.
The chart below shows the median valuation of S&P 500 components, ranked in deciles from lowest to highest price/revenue ratios. Again, the striking feature here is internal dispersion, where the most richly valued stocks are also the ones that have rebounded most strongly in recent weeks, while stocks in the lowest valuation deciles have enjoyed smaller rebounds.
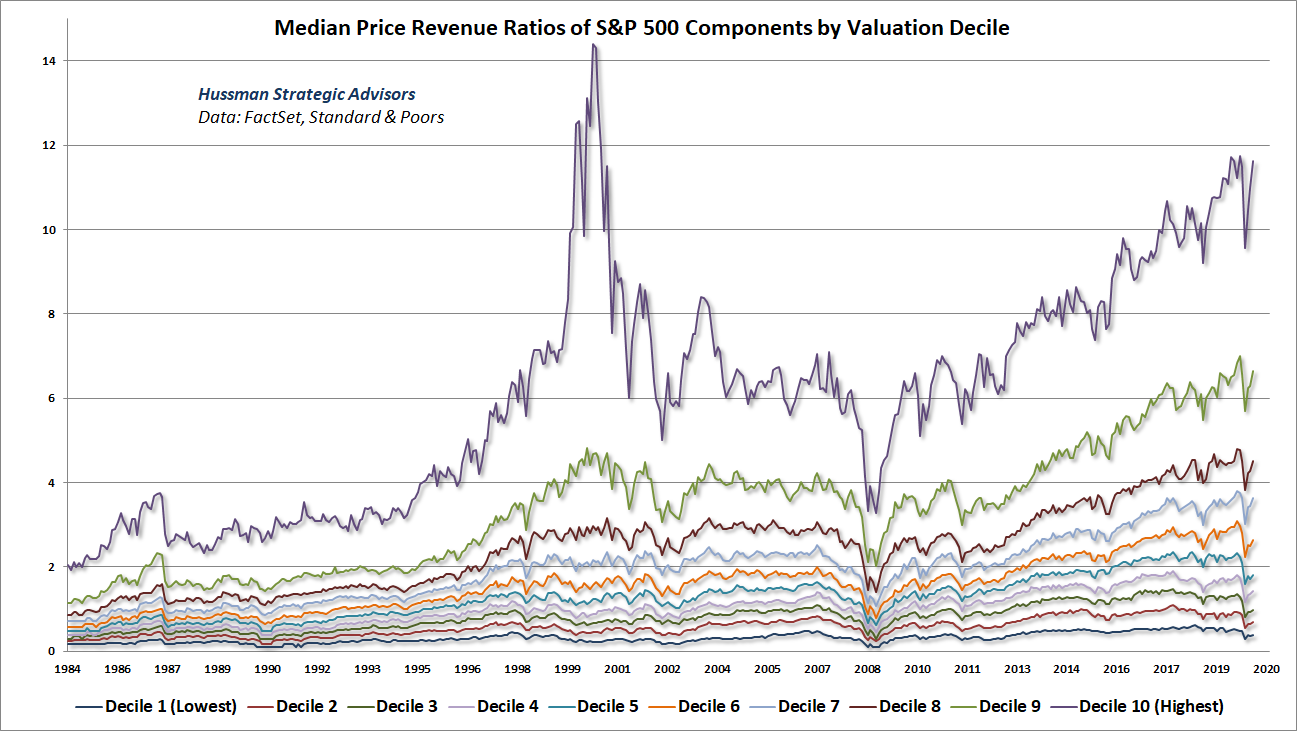
In my view, the wide dispersion between richly-valued, mega-cap components of the S&P 500 and the broader market is likely to create an enormous headwind for passive index investors over the coming decade, but will simultaneously create enormous opportunities for investors with the flexibility to pursue broad, value-conscious stock selection.
As for the most obvious set of richly-valued, mega-cap components of the U.S. equity market, it may be useful to remember that while disruptive emerging growth companies often enjoy remarkably high growth rates as they establish and dominate the market, growth also slows as these companies saturate their respective industries. This was the case for the Nifty Fifty stocks of the 1970’s, it was the case for the glamour stocks of the tech bubble, and there is every indication that the same process is already well underway for the current crop of glamour stocks.
The chart below shows the 2-year revenue growth of some of the largest and most richly valued companies in the U.S. market. Each point shows a separate fiscal quarter. The horizontal axis shows company revenue at each point in time, as a fraction of 2020 trailing 12-month revenue.
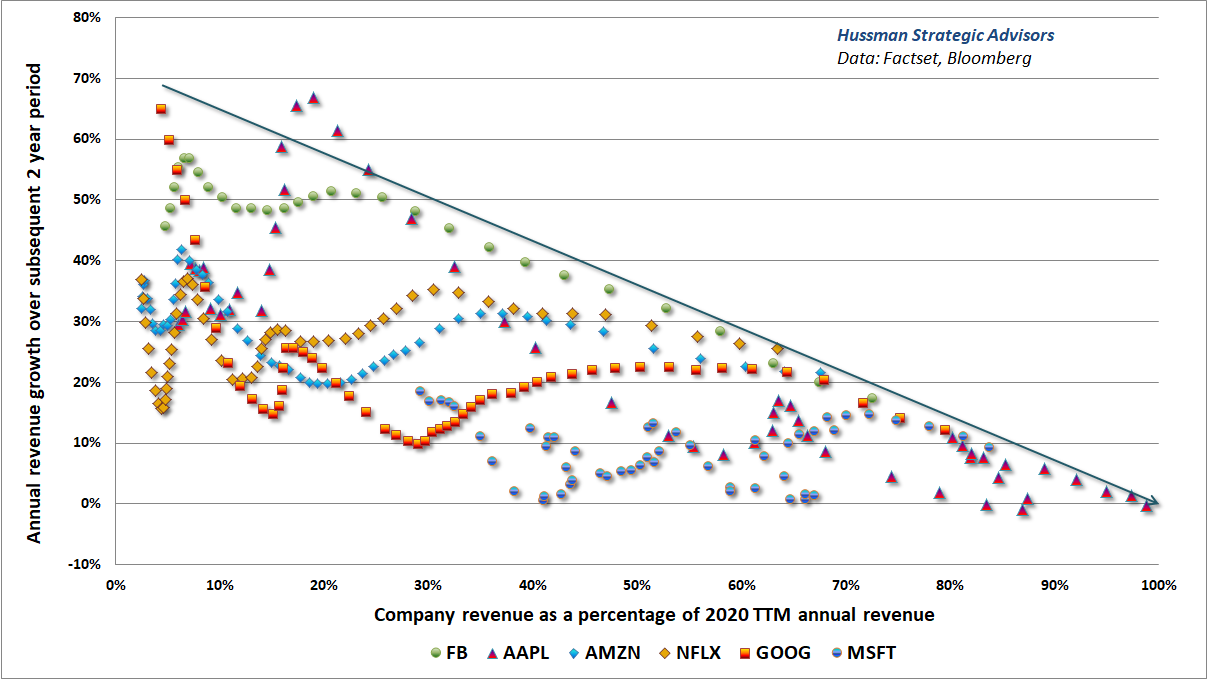
You’ll notice that when these companies were very small, relative to their current size, their growth rates were spectacularly high. But as each has approached its current size, the corresponding 2-year revenue growth has slowed remarkably. In my view, all of these companies are headed toward growth rates that are likely to converge toward single-digit rates similar to the growth rate of the overall economy. That’s not how investors are pricing these large-cap glamour stocks.
Final thoughts
.. a few paragraphs from the section “On Peace” from my January 16, 2017 comment:
Those of you who know me well know that I’ve had three mentors in my life; two of them, Jimmy Carter and my teacher Thich Nhat Hanh, who I’ve been blessed to call my friends; and Dr. King, who our nation rightly celebrates this week (and who, to close the circle, long ago nominated Thich Nhat Hanh for the Nobel Peace Prize). Among the many things they’ve all taught, and stood for, is that the person we might call our adversary is another human being, suffering in a way that we may not understand – perhaps from hatred, ignorance, fear, or perceptions of injustice – and that the only path to reconciliation is to encourage each to understand and address the suffering of the other. It’s always possible to do that in a way that is consistent with our own security.
My sense is that the peace of our world, and the civility of our nation, is at risk because people don’t really trust that idea. They’ve come to believe that an adversary is someone to be insulted, and attacked, and ultimately destroyed. That’s the behavior that they see modeled for them; encouraged to ignore our interconnectedness – that all of us are empty of a separate self, and full of causes and conditions that are common to our humanity. We become a stronger nation and a better world when each of us feels heard – and I don’t mean just when “we” feel heard and respected, but also when whomever we call “they” also feel heard and respected.
It’s often imagined that peace is the result of sufficiently crushing one’s opponent; of inflicting so much injury and suffering that they surrender. There’s little doubt that conflicts can be ended in this way, but only at terrific cost, and with deep scars that feed later hatreds and conflicts. Others somehow come to imagine that waging peace requires one to lay down defenseless. It’s just not so. Peace doesn’t mean that one doesn’t defend oneself, or refrain from criticism. Peace doesn’t demand the absence of strength. It asks each side to see and understand the suffering of the other, whether that suffering is rooted in reality or misperception. It asks us to refrain from needlessly provoking the adversary, or to insult them in order to boost our pride. It asks us to look to address their suffering in ways that are consistent with our own security. If peace demands anything from us, it is to refrain from being infected by hatred. Dr. King recognized that:
“Darkness cannot drive out darkness; only light can do that. Hate cannot drive out hate; only love can do that. I have decided to stick with love. Hate is too great a burden to bear.”
It is not possible to be in favor of justice for some people and not be in favor of justice for all people.
– Rev. Dr. Martin Luther King, Jr.
Keep Me Informed
Please enter your email address to be notified of new content, including market commentary and special updates.
Thank you for your interest in the Hussman Funds.
100% Spam-free. No list sharing. No solicitations. Opt-out anytime with one click.
By submitting this form, you consent to receive news and commentary, at no cost, from Hussman Strategic Advisors, News & Commentary, Cincinnati OH, 45246. https://www.hussmanfunds.com. You can revoke your consent to receive emails at any time by clicking the unsubscribe link at the bottom of every email. Emails are serviced by Constant Contact.
The foregoing comments represent the general investment analysis and economic views of the Advisor, and are provided solely for the purpose of information, instruction and discourse.
Prospectuses for the Hussman Strategic Growth Fund, the Hussman Strategic Total Return Fund, the Hussman Strategic International Fund, and the Hussman Strategic Allocation Fund, as well as Fund reports and other information, are available by clicking “The Funds” menu button from any page of this website.
Estimates of prospective return and risk for equities, bonds, and other financial markets are forward-looking statements based the analysis and reasonable beliefs of Hussman Strategic Advisors. They are not a guarantee of future performance, and are not indicative of the prospective returns of any of the Hussman Funds. Actual returns may differ substantially from the estimates provided. Estimates of prospective long-term returns for the S&P 500 reflect our standard valuation methodology, focusing on the relationship between current market prices and earnings, dividends and other fundamentals, adjusted for variability over the economic cycle.