
Brief Observations: Hindenburgs and Titanics


John P. Hussman, Ph.D.
President, Hussman Investment Trust
Interim Comment: November 14, 2017
Brief Observations
I’ve noted over the years that substantial market declines are often preceded by a combination of internal dispersion, where the market simultaneously registers a relatively large number of new highs and new lows among individual stocks, and a leadership reversal, where the statistics shift from a majority of new highs to a majority of new lows within a small number of trading sessions.
– John P. Hussman, Ph.D., Market Internals Go Negative, July 30, 2007
Just a brief comment on market action. On Tuesday November 14, the number of NYSE stocks setting new 52-week lows surged above the number of stocks setting new highs, with both figures representing more than 3% of total issues traded. This “leadership reversal” joins the deterioration in our own measures of market internals last week, as well as ongoing dispersion in market breadth and participation. As noted in the chart below, this couples a “Hindenburg” with a “Titanic,” and is actually the first time since July 2007 that we’ve seen this particular combination of internal deterioration. Each of the red bars below was also associated with unfavorable market internals on our own measures.
While the names of these indicators may seem silly and overly menacing, they actually get at something very serious. They capture situations where the major indices are near new highs, yet market internals show much greater divergence. In my view, this type of market behavior is indicative of a subtle shift in the preferences of investors, away from speculation and toward risk-aversion. Coupled with the most extreme “overvalued, overbought, overbullish” syndromes on record, the behavior of market internals warrants close attention. Credit spreads are also worth monitoring, as junk bond yields have surged in recent days.
Importantly, we always have to allow for the possibility that market internals will recruit fresh strength. Our measures of internals reflect current, observable conditions, and suggest increasing investor risk-aversion, but this deterioration is not a “lock” on a negative outlook. We’ll take the evidence as it arrives, but today’s leadership reversal seems worth noting in the context of the other internal deterioration we’ve observed in recent days.
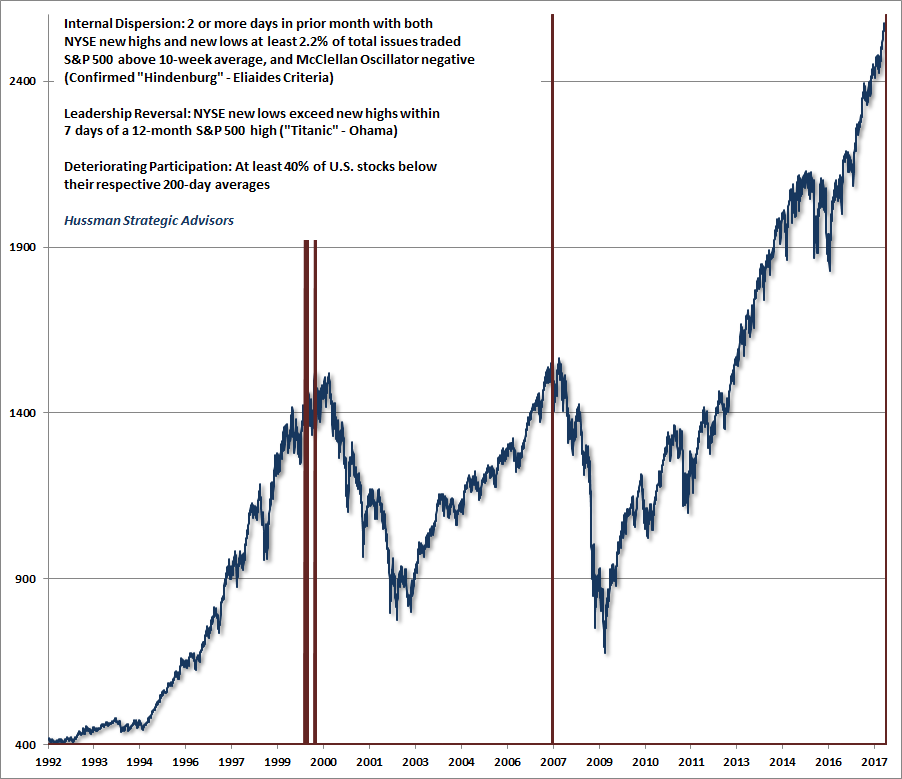
As a sidenote, if we expand the window for a leadership reversal to within 10 days of a 12-month high instead of 7 days, there would be one additional signal on the chart above, in October 2007. That was also notable in the context of broader internal deterioration, including three “confirmed” Hindenburg signals on Peter Eliades’ criteria (which are more stringent than signals based on new highs and lows alone). Taken alone, I’ve often observed that signals like Hindenburgs and Titanics aren’t nearly as ominous as they sound. However, they are more informative when they are coupled with broader evidence of internal deterioration, particularly following extended periods of overvalued, overbought, overbullish market conditions. As I noted in real-time, just after the what turned out, in hindsight, to be the 2007 peak:
Though I wouldn’t take the 3 consecutive signals last week as a compelling warning in themselves, I do think they deserve mention because they are occurring so close to unusually overvalued, overbought, overbullish conditions that independently warranted concern last week. With regard to our own measures relating to new highs and new lows, we observed a ‘leadership reversal’ last week – a sudden flip from new highs dominating to new lows dominating, with significant numbers of both, within a few days of a market peak. Those reversals are generally a signal that there is an underlying “turbulence” in market internals, which is a symptom of increasing skittishness by investors.
– John P. Hussman Ph.D., Forget the Lesson, Learn it Twice, October 22, 2007
Keep Me Informed
Please enter your email address to be notified of new content, including market commentary and special updates.
Thank you for your interest in the Hussman Funds.
100% Spam-free. No list sharing. No solicitations. Opt-out anytime with one click.
By submitting this form, you consent to receive news and commentary, at no cost, from Hussman Strategic Advisors, News & Commentary, Cincinnati OH, 45246. https://www.hussmanfunds.com. You can revoke your consent to receive emails at any time by clicking the unsubscribe link at the bottom of every email. Emails are serviced by Constant Contact.
The foregoing comments represent the general investment analysis and economic views of the Advisor, and are provided solely for the purpose of information, instruction and discourse.
Prospectuses for the Hussman Strategic Growth Fund, the Hussman Strategic Total Return Fund, the Hussman Strategic International Fund, and the Hussman Strategic Dividend Value Fund, as well as Fund reports and other information, are available by clicking “The Funds” menu button from any page of this website.
Estimates of prospective return and risk for equities, bonds, and other financial markets are forward-looking statements based the analysis and reasonable beliefs of Hussman Strategic Advisors. They are not a guarantee of future performance, and are not indicative of the prospective returns of any of the Hussman Funds. Actual returns may differ substantially from the estimates provided. Estimates of prospective long-term returns for the S&P 500 reflect our standard valuation methodology, focusing on the relationship between current market prices and earnings, dividends and other fundamentals, adjusted for variability over the economic cycle.