|
|
||||||
|
|

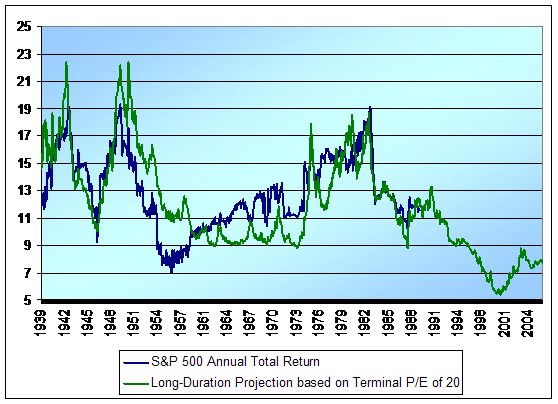
August 29, 2005 The 40-Year Forecast for the S&P 500 Index One of the essential facts about investing is that despite wide cyclical fluctuations, long-term growth in fundamentals such as earnings and dividends closely tracks long-term growth in GDP. Measured from peak-to-peak across economic cycles, S&P 500 earnings, for example, have grown at a very durable 6% annual growth rate as far back as one cares to measure. This is true even though short-term earnings growth can exceed 20-30% annually when measured from the trough of a recession to the peak of an expansion. Since stocks are a claim on a very long-term stream of future cash flows, it turns out that valuation measures based on smoothed long-term fundamentals (such as dividends, smoothed earnings, or my preferred measure - the most recent peak in earnings) are much more reliable than valuation measures based on volatile, "raw" fundamentals such as trailing 12-month earnings. The good behavior of long-term fundamentals has a corollary: most of the variation in stock market returns is driven by changes in the relationship between prices and smoothed fundamentals. This is particularly true over long horizons. Valuations may not have too much to say about short-term returns, but they very strongly determine long-term returns. The February 22, 2005 market comment (The Likely Range of Market Returns in the Coming Decade) contains charts and additional details on these facts, as well as my basic formula for projecting market returns over the long-term. This week's issue of Barron's magazine contains a brief article by Keith Wibel which follows at least some of this logic, concluding that long-term returns for stocks are likely to be relatively low over the coming decade. While the article is interesting and useful, it uses raw earnings to compute both growth rates and P/E ratios, so the calculations contain a great deal of unnecessary noise. For instance, while he correctly recognizes that long-term S&P earnings growth has averaged 6% annually, he gives 10-year growth a likely range of 3.8% to 10.4%, and price/earnings ratios a likely range of 9.4 to 23.4. But variations within these ranges are not independent: temporarily depressed earnings produce high P/E ratios, while elevated earnings produce low P/E ratios, other things being equal. So the fluctuations we observe in earnings growth and P/E multiples are highly correlated, and don't represent independent sources of uncertainty. By not correcting for this with smoothed or peak-earnings, his estimated range of 10-year returns is far too wide, because it contains two sources of correlated, uninformative noise that can be easily eliminated. The article concludes with 10-year return projections for stock returns, ranging between -1.7% and 12.2% annually, centered around 6%. Using smoother earnings measures, you can get even more accurate estimates. As noted in the February 22, 2005 comment, the likely range of 10-year returns is much closer to 2-3% annually, with extreme bounds of -3% and about 7.8%. The 40-year forecast for the S&P 500 Index: 7.8% annually Needless to say, it seems almost absurd to suggest a 40-year forecast for S&P 500 returns, but the intellectual exercise is useful. What's interesting is that over long-periods like this, it doesn't matter much what P/E ratios do. For instance, a 40% increase in the P/E ratio over a 40-year period increases returns by less than 1% annually. Similarly, a 40% plunge in the P/E ratio over that holding period reduces returns by just over 1% annually. For that reason, we'll go ahead and be optimistic in setting our return projections, assuming that the terminal P/E at the end of the holding period is 20 times peak earnings. As for the time horizon of the forecasts, we'll start with a basic proposition from finance: for an investment with a "duration" of T years, the terminal wealth achieved over a T-year holding period is relatively independent of the path that the investment takes over time. That's a fancy way of saying, for instance, that if you hold a bond with a duration of say, 8 years, you may not know what the investment will be worth after holding it for a month or a year, but you can be much more certain of what the investment will be worth if you hold it for the full duration of 8 years. For more on the concept of duration, including the duration of the stock market, see my February 23, 2004 market comment (Buy-and-Hold for the Duration?). It follows that the tightest forecast we can make for long-term stock returns is for a holding period which matches the duration of the market. The duration of the market, as it turns out, is simply the price/dividend ratio (it takes some tedious math to get that result, but it's true). To the extent that bulls may argue that dividends are depressed here, we can capitulate and create a "phantom" dividend equal to half of current peak-earnings, and cap the duration at twice the price/peak-earnings ratio. Fine. So for instance, if the dividend yield on stocks is 4%, the duration of stocks is about 25 years. If the dividend yield is 3%, the duration of stocks is about 33 years. Currently the price/dividend ratio for the S&P 500 is about 54, but we'll cap the duration at twice the price/peak earnings ratio, or just under 40 years. I've gone ahead and calculated the long-duration forecast for the S&P 500 versus its actual total return for every period since the late 1930's. Even for very long horizons, the projection performs well, generally within 2% of the true annual return. Notice that the horizon of each forecast is simply the duration of stocks at the time, so what you're seeing on the chart are forecasts that have ranged from less than 20 years to more than 60 years in duration (the longest-duration one, unfortunately, being the one at the 2000 market peak). At present, we've got a projected long-term total return for the S&P 500 of about 7.8% annually for a probable duration of about 40 years, even making the fairly optimistic assumption that the market's P/E multiple will not contract in the future.
Does this mean that stocks will be an unsatisfactory investment for decades to come? Not at all. It simply implies that investors committing a lump-sum to the market here are unlikely to achieve satisfactory returns. My impression is that we'll probably see much better valuations within the coming decade, at which point stocks should be priced to deliver much stronger long-horizon returns. If you're an index die-hard, dollar-cost averaging into stocks, you can be comfortable staying with your plan - particularly if your existing wealth is small relative to your expected future savings. But if you've got all your dough invested in stocks, and it's all the dough you're ever going to make, think twice. Then think three times. Both theory and historical evidence are against the proposition that stocks will be a very rewarding investment for long-term investors committing a lump-sum to the stock market at current prices. It's a point I've made often in recent months, but I can't imagine how it could be over-emphasized. Market Climate As of last week, the Market Climate for stocks remained characterized by unusually unfavorable valuations and neutral market action. There continue to be indications of distribution in large capitalization stocks, with breadth relatively poor and volume duller on advances than on declines. Still, there is no compelling reason to expect a market move in any particular direction - it's sufficient to say that given current conditions, the market is likely to generate fairly tepid returns, on average, for the risk. But even with valuations unfavorable, there is not enough evidence of internal deterioration to conclude that investors are becoming strongly defensive or risk averse. That could change, but for now the Strategic Growth Fund carries a very small exposure to market fluctuations varying between 10-20% of the value of our stock holdings depending on day-to-day conditions. I wish that I could produce more excitement about the potential for some sort of dramatic market move, but large moves are generally produced by a well-defined alignment of valuations and market action in one direction or another. Explosive bull moves generally represent the intersection of favorable valuations and newly favorable market action coming off of an oversold condition. Frightening bear declines generally represent the intersection of unfavorable valuations and unfavorable market action, though in this case, the worst declines generally emerge after the market has already declined by a somewhat uncomfortable distance already. Given that, it's easy to conclude that I view the potential for a frightening bear decline in stocks as greater than the potential for an explosive bull move, but also that the transition to any major decline would first require additional internal deterioration of the sort we haven't seen just yet. In bonds, the lack of extremes in valuations suggests more of a range-bound market. Long-term Treasury prices have rebounded enough to clear the oversold condition that existed a few weeks ago. The Market Climate for bonds remains characterized by modestly unfavorable valuations and modestly unfavorable market action, with similar implications to those for stocks - no compelling reason to expect a move in any particular direction, but a likelihood of tepid returns, on average, for the risk. Widening credit spreads (the difference between risky corporate yields and default-free Treasuries) would create a bullish bias for straight Treasuries, since that spread would be an indication of potential recession risk. Substantial dollar weakness would create a bullish bias for inflation protected securities, but a murkier outlook for straight bonds. Overall then, inflation protected securities have more robust prospects of performing well in a variety of outcomes, so while the Strategic Total Return Fund continues to carry a low duration of about 2 years, the bulk of that duration remains in TIPS. The Fund also continues to hold about 20% of assets in precious metals shares, which account for most of the day-to-day fluctuation in Fund value. --- The foregoing comments represent the general investment analysis and economic views of the Advisor, and are provided solely for the purpose of information, instruction and discourse. Prospectuses for the Hussman Strategic Growth Fund, the Hussman Strategic Total Return Fund, the Hussman Strategic International Fund, and the Hussman Strategic Dividend Value Fund, as well as Fund reports and other information, are available by clicking "The Funds" menu button from any page of this website. |
|||||||||||||||||||||||||
|
For more information about investing in the Hussman Funds, please call us at
1-800-HUSSMAN (1-800-487-7626) 513-326-3551 outside the United States Site and site contents © copyright Hussman Funds. Brief quotations including attribution and a direct link to this site (www.hussmanfunds.com) are authorized. All other rights reserved and actively enforced. Extensive or unattributed reproduction of text or research findings are violations of copyright law. Site design by 1WebsiteDesigners. |