|
|
||||||
|
|

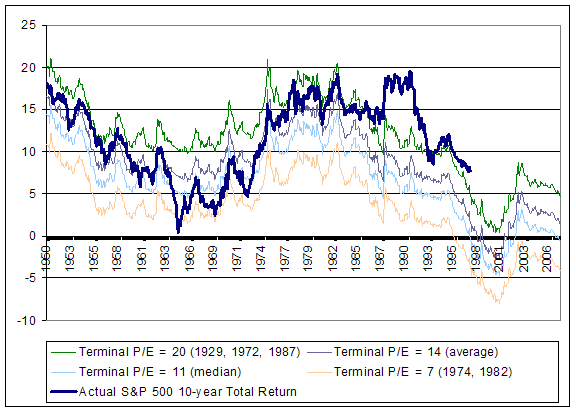
July 16, 2007 A Who's Who of Awful Times to Invest December 1961 (followed by 28% market loss over 6 months) January 1973 (followed by a 48% collapse over the following 20 months) August 1987 (followed by a 34% plunge over the following 3 months) July 1998 (followed abruptly by an 18% loss over the following 3 months) July 1999 (followed by a 12% loss over the following 3 months) December 1999 (followed by a 9% loss over the following 2 months) March 2000 (followed by a 49% collapse in the S&P over the following 30 months) The defining characteristics of these instances were: 1) price/peak-earnings multiple above 18 2) 4-year high in the S&P 500 index (on a weekly closing basis) 3) S&P 500 8% or more above its 52-week moving average (exponential) 4) rising Treasury and corporate bond yields Depending on how we define the interest rate trends, we can include two additional historical instances of these conditions: October 1963 and May 1996, both closely followed by 7-10% corrections. One more instance completes the list: July 2007. Careful readers will notice that there is no condition on bullish/bearish sentiment above. I've generally written about abrupt downside risks in terms of overvalued, overbought, overbullish conditions. The reason we can exclude sentiment is that the above criteria already capture such awful times to invest that adding further restrictions simply reduces the size of the list. Taking the extreme, if we limit these cases only to those where 20% or fewer investment advisors were bearish (based on Investors Intelligence figures), we exclude all the points except January 1973, August 1987, and today. It's extremely important to emphasize that I am not making a forecast or a "bearish call." The point of these remarks isn't to yell "head for them hills Vern, thar's a stampede a-comin' up yonder!" We're fully hedged, but we do not have an investment position that would be expected to lose value in the event of a continued advance. Indeed, the Strategic Growth Fund is within 1% of an all-time high, including reinvested distributions. Though we are strongly conservative here, we are not fighting this market with a position that would predictably lose if the market gains. The point of this analysis is instead to emphasize that based on prevailing market conditions, we have no evidence on which to accept market risk here. There is no need to forecast a decline - it is enough that, on average, the market has lagged Treasury bills in conditions similar to the present (though the skew, depth and abruptness of the historical losses in this case are striking). No evidence to take market risk, no market risk taken. It's that simple. I recognize that our defensiveness in recent months has probably seemed interminable. I do have less conservative versions of our hedging approach that could have accepted greater market risk in the past few years, but only by allowing larger drawdowns historically. Even these have been defensive in recent months. Though these versions might have added several percent to our returns during the bull market portion of this particular cycle, the overall increment to long-term returns (compared with the approach I use in practice) is only a fraction of a percent annually at best, since most or all of the captured gains from being more aggressive would generally have been surrendered in market downturns. Tracking the market more closely in advances at the cost of greater losses in downturns, with little or no overall return for the round-trip, seems like "empty calories" to me. My impression is that shareholders are better served by the Fund taking the minimal amount of risk necessary to achieve a given long-term return. But again, I do realize that the more defensive alternative can demand greater patience in market environments like this one. In any event, the fact is that current conditions fall into a fairly narrow sliver of historical experience, but one that has enough observations to draw clear conclusions. That conclusion is that overvalued, overbought, overbullish conditions (even short of the unusually extreme ones listed above) have resulted in market returns below Treasury bill yields, on average. Our strategy is not to try to predict whether the current instance will be different. To admit that there is risk is to admit that there is a range of possible returns, some better than the average, some worse. But an average outcome below Treasury bill yields, and risk to boot, is not a good combination. Consistently taking risk in such environments provides no long-term edge, only volatility. Our strategy is to align ourselves with the prevailing return/risk profile of the market, knowing that there will be many, many attractive periods in which to accept market risk, and that these periods have historically provided more than enough opportunity to capture strong returns over the full cycle, with subdued risk (see the remarks of recent weeks for some instructive examples). Frankly, I don't know whether investors will drive the market even higher in the weeks ahead. My opinion is that whatever gains emerge (and indeed, much of what has already emerged) will ultimately prove quite temporary. What I do know is that certain factors have reliably identified egregiously bad times to accept market risk, and that every historical instance similar to the present has been a disaster. The current instance may very well prove to be the exception, but I do not invest shareholder assets on the hope that the future will be entirely at odds with all available historical evidence. The likely range of long-term market returns - an update The following charts update various studies of valuations and subsequent market returns. The chart below presents the likely range of S&P 500 total returns in the coming decade. The various possibilities are based on continued long-term earnings growth in the same well-defined channel that has characterized S&P 500 earnings over the past 10, 20, 50 years and longer, and applying a range of terminal multiples to those earnings. It's clear that with a small exception of 10-year periods that ended in the late 1990's bubble, these projections have nicely contained the actual 10-year return on the S&P 500 (the solid blue line, which ends 10 years ago). Presently, the probable total return on the S&P 500 over the coming decade ranges between -4% and 5% annually, with the most likely outcome in the low single digits.
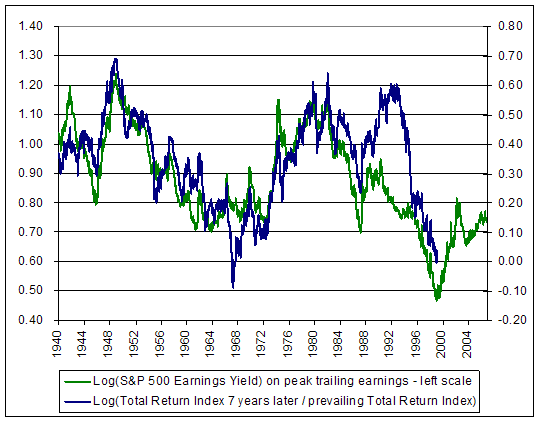
Here's a method-free version: the simplest comparison you can get (aside from having to use logarithms since Excel doesn't handle dual log scales well). It is the log of the S&P 500 earnings yield based on peak trailing earnings, compared with the log ratio of the S&P 500 total return index 7 years hence to the prevailing total return index. The values on the scale aren't intuitive, but the picture is clear as day. Note that this presently makes no correction for the level of profit margins - it assumes that the current record level of earnings, with no downward adjustment, is the correct level on which to base the P/E calculation. The current implied value of 0.14 for the log gross total return still converts to an expected 7-year total return of 4.71% annually. Calculation: [ (10^0.14)^(1/7)-1]
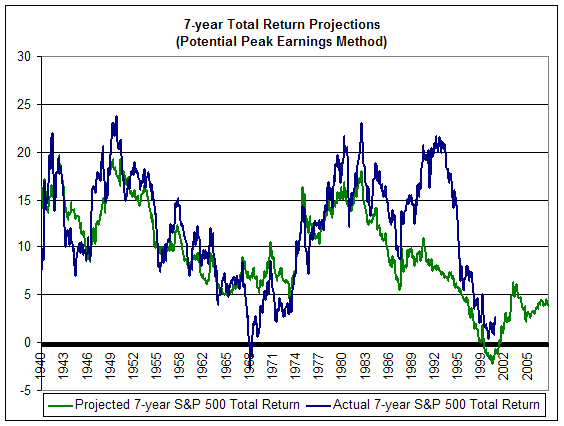
The following chart presents an alternative methodology, which projects the potential growth rate of earnings by amortizing the difference between current earnings and the well-defined historical trendline that connects S&P 500 earnings from peak-to-peak across market cycles. This approach has been quite reliable over 7-year horizons (except, again, for those 7-year periods that ended in the late 1990's market bubble). At present, the likely 7-year total return on the S&P 500 is again in the low single digits.
As I've frequently noted, it's not useful to attempt to forecast specific short-term market outcomes, but valuations have an enormous and reliable impact on long-term outcomes. Investors ignore evidence like this at their peril. It is also useful to emphasize that the defensive case does not require any expectation that earnings will fall short in the months ahead, or even that profit margins will contract over the coming quarters. If you look at the historical data, it is clear that the correlation between year-over-year earnings growth and year-over-year market performance is zero anyway. The argument is that even on the basis of current earnings - record profit margins and all - the market is very richly priced. On the basis of normalized profit margins, the situation is even worse. But we do not need to argue that earnings will decline or disappoint. The potential for margins to erode certainly strengthens the case, but is not the basis of our defensiveness. As for various convolutions of the Fed Model (which I now receive almost daily), just a general remark - it's important to remember that the 10-year bond yield is not a "permanent yield" with a duration of anything close to the duration of stocks. If we could observe a 60-year, zero-coupon bond yield (or at least a yield whose fluctuations don't damp out over much shorter horizons), then we could make a good theoretical case for pricing stocks on that benchmark. But if you are familiar with the dynamics of the yield curve, you also know that the longer the maturity of the bond, the smaller the range of yield fluctuation. Given that even a 30-year coupon bond has a duration of just 14 years or so, you can imagine how limited the yield fluctuations on a 60-year zero would be. It is that yield, not the yield on a 10-year Treasury (which only has a duration of about 7 years) that would have some hope of moving 1-for-1 with the long-term return priced into stocks. And as usual, if the model somebody presents doesn't include convincing data that shows a long-term relationship between that model and subsequent market returns (at least as tight as the relationship with the simple, raw, unadjusted price/peak earnings yield above, and in data prior to 1980), walk away. Investment professionals that hold themselves out on CNBC as "long-term investors" should be troubled by the paltry long-term returns currently priced into stocks, as well as the historical tendency toward abrupt short- and intermediate-term losses given current conditions. Otherwise any talk of being a "long-term investor" is nothing but lip service. No, multiples are not as bad as they were in the late 1990's, but those valuations have also been followed by market returns below Treasury bill yields for 8 years, and even those meager returns have been achieved only because the market has returned to high valuations currently. If the late 1990's now represent our standard of appropriate valuation, we may as well bury our savings in a bottle in the back yard, because the outcomes will be similar. When even modest future investment returns rely on profit margins and valuation multiples remaining at elevated levels indefinitely, there is no margin for error, and one is no longer investing. Market Climate As of last week, the Market Climate for stocks was characterized by unusually unfavorable valuations, extremely overbought conditions, tenuously favorable market action on the basis of market internals, and generally upward interest rate pressures. The current overvalued, overbought, overbullish combination of investment conditions has historically been associated with market returns below Treasury bill yields, on average. We need not forecast where the market will move in this particular instance - that average return below T-bill yields is enough to hold us to a defensive position. In bonds, the Market Climate remained characterized by relatively neutral yield levels and unfavorable market action, holding the Strategic Total Return Fund to a relatively short 2 year duration, mostly in TIPS. We haven't observed sufficient weakness in bond prices to warrant an increase in duration exposure, but we did observe some significant strength in precious metals shares last week, sufficient to clip our exposure from over 20% of assets down to about 15% of assets. The Market Climate for precious metals shares remains favorable here, but given the volatility of these shares, we should not be surprised by a consolidation. --- The foregoing comments represent the general investment analysis and economic views of the Advisor, and are provided solely for the purpose of information, instruction and discourse. Prospectuses for the Hussman Strategic Growth Fund, the Hussman Strategic Total Return Fund, the Hussman Strategic International Fund, and the Hussman Strategic Dividend Value Fund, as well as Fund reports and other information, are available by clicking "The Funds" menu button from any page of this website. |
|||||||||||||||||||||||||
|
For more information about investing in the Hussman Funds, please call us at
1-800-HUSSMAN (1-800-487-7626) 513-326-3551 outside the United States Site and site contents © copyright Hussman Funds. Brief quotations including attribution and a direct link to this site (www.hussmanfunds.com) are authorized. All other rights reserved and actively enforced. Extensive or unattributed reproduction of text or research findings are violations of copyright law. Site design by 1WebsiteDesigners. |