|
|
||||||
|
|

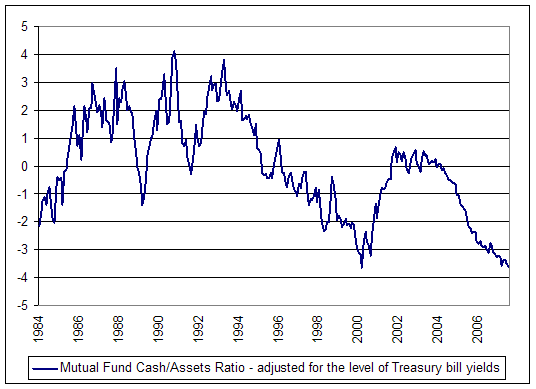
August 6, 2007 Strong Economic Optimism (... is a contrary indicator) "The way to wealth in a bull market is debt. The way to oblivion in a bear market is also debt, and nobody rings a bell. Easy access to credit facilitates the marginal transaction. It enlarges the gross national product, expands the debt industry, and creates the rationale for a future relaxation of lending standards. It hefts up prosperity by its bootstraps and makes it something more than it would otherwise be. It produces stupendous fees and underwriting commissions for investment bankers. Good ideas become bad ideas through a competitive process of "Can you top this?" But when the cycle turns, the process must swing into reverse. Marginal transactions, financed by debt, must be unwound through foreclosure or bankruptcy. Asset values, propped up by debt, must fall, and thereby reduce other asset values in a chain reaction." - James Grant ("Michael Milken, Meet Sewell Avery" 1989) As usual, I have no forecast of what the market will do in the coming weeks. Suffice it to say that both valuations and market internals are unfavorable, which demands a largely hedged position at present, but that short-term conditions are oversold, which invites the potential for a "fast, furious, prone-to-failure" advance to partially correct the recent market weakness. These "clearing rallies" are more vulnerable when they are on lighter trading volume (which we only observe as they unfold), and are typically more exploitable when interest rates and credit spreads are trending lower (which is unfortunately not the case at the moment). Again, we remain largely hedged at present. As a market decline becomes more severe, the potential "clearing rallies" can be more powerful and extensive. As a refresher, even the brutal 2000-2002 bear market decline included three separate advances in the S&P 500 in excess of 20% from intra-day low to intra-day high (March 2001 - May 2001, September 2001 - January 2002, and July 2002 - August 2002). This is something that investors are apt to forget, because they were brief and ended miserably. Longer-term shareholders will recall that we were occasionally able to exploit those by removing a modest portion of our hedges (though the Fund remained mostly hedged until early 2003). Still, in hindsight we would have done just fine had we completely missed those three separate 20% advances and simply stayed fully hedged throughout that period. Our hedging strategy is to accept market risk in conditions where the average return/risk profile of the market has been strong historically, and to avoid it in conditions where the average return/risk profile has been unsatisfactory. One need not "catch" overvalued, overbought rallies for fear of missing out forever on long-term returns. Indeed, part of my motivation for presenting various simplistic allocation models in recent weeks (e.g. Interest Rate Intuition) was to demonstrate how tolerant long-term returns are to avoiding market risk, even for long periods of time, when valuations are unfavorable, interest rates are rising, or other conditions are hostile. It's certainly true that avoiding market risk for a long period of time will periodically result in missed market advances. The issue is whether those advances are retained over the full cycle. It's notable that between the point that our measures of market internals turned positive last October to the point where they turned negative last week, a fully invested position in the S&P 500 and Russell 2000 (weighted 75% / 25%, which is about our mix of hedges) would have outperformed Treasury bills by only about 3.5%. That would have been the net additional return we might have achieved by taking a fully unhedged position during this entire period. Not that there was an ice cube's chance that we would have done so, given other market conditions. Moreover, such a position would have left us fully exposed during both the February-March decline and the recent plunge, until last week. Overbought markets usually need to traverse a lot of downside in order to finally "pull the plug" on trend-sensitive indicators. It's very easy to find methods that would have allowed a greater capture of returns over the past year, and even over the past three years. The question is how those methods perform in extensive historical data and complete market cycles, as well as the amount of volatility and drawdown they produce over time. Overvalued, overbought, overbullish periods have historically left nothing on the table for speculative investors, on average, so I certainly don't believe the attempt to capture returns in such conditions is worth the risk. In any event, my impression is that little of the market's gain over-and-above Treasury bill yields since 2003 will make it through the next bear market, whenever it occurs. Performance notes The Strategic Growth Fund set a fresh high on Friday. Including reinvested distributions, the Fund has achieved a total return of over 120% since its inception in July 2000, while the S&P 500 has achieved a total return of less than 11%. The deepest pullback in the Strategic Growth Fund during this period has been -6.98%. The deepest pullback in the S&P 500 during this period has been -47.41%. Additional performance information: As always, the Fund is intended for long-term investors, and our investment horizon is the complete market cycle. The Fund is expressly not appropriate for investors with a strong desire to track general market fluctuations. Still, I recognize that the investment industry has a strong focus on shorter-term "scoreboards," even when the performance horizons represent bull-market-only periods. On that note, there remains a gap between the Fund and the S&P 500, which would need to close by 8.22% (1.1384/1.2403-1) to put the Fund even with the S&P 500 since 2004, and 12.95% (1.1971/1.3752-1) to put the Fund even with the S&P 500 since 2003. While both the Fund and the market will fluctuate over time, these are the amounts by which the S&P 500 would have to decline, holding the Fund constant, in order to eliminate the performance differential of recent years. The S&P 500 has now lagged Treasury bills for more than 8.5 years, so I'm not sure that evaluating relative performance only over the rebounding portion of that time span is really appropriate, but in any case, we would not require catastrophic market losses in order to close that gap since 2003. Strong economic optimism (... is a contrary indicator) Despite credit concerns, Wall Street remains exuberant about economic prospects. Last week brought a 6-year high in consumer confidence, evidently supporting the idea that the consumer remains strong and the economic expansion remains intact. Unfortunately, if you examine the data, you'll quickly discover that consumer confidence is a lagging indicator, well explained by past movements in GDP, employment, and capacity utilization. Worse, for the stock market, it's a contrary indicator (especially when it is well above the "future expectations" component of the same survey). This is a fact that I've noted at both extremes, not only in early 2000 when new highs in consumer confidence supported a defensive position, but conversely in the early 1990's, when new lows in consumer confidence supported a leveraged position in stocks (prompting that "lonely raging bull" comment in the L.A. Times). High levels of economic optimism are regularly observed at the peaks of both U.S. and foreign economic expansions. This includes the general consensus of individuals, businesses, politicians, central bank officials and notoriously - economists. That shouldn't be surprising. It's the very nature of a peak that it can't be produced except by unusual optimism. Here's a phrase you don't hear a lot - "global recession." It's interesting how immediately and reflexively Wall Street rules it out. A great deal of the world's present stock market capitalization relies on ruling it out for years and years to come. The uncertainty in the economic outlook is not only that the U.S. economy appears increasingly vulnerable, but also that tensions with China are markedly increasing. Last week, the House Banking Committee - frustrated with the massive current account deficit and the depressed value of the Chinese yuan - passed a measure that would provide for countervailing duties on imports from countries that manipulate their currencies. The Senate Finance Committee passed a separate measure. The increasing concerns over the toxicity of imported consumer products - tootpaste, children's toys, fish, tires, pet food - are almost certain to lower the political barriers to more stringent trade legislation as well. Maybe it's just anectodal, but I've increasingly heard the media using the phrase "Communist China" in recent weeks, rather than simply "China." Unfortunately, as a result of accumulated deficits from military spending and irresponsible U.S. fiscal policy, China owns a substantial portion of the float in U.S. Treasury securities. Indeed, nearly all of the growth in U.S. gross domestic investment since 1998 has been financed with foreign capital inflows. Combining these ingredients is a lot like watching a small child play with a chemistry set and a pack of matches - you don't know exactly what's going to happen, but you can bet you're headed to the emergency room. Another useful contrary indicator is the mutual fund cash/assets ratio, which just hit a fresh low of 3.5%. Since cash levels tend to fluctuate with Treasury bill yields, Norm Fosback of the Institute for Econometric Research noted that the relationship to subsequent market returns is significantly improved by factoring out the effect of interest rates, which I've done in the chart below. Adjusted for interest rates, mutual fund cash levels are the lowest level, relative to assets, on record. This is another sign of extreme bullishness about the prospects for the stock market and the economy. Unfortunately, such extreme bullishness has historically been well correlated with subsequent weakness.
Still, I continue to believe that it's too early to form any strong expectation of an oncoming recession. The evidence is certainly increasing, given that credit spreads have now blown wider, and the growth rate of employment is edging closer to the levels that typically indicate imminent recession risk (1% year-over-year or 0.5% over a 6-month period). The ISM Purchasing Managers Index also shifted lower, though still above the 50 level. While readings below 50 on the PMI are not sufficient indicators of recession risk in themselves, their usefulness is substantially magnified when they occur in the context of slow employment growth, a flat yield curve, rising credit spreads and flat or declining stock prices. My impression is that we will have a much better sense of economic risks by September or October. Meanwhile, it is essential not to carry investment positions that heavily rely on market strength or market weakness. The potential for weakness is evident in the state of normalized valuations, internal market action, widening credit spreads, and other measures. But it's also important to recognize that oversold markets also contain the potential for powerful - if often short-lived - clearing rallies. Finally, while bullish sentiment on Wall Street has been extremely high for months, I doubt that this cycle will end with the same "public" frenzy for stocks as we saw in the late 1990's. The speculation of the public in this cycle has been largely tapped out on real estate - including heavy mortgage equity withdrawals. While we can't rule out the possiblity that investors will add further to their risk levels, households are already overleveraged with mortgage debt, and have long spent out their mortgage equity withdrawals of recent years. It strikes me that the extremely low mutual fund cash levels, as well as the enormous flows into speculative (and dangerously illiquid) emerging market funds, is evidence that the public is already in to the greatest extent that household balance sheets are likely to allow. Again, we can't rule out more public participation, but given the already high risk levels inherent in the elevated level of household debt to income, I'm not at all convinced that it's a promising strategy to speculate until the pizza guy starts offering stock tips. Market Climate As of last week, the Market Climate for stocks remained characterized by unfavorable valuations and unfavorable market action. The Strategic Growth Fund remains fully invested in a broadly diversified portfolio of individual stocks, largely hedged with an offsetting short position in the S&P 500 and Russell 2000 indices. Suffice it to say that little would prevent the market from moving substantially lower, but we are not relying on this, and can allow for the potential for a rebound and even the (somewhat unlikely) possibility that investors will recover their willingness to accept increasing levels of risk. I should emphasize that I am in no hurry to remove a major portion of our hedges. At the margin, however, we'll respond to the evidence as it emerges, and adjust the extent of our hedging based on prevailing market conditions and the average return/risk profiles that they have historically generated. In bonds, the Market Climate is characterized by unfavorable valuations (yield levels) and unfavorable market action. While we've observed some improvement in interest rate trends, the historical evidence is very strong that yield levels are a more important determinant of bond market returns. That's another way of saying that chasing trends is not very useful in bonds once the level of yields is relatively depressed. There's certainly some potential for a further "flight to safety," but we don't have sufficiently high yields or evidence from other factors to increase our portfolio durations here. The Strategic Total Return Fund continues to carry an average duration of about 2 years, mostly in TIPS, with close to 15% of assets in precious metals shares. As for Federal Reserve action, Fed officials have already noted that there is no significant evidence at present that the mortgage problems have spilled over to the overall economy, which is Fed-speak for "don't get your hopes up." The Fed Funds futures are clearly indicating market expectations for a rate cut later this year, but I continue to view that as somewhat problematic, given that the headline CPI number will almost undoubtedly be above 4% year-over-year by November (even if inflation figures between now and then only average 2% annually). That fact is likely to create some concerns within the FOMC about its own credibility should it cut rates at that point. As I noted last week, the prospect of a rate cut will be significantly better if measures of "resource utilization" - primarily employment and capacity use - fall out of bed. --- The foregoing comments represent the general investment analysis and economic views of the Advisor, and are provided solely for the purpose of information, instruction and discourse. Prospectuses for the Hussman Strategic Growth Fund, the Hussman Strategic Total Return Fund, the Hussman Strategic International Fund, and the Hussman Strategic Dividend Value Fund, as well as Fund reports and other information, are available by clicking "The Funds" menu button from any page of this website. |
|||||||||||||||||||||||||
|
For more information about investing in the Hussman Funds, please call us at
1-800-HUSSMAN (1-800-487-7626) 513-326-3551 outside the United States Site and site contents © copyright Hussman Funds. Brief quotations including attribution and a direct link to this site (www.hussmanfunds.com) are authorized. All other rights reserved and actively enforced. Extensive or unattributed reproduction of text or research findings are violations of copyright law. Site design by 1WebsiteDesigners. |