|
|
||||||
|
|

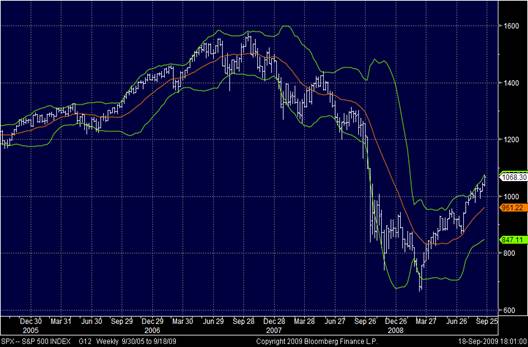
September 21, 2009 Strenuously Overbought Last week, we closed out our modest "anti-hedge" in index call options, which we have carried in the Strategic Growth Fund during recent months, and we moved back to a fully hedged investment stance. As I generally note, our measures of market action gauge aspects of market behavior well beyond the obvious recent trends of major indices, and include measures of investor sponsorship that we observe through trading volume, as well as extremes in the extent and duration of prevailing trends. On these fronts, I am concerned. I should note that we are not "calling" or "predicting" a market decline in this particular instance. Rather, we are tightening of our defenses because the overall conformation of evidence we observe here has generally not been followed by an acceptable return/risk profile, on average. I've seen a few comments over the weekend along the same lines, for example in Barron's Magazine, which notes that historically, similar extremes in the S&P 500 relative to its 200-day moving average have typically been followed by poor returns 3 months later. Yet even that isn't the whole story, because the outcomes are even more troubling if one looks at maximum drawdown over the subsequent months (rather than using a fixed time window), and because there have historically been many more instances of this type on the basis of other metrics (e.g. Bollinger bands and the like). My discomfort about strenuously overbought and moderately overvalued conditions overlaps with skepticism about the U.S. economic "recovery," which appears to be nothing but an artifact of government spending, while intrinsic economic activity remains weak. Stimulus induced "strength" is unlikely to propagate because, as I've noted before, economic recoveries are invariably led by expansion in debt-financed forms of spending such as gross domestic investment and durable goods. These classes of spending tend to lead other forms of economic activity by nearly a year, and it is difficult to expect this in an environment of heavy continued deleveraging pressure. Rather than abating, foreclosures and mortgage delinquencies are setting further records (pressured even more by continued net job losses), and we have now hit the point where Alt-A and Option-ARM resets are beginning (after a lull in the reset schedule since March). We know that post-crash markets feature partial recoveries followed by a very extended period of sideways movement. To expect an entirely different result in this instance - to assume that this is a typical post-war recovery and that everything is back to normal - seems hopeful to say the least. The percentage of bullish investment advisors now rivals that seen at the 2007 peak. Stocks are strenuously overbought. The S&P 500 is overvalued to the extent that we now expect just a 6.6% annual total return over the coming decade (a level that except for the period since the mid-1990's has corresponded more to bull market peaks than bases for sustained advances). Historically, such combinations of overbought, overvalued, overbullish evidence have generally been unrewarding, so we don't even need to consider special cases. However, recent (and in my view continuing) economic conditions are nothing if not a special case, and the historical parallel I am most concerned about is the one with the closest overlap to this one. Here is a chart of the S&P 500 in weekly data. Note that the market easily and repeatedly breached the lower green bands during the decline, so we should not assume that these bands provide reliable guidance for buying or selling. The recent advance has moved the market the full distance from lower to upper bands, however, which typically does not go uncorrected.
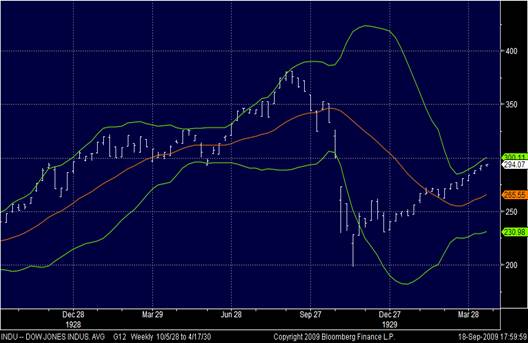
The following chart may look the same as the above chart. But it is from April 1930.
The market recovered by an almost identical percentage following the 1929 crash, peaking in April 1930, after which it suffered a subsequent decline to fresh lows. The point here is not that the same outcome will necessarily follow in this instance, but that we would be remiss not to consider the fact that investors were equally cheerful in early 1930, when the front page of the Wall Street Journal featured an article entitled "A Turn of the Tide Near" assuring investors: "It cannot be imagined that the wholesale failures and interest defaults characteristic of earlier depressions will now be repeated. Confidence in our banking system wholly precludes the money panics of former eras."
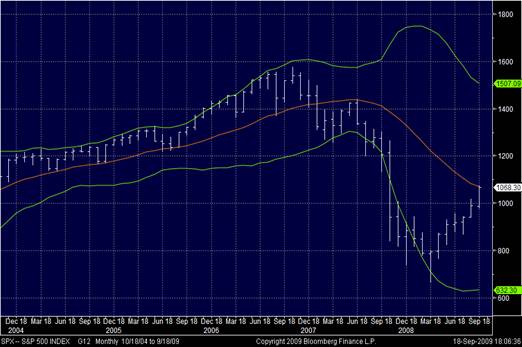
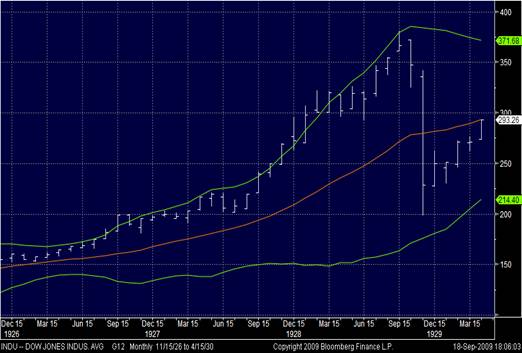
Here is the same picture, in monthly data as of Friday's close. Note that in this case the moving averages cover a longer period. So you'll note that after last year's sharp losses, the market has recovered to its 20-month moving average (the middle red line).
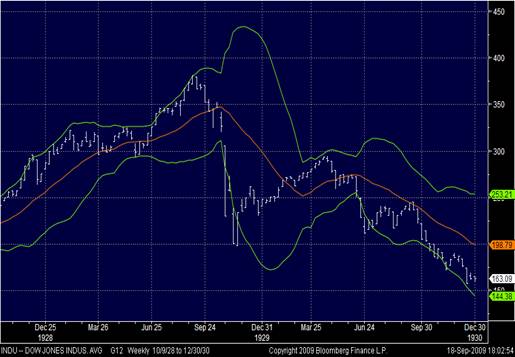
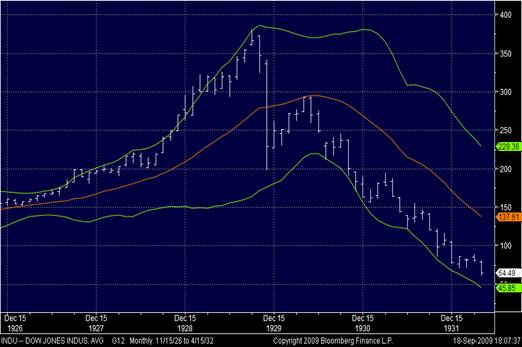
The following is the corresponding picture from April 1930.
As well as the rest of the story.
Again, none of this should be taken as a forecast. Rather, it should be considered as a warning that we should not infer too much information content from an advance borne of a steeply oversold condition, especially once that oversold condition has been fully cleared but the underlying debt problems have not. Market Climate As of last week, the Market Climate for stocks was characterized by unfavorable valuations and mixed market action - clearly positive on the basis of existing breadth and index trends, but clearly negative on the basis of strenuous overbought conditions and continued dull volume (outside of a handful of "Phoenix" stocks - see Bill Hester's latest piece - additional link below). The generally dull trading volume we've observed suggests that there is not a great deal of robust sponsorship of stocks, and that the recent advance is rather a combination of a short-squeeze coupled with a "backing off" of sellers. The risk here, which may or may not be realized, is that the market is vulnerable to "air pockets" if sellers become more eager and robust sponsorship is not there to absorb supply. In any event, I'll repeat that our concerns here don't translate into a forecast of significant losses in this particular instance. We base our investment discipline on the return/risk profile we can expect on average, and there are very few conformations of the data that reliably produce large average percentage moves in a single direction over short horizons. Suffice it to say that the probable return/risk tradeoff is not compelling here, and we are fully hedged. In bonds, the Market Climate last week was characterized by relatively neutral yield levels and modestly positive yield pressures. The main change of note in the Strategic Total Return Fund is that we significantly clipped our exposure in precious metals shares on further price strength last week, taking the Fund's investments in precious metals shares, foreign currencies, and utility shares below 10% of assets, with only about 1% of that in the volatile precious metals group. As always, we will continue to look for opportunities to expand our exposure on price weakness (provided valuation and market conditions that have historically been associated with a positive return/risk profile) and to clip our exposure on price strength and less historically-favorable market conditions. NEW from Bill Hester: Without Phoenix Stocks, Volume Continues to Contract --- The foregoing comments represent the general investment analysis and economic views of the Advisor, and are provided solely for the purpose of information, instruction and discourse. Prospectuses for the Hussman Strategic Growth Fund, the Hussman Strategic Total Return Fund, the Hussman Strategic International Fund, and the Hussman Strategic Dividend Value Fund, as well as Fund reports and other information, are available by clicking "The Funds" menu button from any page of this website. |
|||||||||||||||||||||||||
|
For more information about investing in the Hussman Funds, please call us at
1-800-HUSSMAN (1-800-487-7626) 513-326-3551 outside the United States Site and site contents © copyright Hussman Funds. Brief quotations including attribution and a direct link to this site (www.hussmanfunds.com) are authorized. All other rights reserved and actively enforced. Extensive or unattributed reproduction of text or research findings are violations of copyright law. Site design by 1WebsiteDesigners. |