|
|
||||||
|
|

June 1, 2010 Oil and Red Ink "Is this something that could happen once in a million times? Is it something that could happen once in a thousand times, or once every 5,000 times? What exactly are the risks involved?" President Barack Obama 5/17/10, addressing the Gulf oil spill As we observe the recent oil spill in the Gulf of Mexico, the recent banking crisis, and the ongoing concerns about sovereign debt in Europe, one of the things that strikes me is that few analysts are much good at assessing probabilities for worst case scenarios. We typically refer to the probability of some event Y as P(Y), and write the probability of Y, given some information X, as P(Y|X). So for example, the probability of a vehicle being a school bus might be only 1%, but given some extra information, like "the vehicle is yellow and full of children," the estimated "conditional" probability would go up enormously. With regard to oil spills, however low one might have believed P( we'll have an oil spill ) to be, prior to the recent accident, the "prior" probability estimate should change given that we've now observed one of the worst oil spills in history. Even if the oil industry previously argued that the probability of an oil spill was one in a million, it's hard to hold onto that assessment after the oil spill occurs, unless your faith in the soundness of the technology is entirely unmoved in the face of new information. See, if P( the technology is flawed | we had an oil spill) is 80%, and P( we'll have another oil spill | the technology is flawed ) is 80%, then regardless of how extremely unlikely you thought oil spills were before we observed one, or how unlikely you thought it was that the technology was flawed, you would now estimate P( we'll have another oil spill | we had an oil spill) at no less than 80% x 80% = 64%*. While there are about 3800 oil platforms in the Gulf of Mexico, only about 130 deep water projects have been completed, compared with just 17 a decade ago. So in 10 years, applying a new technology, we've had one major oil spill thus far. Unless there is some a priori reason to assume that the technology is pristine, despite the fact that it has failed spectacularly, the first back-of-the-envelope estimate a statistician would make would be to model deep water oil spills as a "Poisson process." Poisson processes are often used to model things that arrive randomly, like customers in a checkout line, or insurance claims across unrelated policy holders. Given one major oil spill in 10 years, you probably wouldn't be way off the mark using an average "arrival frequency" of 0.10 annually. From that perspective, a simple Poisson estimate would suggest a 90.5% probability that we will see no additional major oil spills from deep water rigs over the coming year, dropping to a 36.8% chance that we'll see no additional major oil spills from deep water rigs over the coming decade. Moreover, you'd put a 36.8% chance on having exactly one more major spill in the coming decade, an 18.4% chance on having two major spills, a 6.1% chance of having three major spills, and a 1.9% chance of having four or more major spills in the coming decade. This is quite a bit of inference from a small amount of data, but catastrophes contain a great deal of information when the "prior" is that catastrophes are simply not possible. Given that the worst offshore oil spill in Australia's history happened only in November 2009 (which took months to shut down), this sort of estimate does not seem unreasonable. In any event, disasters contain information. It's no longer reasonable to apply previous risk estimates even after we've observed a major spill. Similarly, before the housing crisis, it might have been tempting to shrug off mortgage defaults as relatively isolated events, since the price of housing had generally experienced a long upward trend over time. Indeed, historically, sustained declines in home prices could be shown to be very low probability events. But as the bubble continued, investors made little attempt to assess the probability of a debt crisis given that home prices had become detached from all reasonable metrics of income and ability to pay. Just as buy-and-hold investors assumed that the long-term return on stocks was constant at about 10%, despite the late 1990's valuation bubble, investors during the housing bubble kept looking at the "unconditional probability" P( credit crisis ) based on decades of normal housing valuations, when they should have recognized that the conditional probability P( credit crisis | extreme housing overvaluation and lax credit standards ) was probably higher. This turned out to be a profound oversight. But that was evidently not a sufficient lesson. As soon as the surface appearance of the problem was covered up by an expensive and opaque band-aid of government bailouts and suspension of accounting transparency by the FASB, investors went right back to using those unconditional probability estimates. Indeed, until the spike in credit spreads that began a few weeks ago, the amount of additional yield investors demanded for taking credit risk had fallen back to the lows of 2007. We've had a major credit crisis, we have failed to restructure the debt underlying that crisis, and yet investors are approaching the market as if the debt has simply been made whole and we can continue along the former path. Knowing that the cash flows from mortgage payments cannot possibly be adequate to service the original debt, that delinquencies continue to hit new records, and that there is an enormous overhang of nonperforming debt and unforeclosed homes - it seems utterly naive to assume that the problems we saw over a year ago have been adequately addressed. What holds for oil also holds for red ink. Disasters contain information. It's no longer reasonable to apply previous risk estimates even after we've observed a major spill. Credit Update My impression is that the main struggle of the stock market here is not about Europe, but rather centers on the likelihood that the U.S. will experience a second wave of credit strains. Clearly, the level of credit strains will be a function of mortgage delinquencies and foreclosure losses, both realized and anticipated. I've noted that we entered the primary window for these strains to emerge only a few months ago. Alt-A and Option-ARM mortgage resets will hit their stride between now and November, with a second, even higher peak in 2011, before finally trailing off in early 2012. I am most concerned about the "recognition phase" in which the current, very low estimates of credit strains are revised by investors. Given that delinquency rates have a strong seasonal tendency to improve in the first several months of each year, our initial read on this data - based on non-seasonally adjusted data, was mixed (see the April 19, 2010 comment). On May 19, the Mortgage Bankers Association released the seasonally adjusted data for the first quarter of 2010, indicating that in every category - total delinquencies, fixed prime, adjustable prime, fixed subprime and adjustable subprime - mortgage delinquencies surged to fresh, record highs in the quarter ended March 31, 2010. The charts below show the percentage of mortgages in each classification that are presently delinquent but are not yet in foreclosure.
Subprime delinquencies, of course, are substantially worse, with adjustable-rate subprime mortgages spiking to a delinquency rate approaching 30%.
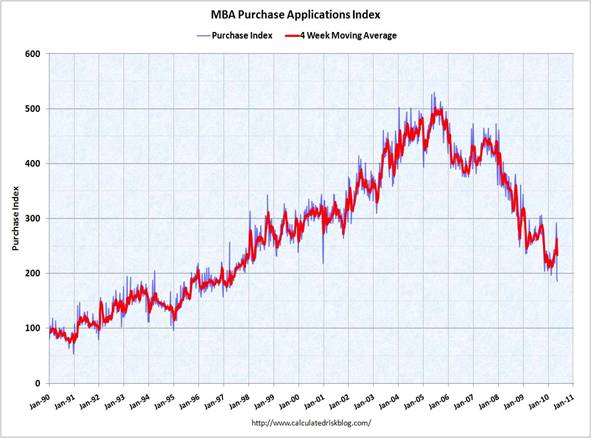
Meanwhile, we saw of brief surge in new mortgage applications in April to take advantage of the $8000 first-time homebuyer's tax credit before it expired. Over the past few weeks, mortgage applications for purchase have plunged to a 13-year low (thanks to Calculated Risk for the graphic).
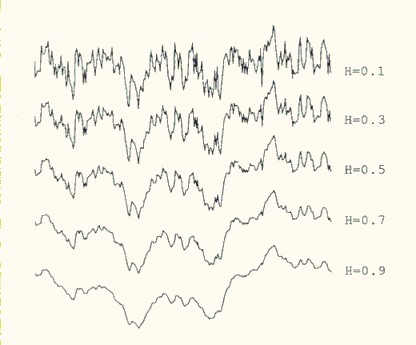
Still, mortgage losses are based on actual delinquencies and losses taken in foreclosure, not on seasonally adjusted data, however bad. For that reason, we will be most attentive to the actual delinquency and foreclosure data that will be reported in the coming months. There is an enormous inventory of delinquent but unforeclosed homes in the system, as well as unsold foreclosure inventory (amounting to an overall total that is about twice the entire number of homes that that have completed foreclosure since 2007). The underlying mortgages are not performing, and the inventory will ultimately come onto the market, which may put even more existing mortgages underwater. Of course, investors hope to ignore the solvency problem to some extent, since the FASB has obscured accounting rules to allow Madoff-like disclosure. Even if the latest proposal by the FASB to restore mark-to-market survives the outcry of the banking industry, it would not be implemented until 2013. Why should we care if banks actually are solvent as long as they tell us they are solvent? This is an open question, but only if one can be certain there is a greater fool available. We prefer not to make that assumption. For our part, the negative shift in market action suggests that we should be wary of complacency. As for general credit concerns, Greek debt is a relatively small aspect of the difficulty that can be expected. Still, it would be helpful for European leaders to focus on ways in which Greece and some of the less fiscally stable Euro-area members can be gracefully exited from the currency union, because ultimately, their deficits will be difficult to address through austerity. As I've noted before, these austerity plans can be expected to reduce government spending, but they will also produce a substantial loss of revenue because of the resulting economic weakness, leading to much less deficit reduction than expected. Politically, it is unlikely that Germany and stronger Euro-area countries will agree to indefinitely finance the deficits of these countries while they are already running deficits of their own. So the end game in Europe will very likely be a departure of Greece, Portugal, and possibly Spain from the Euro. I would expect that this will ultimately strengthen the euro, because remember, the outstanding currency is backed by the sovereign debt of European member states. The main thing that will assault the value of the Euro is if the ECB goes through with its plan to debase its balance sheet by loading it up with the insolvent debt of Greece and weaker members. The clearest path to a strong euro is to restructure, not defend, the insolvent debt of those countries. Needless to say, a similar point holds true for insolvent liabilities in the U.S., which the Fed should not be holding. I am not convinced that the Fannie Mae and Freddie Mac debt held by the Fed can be assumed to be backed by the full faith and credit of the U.S. government. It is true that the Treasury announced last Christmas eve that it would provide unlimited amounts to make Fannie and Freddie debt whole for a three-year period, citing the Housing and Economic Recovery Act of 2008 as its authority to do so. However, that law (in all caps, mind you) places a clear limit of $300 billion on the total amount of principal that the Treasury has the authority to insure. So either the Treasury's action exploited a loophole that was clearly no part of Congressional intent, or the open-ended commitment is lip service that actually has a statutory limit of $300 billion of principal (not losses, but principal). The third possibility, of course, is that the Treasury's action was illegal. In any event, as the Fed has purchased debt that does not, in fact, have the explicit long-term backing of the Federal government, it follows that it has created U.S. dollar liabilities in return for assets that are subject to loss and are not actually debt obligations of the Federal government. This in turn means that the Federal Reserve is engaging in unlegislated fiscal policy. I am also not at all convinced that the recent financial regulation bill passed by Congress contains the one essential provision that will be required to avoid a full replay of the credit crisis we saw in 2008. That provision is to endow a regulator - one with an explicit mandate of consumer and depositor protection - with the ability to take receivership of insolvent financial institutions, to cut away the operating entity from the bondholder and stockholder liabilities, sell it to an acquirer or re-issue it to the market as a whole recapitalized entity, and give the residual to the bondholders as partial recovery. This is how the FDIC deals with failed banks, and the threat of this should create a credible incentive for bank bondholders to restructure those obligations in a way that makes those investors, not the public, responsible for the losses that banks incur. The only reason that bank "failures" in the Depression (and the "failure" of Lehman) were problematic is that the institutions had to be liquidated in a disorganized, piecemeal fashion, because there was no receivership and resolution authority that could cut away the operating entity and sell it as a "whole bank" entity ex-bondholder and -stockholder liabilities. I put "failure" in quotations because there is a tendency to think of such events as something to be avoided even at the cost of public funds. Failure only means that bondholders don't get 100 cents on the dollar. As I've repeatedly emphasized (and don't believe can be emphasized enough), it is essential to invoke the word "restructuring" wherever possible, because it immediately leads us to seek constructive solutions between borrowers and lenders, without public expenditure. In my view, the regulator with resolution authority should not be the Federal Reserve. It is often argued that the Fed's involvement would insulate bailouts from political influence. But it is important to recognize that the Federal Reserve acts not in the interest of the public, but in the interest of the banking system itself, because it is an arm of the banking system, with leadership staffed by representatives from the banking system. Indeed, J.P. Morgan's CEO, Jamie Dimon was on the Board of Directors of the New York Federal Reserve at the same time that J.P. Morgan was awarded a sweetheart deal to acquire Bear Stearns, while the Fed itself took on tens of billions of "Maiden Lane" liabilities to facilitate the transaction. Moreover, if bailouts are to be effected, what could possibly be more deserving of political deliberation and subject to the oversight of elected representatives than the use of public funds? The resolution authority should have clear transparency. My vote would be the FDIC, but in any event, an agency with a mandate of public protection, and answerable to our elected representatives, is essential. Narrow bells and high micro-volatility Last week, I noted that on the heels of a vertical (and almost textbook) "air pocket" that followed the overvalued, overbought, overbullish, rising yields syndrome of recent months, we had observed another "Aunt Minnie" characterized by a breakdown in market internals. Most notably, we saw a leadership reversal which took weekly new lows above weekly new highs on the NYSE for the first time in three quarters. Coupled with other elements of that Aunt Minnie, we can count 19 such breakdowns since the 1960's, only 4 of which had benign outcomes, and the others being associated with a typical (additional) loss of about 7% within the next 12 weeks, expanding to an average loss of about 20% within the following year, as measured from the point the leadership reversal was observed. Given this relatively narrow set of outcomes, coupled with my ongoing concern about further credit strains (not simply abroad, but also becoming aggravated in the U.S.), there seems to be little reason to depart from last November's comment in Reckless Myopia: "In my estimation, there is still close to an 80% probability (Bayes' Rule) that a second market plunge and economic downturn will unfold during the coming year. This is not certainty, but the evidence that we've observed in the equity market, labor market, and credit markets to-date is simply much more consistent with the recent advance being a component of a more drawn-out and painful deleveraging cycle." As long-term readers of these comments know, I try to refrain from talking about the markets in terms of specific "forecasts." Instead, we tend to use the phrase "on average." The only time you can make a reasonable "point forecast" about the market is when all of the historical outcomes have a very narrow range of variation around them. That's rarely the case. Even the most favorable and unfavorable Market Climates we identify generally look (more or less) like bell curves, and all of them include both positive and negative returns. So the data generally don't support specific forecasts that the market will do this or that. The best you can usually do is to compare the average expected return with the range of possible risk. For example, a set of market conditions that is associated with a high average return, but a huge bell curve of dispersion around it (as we sometimes see in the gold market) tends to warrant only a moderate investment exposure, unless one is willing accept a great deal of volatility and risk. In contrast, a set of market conditions that is associated with a moderately high return, but a narrow bell of dispersion, can be approached with a more aggressive investment exposure. The reason that "Aunt Minnies" are notable is because they do have relatively narrow bells, so we can't simply ignore their implications. For that reason, I continue to urge that investors carefully consider their risk exposures here. If you follow a specific investment discipline, even if it is a consistent buy-and-hold approach, please ignore my views and stick to your discipline. But if you are carrying a lot of market exposure basically because the market has been going up over the past few quarters, and you are close enough to needing the funds that a substantial loss would materially affect your future plans, then your risk exposure is inappropriate, and it might be a good idea to make adjustments while we're still only a moderate distance from recent highs. Finally, as I've noted before, I tend to get particularly concerned when the market begins to exhibit extremely large fluctuations at ten-minute intervals. This sort of increasing "micro-volatility" is troublesome, particularly when in the context of a leadership reversal coming off of overvalued, overbought, overbullish extremes. The last time we observed similar internal dispersion coupled with a leadership reversal was at the 2007 market peak. As I noted in the July, 30 2007 comment (Market Internals Go Negative), "This is much like what happens when a substance goes through a "phase transition," for example, from a gas to a liquid or vice versa. Portions of the material begin to act distinctly, as if the particles are choosing between the two phases, and as the transition approaches its "critical point," you start to observe larger clusters as one phase takes precedence and the particles that have "made a choice" affect their neighbors. You also observe fast oscillations between order and disorder in the remaining particles. So a phase transition features internal dispersion followed by leadership reversal. My impression is that this analogy also extends to the market's tendency to experience increasing volatility at 5-10 minute intervals prior to major declines." The following chart (from Dietmar Saupe in Barnsley, the Science of Fractal Images) offers a nice illustration of how the same general pattern can feature different levels of what we can call "micro-volatility." The top panels look like what we're starting to see in intraday activity.
Suffice it to say that at present, the conditional expected return distribution for stocks is hostile enough for me to repeatedly urge investors to examine their risks. Please, ignore my views if you're following a clear and disciplined investment strategy, but be certain that you can tolerate risk - especially with funds that will be required over a relatively short horizon. Market Climate As of last week, the Market Climate for stocks was characterized by unfavorable valuations, and unfavorable market action, with a leadership reversal coming just off of an overvalued, overbought, overbullish syndrome, and accompanied with heavy downside breadth. This type of event has produced fairly benign outcomes about 20% of the time. The remaining instances have been hostile, on average, and in the majority of cases were observed at the beginning of steep market declines. It is difficult to review that record with equanimity about what may occur in the present instance, but again, about 20% of those outcomes were fairly benign. I think it is sufficient to strongly urge investors to review their risk exposures here (and to be comfortable that a significant market loss would not derail their financial security or short-horizon spending needs). Again, I do not encourage investors to deviate from careful and disciplined investment strategies, or to establish "bearish" positions. For our part, the Strategic Growth Fund is fully hedged. The primary source of day-to-day fluctuations in the Fund here is the difference in performance between the stocks held by the Fund and the indices (S&P 500, Russell 2000, Nasdaq 100) that we use to hedge. In bonds, the Market Climate last week was characterized by moderately unfavorable yield levels and favorable yield pressures. Credit spreads continued to widen last week, so despite periodic selloffs in Treasuries on various "relief" news (such as the nearly obligatory assurance from China that it had no plans to dispense of euro-denominated debt), I continue to expect Treasury securities to act as preferred safe-havens in response to fresh credit strains. Though these strains are likely to suppress inflation pressures over the shorter run, the reckless fiscal and monetary attempt to make bad debt whole, rather than encouraging its restructuring, has very unfavorable long-term implications for the purchasing power of the U.S. dollar. I still believe that inflation pressure is likely to emerge in the second half of this decade, not over the near term. Still, precious metals shares tend to perform well in the face of downward real interest rate pressure and a high ratio of physical gold prices to the underlying stock prices. In view of that combination, the Strategic Total Return Fund continues to accumulate precious metals shares on short term weakness, and we are comfortable with gradually building a moderate (5-10%) exposure. We can't rule out a spell of downward commodity price pressure if concerns emerge about potential economic weakness, so we're not seeking anything close to an aggressive exposure here, but our current position will give us adequate participation even if economic weakness doesn't offer us another bite at the apple, so to speak. * Geek's Note: the actual calculation is P(S'|S) = P(S'|F)P(F|S)+P(S'|~F)P(~F|S) --- The foregoing comments represent the general investment analysis and economic views of the Advisor, and are provided solely for the purpose of information, instruction and discourse. Prospectuses for the Hussman Strategic Growth Fund, the Hussman Strategic Total Return Fund, the Hussman Strategic International Fund, and the Hussman Strategic Dividend Value Fund, as well as Fund reports and other information, are available by clicking "The Funds" menu button from any page of this website. |
|||||||||||||||||||||||||
|
For more information about investing in the Hussman Funds, please call us at
1-800-HUSSMAN (1-800-487-7626) 513-326-3551 outside the United States Site and site contents © copyright Hussman Funds. Brief quotations including attribution and a direct link to this site (www.hussmanfunds.com) are authorized. All other rights reserved and actively enforced. Extensive or unattributed reproduction of text or research findings are violations of copyright law. Site design by 1WebsiteDesigners. |