|
|
||||||
|
|

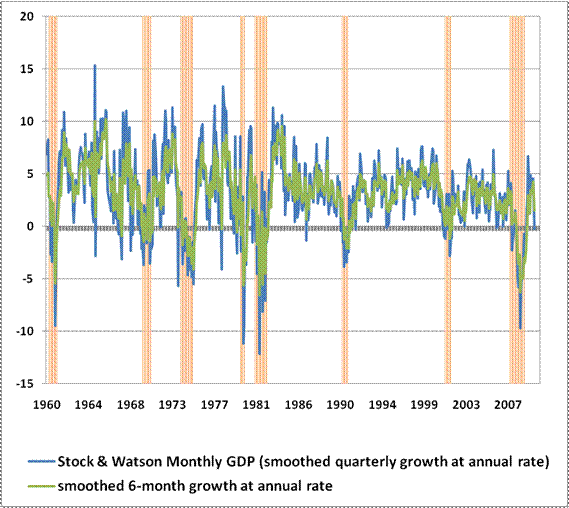
September 27, 2010 Not Yet Out of the Woods "CAMBRIDGE September 20, 2010 - The Business Cycle Dating Committee of the National Bureau of Economic Research met yesterday by conference call. At its meeting, the committee determined that a trough in business activity occurred in the U.S. economy in June 2009. The trough marks the end of the recession that began in December 2007 and the beginning of an expansion." NBER Business Cycle Dating Committee announcement Very often, announcements by the Business Cycle Dating Committee are met with a good deal of media criticism. In most cases, this is because the announcements tend to come long after a turn in the economy is considered to be common knowledge. On this point, it's important to recognize that the job of the Committee is not to predict or forecast the economy, but rather to set official dates for the beginning and end of U.S. recessions and expansion. In that sense, the Committee is an official arbiter of U.S. economic history. In the present instance, the announcement that the recession ended in June 2009 has been criticized for an unusual reason - not because the announcement is so late that an expansion is already considered to be common knowledge, but rather because, to most Americans, it is not at all clear that the economy is in an expansion at all. On that front, it is important to recognize that the Committee took pains to make it clear that it was not forecasting the future or suggesting that economic progress has even been very good: "In determining that a trough occurred in June 2009, the committee did not conclude that economic conditions since that month have been favorable or that the economy has returned to operating at normal capacity. Rather, the committee determined only that the recession ended and a recovery began in that month. The committee decided that any future downturn of the economy would be a new recession and not a continuation of the recession that began in December 2007." Monthly measures of GDP show deteriorating economic momentum In its release, the Committee noted that it "places particular emphasis on measures that refer to the total economy rather than to particular sectors." These include "a measure of monthly GDP that has been developed by the private forecasting firm Macroeconomic Advisers," and "measures of monthly GDP and GDI that have been developed by two members of the committee in independent research (James Stock and Mark Watson)." The Committee generously provides downloadable data on these measures, which make for fascinating research. In particular, a review of that data suggests that the NBER may have to deal with the prospect of a "future downturn of the economy" much sooner than any of us would like. Below, I've plotted the smoothed quarterly and 6-month growth rates of the Stock and Watson monthly GDP measure cited by the Committee, following the method of Zarnowitz and Moore (see last week's update). The data is through June 2010. Note that the plunge in the smoothed growth rates occurred because even though GDP growth was positive for the second quarter, there was a sharp downturn in the monthly figures, which a variety of indicators also picked up (such as the ECRI Weekly Leading Index), and has unfortunately continued into the present quarter.
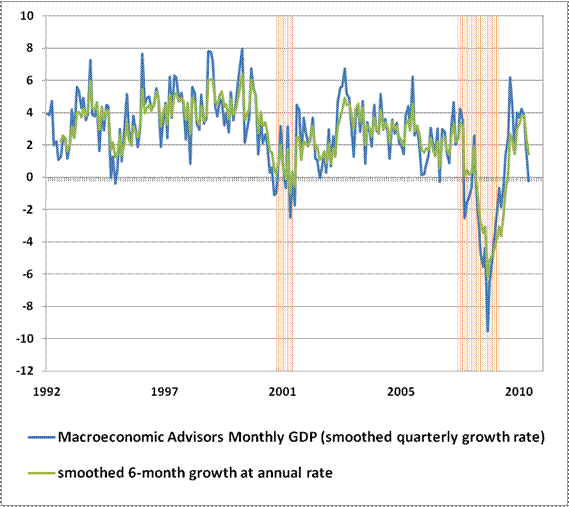
Though the Stock and Watson data has a longer history, the same downturn can be observed in the Macroeconomic Advisors data
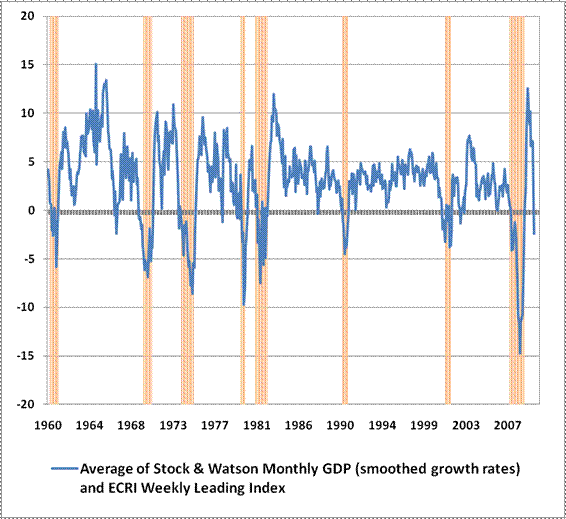
Below, I've combined the long-term Stock and Watson data with the ECRI Weekly Leading Index growth rate to give a picture of how fluctuations in these measures have correlated with past recessions (shaded orange) identified by the NBER. Given the upward spike in growth that we observed in mid-2009, the choice of a June 2009 turning point is consistent with historical precedent. The Committee typically dates the beginning of a recovery at the point where the growth rates of underlying measures of economic growth clearly spike from negative to positive. What is of immediate concern though, is the trajectory that growth rates have taken since then.
Again, the graph presented here is as of June 30, 2010. While we know the ECRI data has deteriorated further since June, we won't have GDP figures for a while yet. Given the data in hand, it's clear that past growth downturns of the same extent have often gone on to become recessions. However, there are a few exceptions where these growth rates dipped below zero and then recovered. If we had good reason to expect positive economic tailwinds, we would be less concerned about the present deterioration. Unfortunately, my impression is that the bulk of the growth that we did observe coming off of the June 2009 economic low was driven by a burst of stimulus spending coupled with a variety of programs to pull economic activity forward. My concern is that these synthetic factors are now trailing off, with little intrinsic economic activity to carry a recovery forward. Suffice it to say that we're not yet out of the woods. Employment growth versus GDP growth One clue about possible GDP growth can be obtained by looking at employment growth, since the two are clearly related.
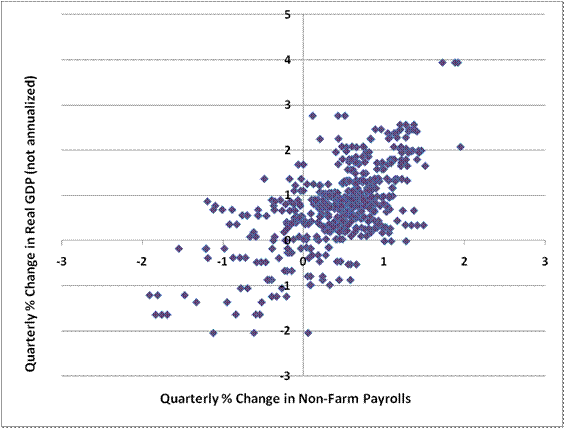
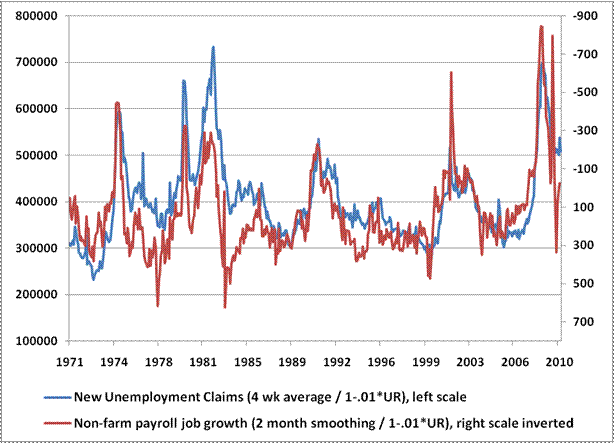
On a quarterly (non-annualized) basis, the average quarterly change in non-farm payrolls since 1960 has been about 0.4% (standard deviation +/- 0.6), while the average quarterly change in real GDP has been about 0.8% (standard deviation +/- 0.9). As of the August employment report, non-farm payroll growth over the past 3 months has been about -0.2%, or about 1 standard deviation below the norm. This would correlate to a quarterly GDP loss of about -0.4%, or roughly -1.6% on an annualized basis. Of course, part of that employment loss was during June, so if we get 100,000 new jobs in the September employment report, the quarterly change will also be roughly flat, making it a coin flip as to whether third-quarter GDP was positive or negative. Unfortunately, the high rate of new claims for unemployment suggests continued pressure on the job market. The 4-week average of new claims is presently at 459,500 weekly, which already would be associated with payroll job losses. But it is important to recognize that these job losses are on an already depressed labor force. To put the figures on an equal footing with historical data, one can place the data in the context of a fully employed labor force, by dividing by (1-.01 x unemployment rate). Admittedly, the current data would be even worse if we fully adjusted by using the U6 unemployment rate, which includes discouraged workers, but using the overall employment rate is sufficient to improve the statistical usefulness of the new claims data. The chart below presents the historical relationship between the adjusted weekly new claims data and adjusted monthly non-farm payroll job growth. Note that the present rate of new claims would typically be consistent with roughly 250,000 monthly job losses on an adjusted basis, which works out to about 226,000 job losses given the present rate of unemployment. Fortunately, there have been other instances where job losses were thankfully much less than what would have been implied by the new claims data, but it is clear that the persistently high level of weekly new unemployment claims is inconsistent with the expectation of robust payroll gains.
Frankly, I am hoping that we are wrong on this. Our investment strategy is a long term one. We don't rely on being "right" about individual instances. Rather, we focus on average outcomes, taking greater exposure to risk in conditions that have historically been associated with favorable returns and taking less risk in conditions that have historically been associated with weak returns - on average. The present overall return-to-risk profile is not favorable, on average. But again, despite our present defensive position, we would prefer - hands down - to be wrong about oncoming economic weakness. In our view the market is already fully priced for an economic recovery anyway, so the challenges are steep for investors even without a further downturn. As I've noted before, risk management is forgiving. During the past decade of rich valuations, and based on our analysis, throughout history, the temporary returns that investors have missed during periods of hostile valuations and overbought conditions have been more than compensated by the avoidance of subsequent - often profound - losses that correct those valuations. But this is a long term, average tendency. We aren't market timers - we are risk managers. For now, conditions continue to stack on the defensive side. Market Climate Presently, our valuations measures suggest clear overvaluation (our estimated 10-year total return for the S&P 500, based on a variety of models including the operating earnings model presented a few weeks ago, is only about 5%-5.4% annually), market action is strenuously overbought, market internals are relatively positive, but economic pressures are still negative, and sentiment is once again bullish enough to define an "overvalued, overbought, overbullish" condition. The Strategic Growth Fund is fully hedged at present, and currently has a "staggered strike" position, where our put option strikes are raised closer to the level of the market (at a cost of just over 1% of assets) to provide tighter downside defense. On Friday's advance, our stocks did not participate as much as we would have liked (coming off of a very good relative performance on Thursday), so the Fund pulled back a fraction of a percent. Aside from the additional impact of that higher-strike put option coverage, the day-to-day fluctuations in the Fund when we are hedged are primarily driven by the difference in performance between the stocks we hold long and the indices we use to hedge. The Strategic International Fund is also over 90% hedged, with the precise figure varying modestly from day-to-day as we execute new stock purchases and associated hedges. Suffice it to say that both Funds are defensive here. As a sidenote in reponse to a few questions last week, since our precise hedge level may vary from day-to-day and week-to-week, I may describe our hedge position with words such as "fully," "largely," "tightly," "nearly fully" and so forth, which really convey little distinction. At the point where it becomes appropriate to remove large portions of our hedges, I will be very clear about our change in position and the rationale for that change. I don't anticipate such major hedging changes until we observe a clear shift in some combination of valuation, overbought conditions, or economic pressures. In bonds, the Market Climate continues to be characterized by moderately unfavorable yield levels and favorable (i.e. downward) yield pressures. The Federal Reserve continues to telegraph a willingness to engage in further quantitative easing, which suggests the prospect of further Treasury purchases in the event of economic weakness. We're observing clear pressure on the U.S. dollar in response to suggestions about QE, which is as expected. The Strategic Total Return Fund currently has a duration of just over 4 years, primarily in straight Treasury notes, about 10% of assets in precious metals shares, about 5% of assets in foreign currencies (primarily Japanese yen, Swiss franc, and British pound), and about 2% of assets in utility shares. --- The foregoing comments represent the general investment analysis and economic views of the Advisor, and are provided solely for the purpose of information, instruction and discourse. Prospectuses for the Hussman Strategic Growth Fund, the Hussman Strategic Total Return Fund, the Hussman Strategic International Fund, and the Hussman Strategic Dividend Value Fund, as well as Fund reports and other information, are available by clicking "The Funds" menu button from any page of this website. |
|||||||||||||||||||||||||
|
For more information about investing in the Hussman Funds, please call us at
1-800-HUSSMAN (1-800-487-7626) 513-326-3551 outside the United States Site and site contents © copyright Hussman Funds. Brief quotations including attribution and a direct link to this site (www.hussmanfunds.com) are authorized. All other rights reserved and actively enforced. Extensive or unattributed reproduction of text or research findings are violations of copyright law. Site design by 1WebsiteDesigners. |