|
|
||||||
|
|

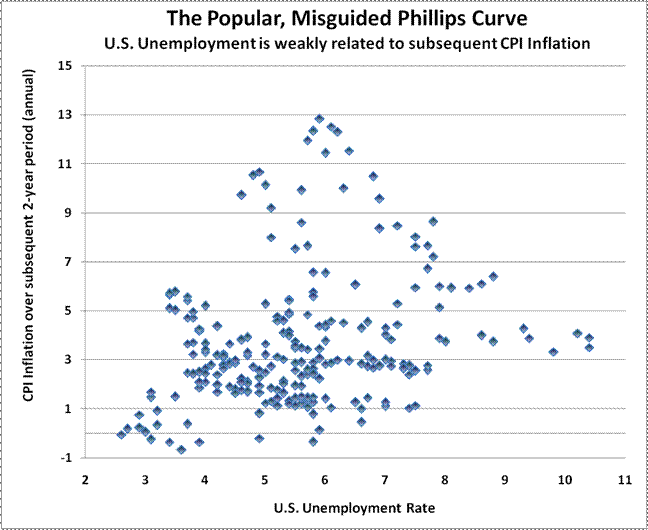
April 4, 2011 Will the Real Phillips Curve Please Stand Up? Much of the intellectual basis for the Federal Reserve's dual mandate - "to promote effectively the goals of maximum employment, stable prices, and moderate long-term interest rates" - is based on the belief in what economists call the Phillips Curve. The Phillips curve, named after economist A.W. Phillips, is widely understood as a "tradeoff" between inflation and unemployment. The idea is so engrained in the minds of economists and financial analysts that it is taken as obvious, incontrovertible fact. High unemployment, the argument goes, is associated with low inflation risk, and in that environment, policy makers can safely pursue measures targeted at increasing employment, without undesirable consequences for inflation. You can see this blind acceptance of Phillips Curve thinking in Ben Bernanke's go-out-and-speculate Op-Ed in defense of quantitative easing, which appeared in the Washington Post late last year: "The Federal Reserve's objectives - its dual mandate, set by Congress - are to promote a high level of employment and low, stable inflation... low and falling inflation indicate that the economy has considerable spare capacity, implying that there is scope for monetary policy to support further gains in employment without risking economic overheating. The FOMC decided this week that, with unemployment high and inflation very low, further support to the economy is needed." In prior weekly comments, we've reviewed the weakness in Bernanke's argument that stock market fluctuations influence GDP, noting that every 1% change in market value is associated with a short-lived change of only 0.03-0.05% in real GDP. That result is strongly rooted in economic theory, since consumption and wealth effects are based on assets that are viewed to be "permanent," not on fluctuations in assets that are known to be volatile. Similarly, Bernanke's belief in the Phillips Curve is equally devoid of factual substance, despite its broad acceptance and simplistic appeal. The chart below shows the historical record, since 1947, plotting the U.S. unemployment rate against the subsequent rate of CPI inflation over the following 2-year period. The correlation is essentially zero (techically, it's slightly positive, implying no "tradeoff" at all in historical data). I should also note that the same lack of correlation holds between unemployment and inflation measured over the previous 1-2 year period.
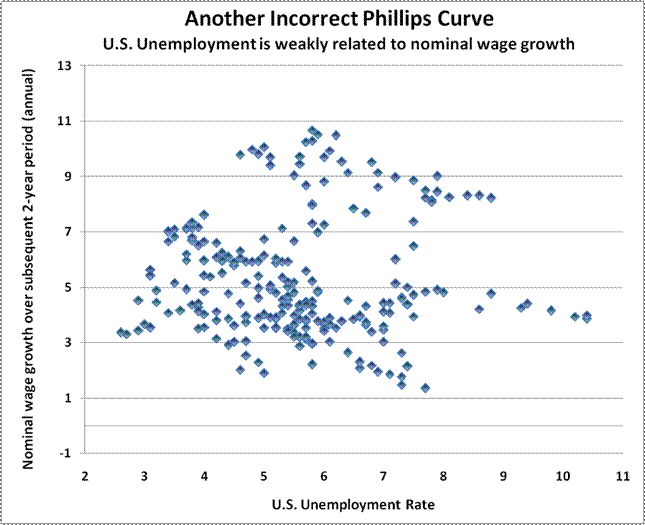
As it happens, economists have been well aware of this lack of correlation for decades, but because of the simple intellectual appeal of an inflation-unemployment tradeoff, they have gone to great lengths to try to make the relationship work. The most prominent version of this is the "expectations augmented" Phillips Curve, which looks at the graph above as a whole set of "nested" Phillips Curves (like indifference curves in consumer theory), where each curve is set at a different level based on the level of expected inflation. In this view, unexpected inflation moves you along a given Phillips Curve, while expected inflation shifts you to a different curve. While this version of the theory is popular among economists because it gives them a modeling "environment" in which to teach the importance of expectations and so forth, the fact remains even the expectations-augmented version has only a weak relationship to actual economic data. In effect, the most basic intellectual underpinning of the Fed's "dual mandate" is Grade-A horse manure. How can that be? Didn't A.W. Phillips demonstrate the inflation-unemployment tradeoff in historical data, giving rise to the famous curve that bears his name? Well, actually, no. See, the Phillips Curve takes its name from a 1958 Economica paper by A.W. Phillips, which studied the relationship between unemployment and wage inflation in Britain, using a century of historical data through the 1950's. What Phillips found was this: when unemployment was low, wage inflation tended to be above-average, and when unemployment was high, wage inflation tended to be subdued. Yet even this relationship, when viewed in U.S. data since 1947, doesn't seem to hold up very well. In fact, U.S. unemployment is just as weakly related to nominal wages as it is with overall price inflation.
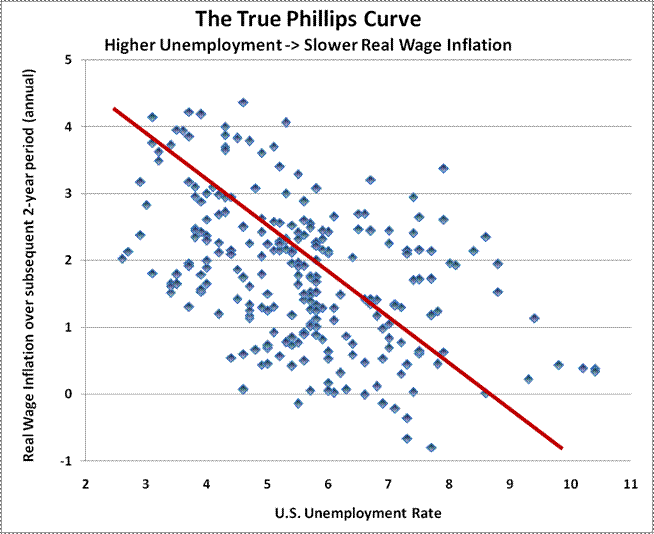
We can get to the heart of the Phillips Curve by asking one crucial question: What is the difference between Britain in the period from 1861-1957, and the United States in the post-war period? The answer is simple. During most of the period that Phillips studied, Britain was on the gold standard. As a result, the general price level was actually very stable, with very little general price inflation at all. In fact, Phillips excluded data "in or immediately after those years in which there was a very rapid rise in import prices." So when Phillips observed wage inflation, he was actually observing real wage inflation as well. When unemployment was low and available labor was scarce, workers were able to command a greater amount of real goods and services in return for their work. In contrast, when unemployment was high and available labor was plentiful, workers found that their standard of living typically did not rise quickly because their services were not in sufficient demand. Phillips demonstrated a principle that is well-known to every economist: very simply, when a useful resource becomes scarce, its price tends to increase relative to the prices of other goods and services. That finding doesn't need all sorts of intellectual contortions or modeling tricks to make it "work," because it is one of the most basic laws of economics. The true Phillips Curve, then, is a relationship between unemployment and real wages. When workers are scarce, wages tend to rise faster than the general price level. When workers are plentiful, wages tend to rise slower than the general price level. If we look at U.S. data in this way, we find precisely what A.W. Phillips found in British data. The following chart plots the U.S. unemployment rate versus the annual inflation in real wages (average hourly earnings deflated by the GDP price deflator) over the subsequent 2-year period.
The importance of the true Phillips Curve should not be underestimated. First, there is in fact no strong "tradeoff" between unemployment and general price inflation, and almost certainly not an exploitable one. The Phillips Curve is essentially a statement that lower unemployment is associated with higher inflation in real wages. The strategy of accepting higher inflation in hopes of achieving lower unemployment (which is the basis of Bernanke's policy efforts) not only drops the phrase "real wages" but reverses the direction of cause and effect. The other important implication of this analysis is that real wages for U.S. workers are likely to stagnate for a prolonged period of time. As a side note, lest the prospect of further suffering among workers suggests that corporate profits and stock market returns will be correspondingly higher at their expense, I should note that there is virtually no correlation between real wage growth and total returns in the S&P 500. Weak employment conditions are a universal bad. That said, however, the belief that the Federal Reserve can offset this by encouraging higher inflation is a dangerous and misguided dogma, which simply adds insult to injury to people at lower income levels who spend a large proportion of their income on food and energy. What the nation needs urgently is for the Fed to abandon its endless policy of distorting asset prices. This policy has the effect of reducing prospective future investment returns, damaging the incentive to save, and misallocating resources, all while increasing systemic risk and moral hazard - defending excessive risk-taking against losses over the short-run while leaving the nation vulnerable to the damaging consequences of that risk-taking over the long run. I've long argued that the Fed has an essential function in providing liquidity during periods of banking crisis, but I have been dismayed by the extent to which the Fed has breached the restrictions of the Federal Reserve Act in recent years, as well as by the increasingly distortive policies it has pursued. Market veteran Ned Davis puts it nicely "I think the Fed has punished savers and has put us between a rock and a hard place with QE2. It has kept the banking system liquid and helped goose stocks. But in that it has also provided juice for a commodity explosion that has hurt the world's poor, it has offset much, if not all, the good it did. In that real money (ex inflation) matters, the situation is not nearly as favorable as most Fed watchers believe." Similarly, Vitaliy Katsenelson related a recent speech by the Fed's Thomas Hoenig at the Colorado CFA Society - "He said these policies encourage speculation and don't allow for price discovery, and consequently they lead to imbalances, unintended consequences, and misallocation of resources. He said it is important to judge QE2's success over the right time frame, one long enough to encompass not just its stimulative benefits but also its consequences." Hoenig argued that the Fed's intervention will have unintended consequences, and offered as an example the Fed's actions of 2003, the resulting asset bubble, and the subsequent financial crisis that resulted. Vitaliy observed "I too believe that the Fed's actions in 2003 played a very large role in the subsequent real estate bubble, financial crisis, and today's high unemployment, but this was the first time I've heard such an admission come directly from a Fed governor." With respect to the Bernanke's actions, Vitaliy quoted the 19th century economist Frederic Bastiat: "There is only one difference between a bad economist and a good one: the bad economist confines himself to the visible effect; the good economist takes into account both the effect that can be seen and those effects that must be foreseen... the bad economist pursues a small present good that will be followed by a great evil to come, while the good economist pursues a great good to come, at the risk of a small present evil." Market Climate As of last week, the Market Climate for stocks remained characterized by a syndrome of overvalued, overbought, overbullish, rising-yields conditions that has historically been associated with a negative return/risk profile, on average. That is not a statement about where the market is headed over the next week, or even the next month or two, but on average, this syndrome has been resolved by abrupt declines that leave no net gains for the period during which it has been in effect. So even if the market advances further (which is more difficult when it is pressing against daily, weekly and monthly trading bands as it is at present), the likelihood of durable gains is fairly weak. Still, it is quite possible that we could clear the present condition in the next few weeks, most likely by a decline sufficient to reduce bullish sentiment or to reduce the extent of present overbought conditions. Provided such a decline doesn't involve significant damage to market internals (which would signal a potentially more robust shift toward investor risk aversion), we would expect to establish a moderately constructive position in response, though most probably with a continued "line" of index put option defense to protect against more extended downside risk. Strategic Growth and Strategic International Equity remain well-hedged at present. The latest employment report was in line with what I've called the "mean-reversion benchmark," which would imply sustained job creation averaging about 200,000 jobs monthly in order to gradually recover toward "potential" GDP over a 4-year period. The problem remains that we are likely to observe periodic shocks to this benchmark. This includes not only various debt problems among peripheral Euro-zone countries and U.S. state and local governments (none of which can print their own currencies in order to finance expenditures), but also the likelihood of hundreds of thousands of job losses at the state and local level sometime about mid-year. You don't hear much of this from Wall Street (which is still whistling past the graveyard), but if you spend your time with non-profits, educators, and people in government, the concern about these impending cuts is extremely high. It's interesting that various financial anchors are still taking pot-shots at Meredith Whitney given that we have not observed much in the way of municipal defaults. But these criticisms fail to recognize the time-line. Even the pink slips going out now from many state governments won't actually translate into job losses until various stimulus efforts expire and hit a "cliff" - as many non-profits and local government leaders call it - in June or July. Importantly, our present investment position is not driven by broader macroeconomic concerns, but by the hostile syndrome of market conditions we presently observe. Again, those conditions could be cleared within weeks, so I don't want to imply that these considerations preclude our exposure to market fluctuations, provided we clear that syndrome without a larger breakdown in market internals. In bonds, the Market Climate remained characterized by relatively neutral yield levels and yield pressures. Strategic Total Return continues to carry a duration of just over 4-years in bonds, presently with about 8% of assets in precious metals shares. We currently estimate that the S&P 500 Index is priced to achieve total returns averaging about 3.4% annually over the coming decade, based on our standard methodology (see prior weekly comments for the historical record). That's roughly the same as the yield on a 10-year Treasury. Technically, that suggests that per unit of risk, Treasuries may actually be the better investment class, but frankly, my impression is that the overall profile of prospective returns in the financial markets is unfavorable in just about everything but high-quality, stable growth, wide-moat large caps. I expect that we'll see much better expected return opportunities within the next couple of years. But notice what that means. If a 10-year bond purchased today will be priced to achieve a 4.5% yield to maturity say, 2 years from today, it would achieve a total return of about zero in the interim because the price decline would wipe out the interest earnings. Similarly, in order for stocks to be priced to achieve still sub-par 10-year returns of about 4.5% a couple of years from today, the S&P 500 would achieve flat total returns in the interim, even assuming normal earnings growth and dividend income. As I've noted before, the essential function of QE2 has been to drive asset prices up to the point where all of them have prospective returns very close to the zero returns that are available on non-interest bearing cash. --- The foregoing comments represent the general investment analysis and economic views of the Advisor, and are provided solely for the purpose of information, instruction and discourse. Prospectuses for the Hussman Strategic Growth Fund, the Hussman Strategic Total Return Fund, the Hussman Strategic International Fund, and the Hussman Strategic Dividend Value Fund, as well as Fund reports and other information, are available by clicking "The Funds" menu button from any page of this website. |
|||||||||||||||||||||||||
|
For more information about investing in the Hussman Funds, please call us at
1-800-HUSSMAN (1-800-487-7626) 513-326-3551 outside the United States Site and site contents © copyright Hussman Funds. Brief quotations including attribution and a direct link to this site (www.hussmanfunds.com) are authorized. All other rights reserved and actively enforced. Extensive or unattributed reproduction of text or research findings are violations of copyright law. Site design by 1WebsiteDesigners. |