|
|
||||||
|
|

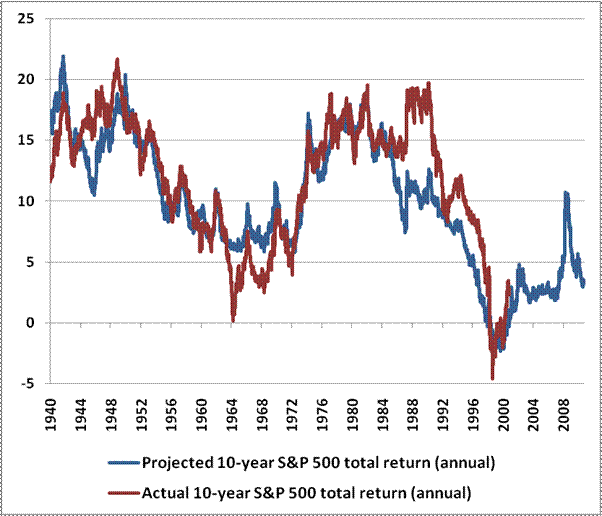
May 16, 2011 Hanging Around, Hoping to Get Lucky The stock market continues to be strenuously overvalued here, with a variety of historically reliable methods indicating probable total returns for the S&P 500 of only about 3.5% over the coming decade. This does not necessarily imply much about near-term market returns, though the continuing syndrome of overvalued, overbought, overbullish, rising-yield conditions does contribute to near-term risk. That said, we had some good opportunities to modify our hedges in recent weeks to allow for a broader range of possible outcomes. As the market rose to its recent highs, triggering an unusually extended set of conditions (see Extreme Conditions and Typical Outcomes ) we raised our index put strikes close to at-the-money levels. The recent decline placed those options in-the-money. That in turn gave us the opportunity to cover about one-third of our short call options while still keeping a good line of protection in place. In short, we are well hedged against the potential for significant market losses, but with the implied volatility on index options fairly low, we've used shorter-term market fluctuations to modify our hedges in a way that better allows for any extension of the market's advance. With respect to the market's valuation, there is a phrase in the first paragraph that is particularly important - "historically reliable methods." This, for us, is a critical requirement for investors, because there are dozens of garbage models that purport to measure stock market valuation, but have little (and sometimes zero or negative) correlation with subsequent market performance. Long-term shareholders have seen enough discussion of "Fed Model" weaknesses in this regard (see any number of weekly comments from around the 2007 market peak, when I was railing about the dangers of gulping down that particular flavor of Kool Aid). In contrast, I've often quoted the Shiller P/E (which essentially uses a 10-year average of inflation-adjusted earnings) as a simple but historically informative alternative, but I should emphasize that we strongly prefer our standard methodologies based on earnings, forward earnings, dividends and other fundamentals, all which have a fairly tight relationship with subsequent 7-10 year total returns (see Lessons from a Lost Decade , The Likely Range of Market Returns in the Coming Decade , Valuing the S&P 500 Using Forward Operating Earnings , and No Margin of Safety, No Room for Error ). Note that all of these models estimate 7-10 year prospective total returns for the S&P 500, rather than kicking out a "fair value" number. This is a subtle distinction, but it is important. We believe it is much more useful to investors to evaluate a menu of projected long-term returns that can be directly compared across stocks, Treasuries, corporate securities, and so forth (see The Menu ). In order to turn a projected return figure into a "fair value" number, you have to take the extra step of assuming, on behalf of investors, what level of long-term returns is "fair" - and this is one of the ways that the Fed Model invites absurdity. For example, if we choose to believe that long-term investors will be sustainably happy to achieve long-term returns of 3.5% annually over the coming decade, then it follows that the S&P 500 is fairly valued here. I view that as a terribly dangerous assumption. Still, we can't argue that stocks might be "fairly valued" for investors who see a very risky 3.5% expected long-term return as perfectly acceptable. At least they know what they're getting into.
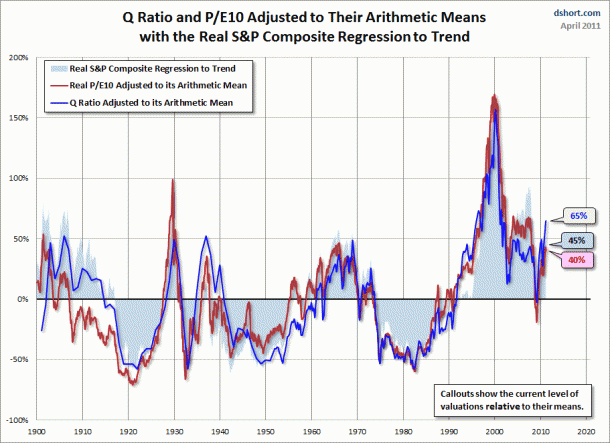
It's interesting that historically, a Shiller PE above 24 (where it is presently) is also associated with average subsequent 10-year total returns of 3.5% for the S&P 500 (see Anatomy of a Bubble ). To make a plausible case against these expectations, one can't simply trot out an expected forward operating earnings number, multiply it by an arbitrary forward multiple, and claim that stocks are reasonably valued. No - show your work. Analysts who claim that stocks are "cheap" when a market advance is mature and profit margins are elevated should be expected to demonstrate that their approach is historically reliable. Specifically, there should be long-term evidence (since at least the 1950's, to capture a substantial amount of variation) that their methodology provides highly predictive information about the subsequent performance of the stock market. Last week, the renowned value investor Jeremy Grantham threw his own hat into the defensive camp (see Grantham's quarterly letter ). In truth, he's been there for a while on the valuation front, but proved more nimble than us in conceding the influence of QE2 - "a kind of underlining of the seemingly eternal promise of a bailout should something go wrong, as if Noah had been sent not just one rainbow but two!" Grantham described his willingness to suspend some concerns about valuation as an "experiment in going with the flow," but added that this was personal, and " emphasized the caveat that more serious, risk-averse, long-term investors would not want to play fast and loose with a market then worth only 900 on the S&P. I also added that GMO played pretty strictly by the value book for our clients, shading only a little here and a little there." Grantham presently estimates fair value at "about 920 on the S&P 500," and warns "the environment has simply become too risky to justify prudent investors hanging around, hoping to get lucky." Now, since it is easy to show that the long-term peak-to-peak trend of S&P 500 earnings and other fundamentals has advanced at an annual growth rate of roughly 6% annually nearly as far back in history as you care to look, a 920 fair value today, coupled with a roughly 2% dividend yield and a current S&P 500 of 1340, works out to an implied total return over the coming decade of [(1.06)(920/1340)^(1/10) + .02 - 1 =] 4% annually. In my view, that's right in the ballpark. Of course, that 6% underlying peak-to-peak growth would still have to come from somewhere. Part of it, in my expectation, will come from real GDP growth that will be about a half percentage point faster than the 2.5% expected growth in "potential GDP," as I expect the current "output gap" to gradually close over the coming decade. The remainder is likely to come from inflation. But be careful - it is tempting to assume that if inflation comes in higher (as seems likely in the back half of the decade), the long-term return on stocks will also be commensurately higher, but that is the inflation-hedger's first mistake. While stocks have been a fine long-term inflation hedge, they tend to perform miserably (particularly in inflation-adjusted terms) during periods where inflation is rising - particularly if the rising inflation is unanticipated. It's only when inflation expectations are well recognized that stocks finally become priced to compensate accordingly, and of course, they typically do swimmingly when high expectations of inflation prove to be unfounded and inflation rates decline persistently, as we saw in the years following the 1982 market low. Grantham's valuation figure implies that the S&P 500 is just over 45% overvalued, by his measures. That's clearly in general agreement with our own metrics, and is also consistent with other historically reliable metrics such as the Q ratio. Doug Short provides a nice overview:
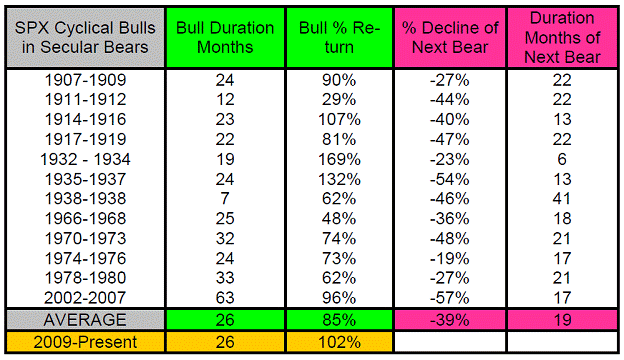
Grantham concedes that his increased willingness to "go with the flow" was born of a "long and ignoble history of being early on market calls," noting that GMO tends to "arrive at the winning post with good long-term results and less absolute volatility than most, but not necessarily the same clients that we started out with." That comment reminded me of a study by Dalbar, which showed that for the 20 years ended in 2008, the Dow Jones Total Stock Market Index averaged an annual total return of 8.3%, the average equity fund returned 7.3%, but the average fund investor only achieved a return of 1.9% annually because of the tendency to chase investments at their peaks and bail out during weak periods. As for us, we've certainly made our own adaptations to improve our ability to "go with the flow" with a greater frequency, even in markets that appear objectively overvalued from a long-term perspective. Still, whatever constructive opportunities there might have been in 2009 and early 2010 are now well behind us. We are close to the point where investors can ensure themselves maximum damage by shifting away from a defensive stance and buying the market, in hopes of reaching for return in an already richly valued and overextended advance. Even with our own "ignoble" miss during this cycle, Strategic Growth remains ahead of the S&P 500 since its 2007 peak, with substantially less volatility and drawdown. It's certainly not an overall performance that we think is "representative," particularly now having solved the infuriatingly difficult "two data sets problem" that we faced during the financial crisis. But recapturing a stronger lead will be a matter for the next cycle. Provided that our shareholders are long-term and fully understand our process, I have little concern about "growing" our number of shareholders, which is why we don't advertise, and why we regularly do "anti-marketing" to discourage short-term investments. Still, I feel an enormous amount of personal responsibility toward our existing shareholders, and honestly, my greatest worry is that the challenges we've had during the recent cycle will provoke any of them to capitulate and chase the market at these levels, possibly capturing some short-term gains, but ultimately doing damage to their financial security. At least going with another risk-managed approach would be preferable. Thankfully, we haven't seen much of either, and I'm continually grateful for your trust. Overall, we view the stock market as strenuously overvalued, with the likelihood of poor long-term returns in the area of about 3.5-4% over the coming decade. That's certainly better than the valuations we observed in 2000 (when the S&P 500, by our estimate, was priced to achieve negative 10-year returns). But unless one expects a reprise of that bubble, or at least a reprise of the sort of enthusiasm we saw during the housing bubble (when valuations ascended high enough to drive 10-year prospective returns below 3% annually), the odds of sustained durable gains from present levels are weak. Still, our estimate of 10-year return prospects says very little about the profile of returns that would get us there. For example, a series of market fluctuations -40%, +85%, -36% and +100% within a 10-year period would produce a 10-year return about 3.5% annually, so a poor long-term expectation doesn't rule out the likelihood of significant investment opportunities in the interim. The real difficulty at present is that at already elevated valuations, it's less likely that those opportunities will be front-loaded. As Howard Marks puts it, "participating when prices are high rather than shying away is the main source of risk. Whereas the theorist thinks return and risk are two separate things, albeit correlated, the value investor thinks of high risk and low prospective return as nothing but two sides of the same coin, both stemming primarily from high prices. Risk arises when markets go so high that prices imply losses rather than the potential rewards they should. Dealing with this risk starts with recognizing it." Notes on Cyclical and Secular Markets Historically, the "typical" market cycle has averaged about 5 years: about 3.75 years of advance at an average gain of 28% annually, and about 1.25 years of decline with an average loss also near 28% annually. Though the individual variations have been very wide, that has put the typical bull market gain at about 152% from trough-to-peak, followed by a bear market of about 34% from peak-to-trough, for a full-cycle total return of about 67% (roughly 10.7% annualized). Of course, if we could rely on these averages, it would be unnecessary for investors to think at all. Unfortunately, things are not so simple, partly because these "cyclical" fluctuations are embedded within a broader context of longer "secular" movements in market valuations. Historically, extended "secular" moves from extreme undervaluation (e.g. Shiller P/Es of about 7, as we saw in 1950 and 1982) to extreme overvaluation (multiples over 24, as we saw in 1929, 1965, 2000, and well, now) have taken about 15-18 years in each direction. Secular bull markets typically involve a whole series of bull-bear cycles, with each bull market peak achieving successively higher levels of valuation. Secular bear markets also involve a series of bull-bear cycle, but with each bear market trough achieving successively lower levels of valuation. Though some analysts discuss these secular periods as if they are some sort of magical 17-year periodic structure that is inherent to the markets, our view is much simpler: over the long-term, markets fluctuate between extreme optimism / high valuations and extreme pessimism / depressed valuations. Secular bull markets do not begin because the calendar says they are due. They begin at the point that valuations become so depressed - again, about 7 on a Shiller P/E - that strong and sustained long-term returns are baked in the cake. Similarly, secular bears tend to begin at the point where valuations are so extreme - about 24 or higher on a Shiller P/E - that weak and ephemeral long-term returns are baked in the cake. The intervening secular moves simply take the market from one extreme to another over the course of something on the order of 15-20 years. Though it's clear that 2000 was a major peak and the start of a secular bear, it's notable that despite more than a decade of meager returns, the Shiller P/E is again above 24. Since March 2000, when the Shiller P/E briefly touched an unprecedented level of 43, we've worked about 19 points off of the P/E, but it's not nearly enough. The market's valuation in 2000 was so extreme that the resulting secular bear has the potential to be more extended than others, unless the market was suddenly to collapse to valuations near those where historical secular bulls have started (where stocks have typically been priced to achieve 10-year prospective returns near 20% annually). From that standpoint, there's no chance that the 2009 low was the beginning of a secular bull, both because valuations weren't nearly low enough (prospective 10-year returns briefly exceeded 10% annually, but were nowhere close to those accompanying the beginning of previous secular bulls), and also because at present, valuations are already about the point where one would look for a secular bear to start. You might expect that when the market is gradually working down from a high level of overvaluation, bull markets would tend to be shortened, and bear markets would tend to be deeper. In fact, that's exactly what we observe. As the guys at Nautilus Capital note, cyclical bull markets within secular bears have tended to average just 26 months, with an average gain of 85%, while cyclical bears within secular bears have averaged 19 months, with steep average losses of -39%. So market cycles tend to be truncated during secular bears, averaging a full bull-bear cycle duration of just 45 months (3.75 years), for a full-cycle average gain of just over 12% (3.3% annualized). Of course, fundamentals still tend to grow faster than 3.3% over the cycle, resulting in valuations that are lower at each bear market trough, even if prices are higher in absolute terms. I recognize that outcomes like these are unpleasant and inconvenient to contemplate, but denying the possibility doesn't make anyone a better investor.
Despite the unique challenges of the most recent market cycle, I do expect that we will observe frequent opportunities to accept market risk in the coming years, even in an environment where valuations gradually work lower from a secular perspective. Even here, if we can clear some element of the hostile overvalued, overbought, overbullish, rising-yields syndrome that has characterized the market, we will be open to moderate, if transitory exposure to market fluctuations, provided that we maintain a line of index put option protection against any abrupt deterioration. In any event, however, I believe that the prospects for strong, durable, long-term stock market gains are dim at present. To repeat Grantham's observation, "the environment has simply become too risky to justify prudent investors hanging around, hoping to get lucky." Market Climate As of last week, the Market Climate for stocks remained characterized by an overvalued, overbought, overbullish, rising-yields syndrome that has historically been hostile for stocks. Strategic Growth and Strategic International Equity remain well hedged here. We expect to establish a moderately constructive, if transitory exposure to market fluctuations if we can clear some component of this syndrome without a decline steep enough to significantly damage market internals. Still, at present, there are enough headwinds from valuations, fiscal strains, unsustainable monetary policy, sovereign default risks, and other factors that we expect to maintain a "line" of downside protection with index put options even if we shift to a more constructive stance. Even here, about one-third of the hedge in Strategic Growth represents modestly in-the-money put options without a short-call side, so any significant advance will take those puts out-of-the-money and naturally produce a more constructive position. The upshot is that there are conditions even here that could encourage a greater market exposure, but none in the near term that would lead us to do so without some form of safety net. In bonds, we continue to observe some easing of yield pressures, but with the Fed's SOMA portfolio now at $2.51 trillion, with a $2.60 trillion target, it is equally clear that the Fed buying that has almost completely financed ongoing fiscal deficits will end abruptly in a few weeks, absent a fresh round of quantitative easing. Bernanke noted in his recent press conference that the Fed subscribes to the "stock" view of the monetary base - which essentially means that so long as they don't contract their portfolio, they would view policy as being in a sustained "easing" mode. That's actually true in the sense that as long as the monetary base amounts to an unprecedented 17 cents of base money per dollar of nominal GDP, short-term interest rates will tend to hold between 1-3 basis points (though with significant inflation risk if any exogenous interest rate pressures emerge). However, once the Fed's aggressive purchases stop, the fiscal deficits will not, so the markets will certainly be forced to absorb far more new Treasury debt than they have in recent months. In the event of economic weakness or significant concerns of credit defaults, that will be easy, and could even be associated with dollar strength. Otherwise, something will have to act as the adjustment variable to produce the requisite capital flows as new debt is issued. The potential adjustments might include further dollar weakness, higher interest rates, or a shortfall in gross domestic investment. In any event, it seems clear that simply keeping the SOMA portfolio constant will not be enough to claim that the policy environment is unchanged. In Strategic Total Return, our overall position remains fairly conservative given the wide range of potential outcomes. Still, easing pressures on yields, rising unemployment claims, and other factors have been reasonably favorable for modest maturities in the 5-year range, where Strategic Total Return holds much of its roughly 3-year duration. On significant weakness in precious metals shares, we added modestly to our holdings, bringing the total to a still-conservative 6% of assets, with another 2% of assets in utility shares. I noted a couple of weeks ago that the implied default probability for Greek debt had reached about 100% on the basis of 2-year yield spreads. Indeed, about 85% of global bond managers now anticipate a Greek debt restructuring. That expectation is also reflected in longer-term yield spreads such as 10-year and 20-year debt. Still, it is important that when we work the implied default figures across multiple maturities, we get a roughly 100% expectation for default about 1.7-2.3 years from today. This general time-frame is supported by the fact that default expectations are clearly not reflected in shorter-term debt maturities. Indeed, in the event of a near-term expectation of debt default, we would probably see 1-year Greek yields spiking above 40%, and 3-month yields well above 100% annualized (which would be associated with 3-month bills trading well below 85% of face). If the markets become truly concerned about Greek debt, those are the sorts of extremes that one would expect. As a side note, in the U.S., 3-month Treasury bill yields are now down to 2 basis points. This means that $1000 investment in 3-month bills now gets you a nickel of interest over the life of the investment. --- The foregoing comments represent the general investment analysis and economic views of the Advisor, and are provided solely for the purpose of information, instruction and discourse. Prospectuses for the Hussman Strategic Growth Fund, the Hussman Strategic Total Return Fund, the Hussman Strategic International Fund, and the Hussman Strategic Dividend Value Fund, as well as Fund reports and other information, are available by clicking "The Funds" menu button from any page of this website. |
|||||||||||||||||||||||||
|
For more information about investing in the Hussman Funds, please call us at
1-800-HUSSMAN (1-800-487-7626) 513-326-3551 outside the United States Site and site contents © copyright Hussman Funds. Brief quotations including attribution and a direct link to this site (www.hussmanfunds.com) are authorized. All other rights reserved and actively enforced. Extensive or unattributed reproduction of text or research findings are violations of copyright law. Site design by 1WebsiteDesigners. |