|
|
||||||
|
|

January 14, 2013 Declaring Victory at Halftime “It's important to emphasize that standard bear market declines have historically produced losses averaging about 30% - generally not just 20% (15% declines don't even qualify). I don't expect the next one to be a significant exception... Suffice it to say that the only reason to buy stocks here is a) the belief that one can sell them to a greater fool at higher prices despite already overvalued, overbought, overbullish and rising yield conditions, or b) the belief that the stock market will soar 30-50% from these levels, without experiencing even a minimal bear market in the next 4-5 years. “Sometimes, it is sensible to speculate to some extent, even in overvalued conditions, if market action indicates an appetite of investors for risk and the market is not overbought or excessively bullish. Sometimes, strong multi-year gains without an intervening bear market are reasonable to expect, but those periods generally begin at much more favorable valuations. I realize that there is a visceral urge to participate here, as well as a fear of missing out when the market is hitting new highs, but over the full market cycle, investing to achieve short-term comfort costs a fortune.” Hussman Funds Weekly Market Comment: June 18, 2007 – New Economy, or Unfinished Cycle? Last week, the S&P 500 came within 1% of reprising a syndrome that we’ve characterized as a Who’s Who of Awful Times to Invest, featuring a Shiller P/E over 18 (S&P 500 divided by the 10-year average of inflation-adjusted earnings), the S&P 500 more than 50% above its 4-year low and 8% above its 52-week smoothing, investment advisory bulls (Investors Intelligence) over 47% with bears below 27%, and Treasury bond yields higher than 6 months earlier. This combination is one of numerous and nearly equivalent ways of defining an “overvalued, overbought, overbullish, rising-yields” syndrome. While there are certainly numerous conditions that are informative about stock market returns, and capture a much broader set of negative market outcomes, I don’t know of any other syndrome of market conditions – however defined – that has been so consistently hostile for stocks over the past century. The historical instances corresponding to the above conditions represent a chronicle of overextended bull market rallies, where investors would typically have been quite incorrect to declare victory at halftime: December 1972 - January 1973 (followed by a 48% collapse over the next 21 months) August - September 1987 (followed by a 34% plunge over the following 3 months) July 1998 (followed abruptly by an 18% loss over the following 3 months, and at the beginning of a nearly 14-year period where the S&P 500, including dividends, has underperformed Treasury bills, with the S&P 500 nearly 30% lower four years later) July 1999 (followed by a 12% market loss over the next 3 months, and a series of whipsaw recoveries and losses, with the S&P 500 over 40% lower three years later) January 2000 (followed by a spike 10% loss over the next 6 weeks, a series of whipsaw recoveries and losses, and finally a bear market that took the S&P 500 over 45% below its Jan 2000 level by late 2002) March 2000 (followed by a spike loss of 12% over 3 weeks, and a 49% loss into 2002) July 2007 (followed by a 57% market plunge over the following 21 months) January 2010 (followed by a 7% "air pocket" loss over the next 4 weeks, with a recovery into April and then a renewed decline, leaving the S&P 500 about 11% lower by July) April 2010 (followed by a 17% market loss over the following 3 months) December 2010 (near the start of QE2, and followed by a 10% further advance in the S&P 500 into May 2011, when an additional syndrome emerged that was also observed last week – see Extreme Conditions and Typical Outcomes – whereupon an 18% market plunge wiped out the entire gain, and then some). March 2012 (followed by a further advance of about 3% over the following 3 weeks, and then a quick if unmemorable market decline of nearly 10%). To examine this syndrome in data before the early 1960’s, sentiment figures have to be imputed, but that’s not difficult to do given the strong correlation between sentiment and the size and volatility of preceding market movements. On the basis of those estimates, we would include December 1961 (followed by a 27% market decline over the next 6 months), August 1929, and several other periods of risk, but the more recent record should be sufficient to encourage caution. There are also two fairly uneventful signals in the record, one in mid-1964 that was not followed by near-term losses, though the market was still lower two years later and would underperform Treasury bills for the next 20 years, and the other in mid-1997 during the internet bubble, which was also not followed by near-term losses, though the market would underperform Treasury bills over the next 12 years. I should note that the thresholds in the above syndrome aren’t magic numbers – they’re simply ways to make the syndrome operational. We capture the same set of instances, with little variation, even with different cutoffs, as long as they reflect a reasonable “overvalued, overbought, overbullish, rising-yields” combination. Importantly, regardless of whether we look at the period since the 1920’s, or only the period since the 1960’s, the average market loss within a two-year period following these conditions has been over 27%. Indeed, if we look only at periods prior to 2010, the average market loss within a two-year period following these conditions has actually been about 36%. What now? Repeated monetary interventions have deferred the onset of market weakness following these syndromes since 2010, and appear – for now – to have held off the full-fledged bear market declines that have normally started within a few quarters. But even since 2010, the overvalued, overbought, overbullish, rising-yields syndromes we’ve observed have regularly been followed by sufficiently large corrections to make these conditions worth noting. That record doesn’t ensure a significant correction in this instance, of course, but in my view, present conditions represent a “textbook” example of conditions where investors have been misguided to place their faith in a market advance. It’s certainly possible that investors could still drive stocks higher over several weeks or a few months, but given a bull market that is already quite mature, the historical record suggests that investors will ultimately find their present enthusiasm regrettable. The strongest investment returns emerge at points that are diametrically opposed to what we observe today – valuations are reasonable (even if not depressed), stocks are oversold, bearishness is rampant, and yields are falling. From a return/risk standpoint, the best opportunities to accept market risk emerge when a decline to moderate valuations is joined by an early firming in market action – not when the market has already enjoyed an extended advance, carries a Shiller P/E of 22, exhibits lopsided bullish sentiment, and pushes every upper Bollinger band (two standard deviations above the 20-period moving average) at daily, weekly and even monthly resolutions. These observations would be more obvious and intuitive had we provided a more recent example by moving away from a defensive position in 2009-early 2010, as we did after the 2000-2002 bear market. It’s an unfortunate reality that the credit crisis was so out-of-sample from the standpoint of post-war data that we were forced to stress-test our approach against Depression-era data. During the Depression, stocks dropped by two-thirds even after “reasonable” valuations were achieved, and even strong trend-following measures were subject to whipsaws that allowed for repeated drawdowns in the area of 40-50%. Elevating economic risk through monetary interventions and accounting changes that remove balance-sheet transparency (the latest being a watering-down of the Basel Accords that only Charles Ponzi could love) have ironically made it rewarding in the recent cycle to simply ignore concerns about systemic risk, stress-testing, illiquidity, and policy distortion. We’ll see how that plays out over the coming market cycles (and the completion of this one). I believe that we’re prepared for a much broader range of outcomes than investors seem to anticipate, and have also adapted to a world – however unlikely – where massive interventions might continue without negative consequences. In any event, however, the proper way to seek returns is not to embrace market risk in a mature bull market featuring the most hostile of investment conditions, in violation of everything we know about risk. Rather, having addressed the extraordinary requirements of the recent market cycle, the proper response is to proceed with a robust, well-tested approach in the expectation that strong opportunities (or at least repeated moderate opportunities) will emerge during the coming cycle, as they have emerged during every market cycle in the past. Frankly, I doubt that any of the market’s return since early 2010 will prove to be durable by the end of the market cycle that began from the 2009 low. Indeed, given that the average cyclical bear market in a secular bear market takes the S&P 500 about 39% lower, I suspect that the resolution of the coming cycle may wipe out not just half (which is typical), but most of the bull market advance since 2009. Overbullish equity sentiment is now full-blown with 51.1% bulls vs. 23.4% bears; stock margin debt now exceeds 2% of GDP, as it has in only three prior instances: the 2000 market peak, the 2007 market peak, and the intermediate market peak of February 2011 (not a terrible outcome, but still followed by an 18% decline in the S&P 500 over the following 7 months); earnings prospects appear dismal on a 4-year horizon (as supported in more detail below); and the main reason for reduced investment allocations to stocks - compared to bonds - is the enormous new issuance of debt in recent years, since somebody has to hold the outstanding quantity of both. With those caveats in hand – specific to the equity market – I strongly recommend reading the latest letter from celebrated bond investor Howard Marks of Oaktree Capital, who echoes our own broad concerns about financial risk here. We remain both optimistic and patient for bullish opportunities to emerge as market conditions change. Present overvalued, overbought, overbullish, rising-yield conditions fall within a tiny percentage of market history that is associated with dismal market outcomes, on average. It’s true that we’ve observed extreme conditions since about March 2012 with little resolution aside from short-term declines. But the S&P 500 remains only a few percent from its March 2012 high, and if history is any guide, the extension of these unfavorable conditions is not likely to reduce the depth of the market loss that can be expected to resolve them. Take it to the limit “In particular, the Committee decided to keep the target range for the federal funds rate at 0 to 1/4 percent and currently anticipates that this exceptionally low range for the federal funds rate will be appropriate at least as long as the unemployment rate remains above 6-1/2 percent, inflation between one and two years ahead is projected to be no more than a half percentage point above the Committee’s 2 percent longer-run goal, and longer-term inflation expectations continue to be well anchored.”
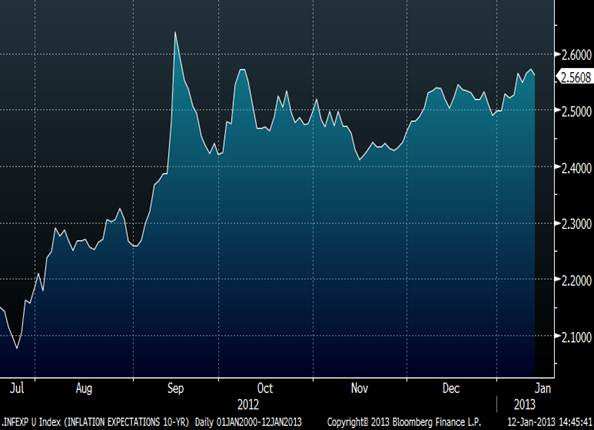
Inflation expectations are typically inferred using the difference between nominal interest rates and the real interest rate on inflation-protected securities of the same maturity. Since nobody at the Fed actually seems to be tracking long-term inflation expectations, the following chart shows 10-year inflation expectations implied by the difference between the 10-year nominal Treasury yield and the yield on the Treasury Inflation Protected Security maturing closest to 10 years from today. Notice that the 10-year expected rate of inflation abruptly spiked past 2.5% months ago. The precise date of that spike? September 13, 2012 – the day that Ben Bernanke announced QEternity. At present, the 10-year TIPS yield is -0.70%, meaning that investors are paying for inflation protection by pricing the bond at a negative real interest rate. This compares with a yield of 1.86% on the 10-year nominal Treasury, implying a 10-year inflation expectation of 1.86 – (-0.70) = 2.56%.
The upshot is that further quantitative easing became inappropriate on precisely the day that it was announced. The Fed has already successfully destabilized inflation expectations not for two years, but for the next decade. So much for “anchoring” long-term inflation expectations. Does that mean this recklessness will stop? Probably not. The Fed will likely wait until the spread between the 2-year nominal yield (presently 0.25%) and the 2-year TIPS yield (presently -1.79%) shoots above 2.50% (presently 2.04%). At that point, long-term inflation expectations will be further destabilized, and we can all watch as the Fed tries to stuff Genie back in the bottle. What is distressing about quantitative easing is that aside from distorting savings and investment decisions, it achieves no real effects other than a short burst of pent-up demand for a quarter or so, and a “portfolio balance” effect that helps the stock market recover whatever loss it experienced over roughly the prior 6-month period. Other than that, the additional reserves simply accumulate as idle bank balances. Put simply, QE does not relieve any constraint on the economy that is actually binding. The approach is misguided because it is based on a belief in “wealth effects” that can be found nowhere in economic theory (where the concept of “permanent income” argues strongly against the idea that transient portfolio fluctuations affect consumption), nor in historical data (where a 1% change in stock market value has at best a short-lived effect on GDP on the order of 0.03-0.05%). Yes, one can demonstrate a “portfolio balance” effect – increasing the stock of zero-interest cash balances will tend to reduce the yield on competing investments, particularly short-dated instruments like Treasury bills. But this is pushing on a string; there's no transmission mechanism to the real economy. Unfortunately, as I've said before, if you're around academia for any length of time, you learn that few academic economists actually study the economy. They study “economies” in a very abstract sense. As in “consider an economy in which there are two islands, a turnpike, and five guys named Jack, one of whom is the government but nobody knows it...” Several years ago, the credit crisis emerged as years and years of debt on easy terms finally came face-to-face with unproductive and overpriced assets that had been financed with that debt. Quantitative easing is little more than a hat trick to perpetuate this imbalance by encouraging even more debt on easy terms, but it also suppresses the incentive to save, and it lowers productivity by encouraging financial speculation rather than the allocation of capital toward its highest uses. The economy is trapped in a low-level economic equilibrium where businesses are slow to create jobs because consumer demand is weak, and where consumer demand is weak because businesses are slow to create jobs. Until the root causes of the weak demand (excessive consumer debt and underwater mortgage obligations) are addressed, until pressing global risks are addressed (the need to restructure unserviceable European debt burdens and quietly insolvent European banks), and until new innovations emerge that employ enough workers to create enough income to sustain demand for those innovations (which requires productive investment, research and development), little is likely to change. Meanwhile, funds that would normally finance new productive investment are instead going to finance new government debt, and the proceeds from new government debt is going – in aggregate - to finance the shortfall between consumer income and consumer spending. In the process, corporate profit margins are broadly distorted because revenues are propped up despite depressed employment, and because deficits in one sector of the economy must be matched by a surplus in another. This bad equilibrium leaves the combined share of consumption and government spending at a record high proportion of GDP, while the share allocated to productive investment dwindles. Quantitative easing will do nothing to fix this, because it perpetuates debt accumulation, distorts savings and investment decisions, and enables government spending, transfer payments, and growing indebtedness instead of investment, capital accumulation, and employment. To some extent, we should welcome higher inflation expectations, because at least they might bring the Fed’s intentional distortions closer to an end. On the outlook for corporate profits Presently, corporate profits as a share of GDP remain about 60-80% above their historical norm, depending on the measure one uses. Meanwhile, Wall Street is enthusiastic not only to take current price/earnings multiples at face value, but to extrapolate strong future rates of earnings growth. As a reminder of the reality that will predictably follow this mistake, the chart below shows the ratio of corporate profits to nominal GDP (left scale), along with the subsequent annual growth rate of corporate profits over the following 4-year period (right scale, inverted). Note that the inverted right scale means that higher values represent slower profit growth. At present, current profit margins are consistent with earnings contraction over the coming 4-year period at something close to a -10% annual rate, implying a drop in corporate profits by more than one-third in the coming years (even assuming intervening growth in GDP). That sort of decline would be consistent with a normalization of profit margins, without taking them below their historical average. Investors who believe that stocks are “fairly priced” on the basis of “forward operating earnings” seem to have no appreciation of the extent to which depressed savings rates and massive government deficits have temporarily boosted corporate profits over the past few years (see Too Little to Lock In for the accounting relationships here).
The foregoing comments represent the general investment analysis and economic views of the Advisor, and are provided solely for the purpose of information, instruction and discourse. Only comments in the Fund Notes section relate specifically to the Hussman Funds and the investment positions of the Funds. Fund Notes With market conditions now recapitulating the most negative overvalued, overbought, overbullish, rising-yields syndromes that we identify, we remain defensive at present. Conditions can change quickly, and we are patiently looking for opportunities to take a more constructive stance, but to reach for gains in a strenuously overbought market, where prospective returns are quite low by our estimates, bullishness is excessive, and competing returns are rising, is a dangerous way to invest in my view. Strategic Growth Fund remains fully hedged, with a staggered strike position that raises our index put option strikes somewhat closer to market levels, at the cost of additional option premium amounting to less than 1% of assets looking out to springtime. Strategic International remains fully hedged. Strategic Dividend Value is hedged at about 50% of the value of its stock holdings – its most defensive position. Strategic Total Return has a duration of about 3.5 years at present (meaning that a 100 basis point move in Treasury yields would be expected to impact the Fund by about 3.5% on the basis of bond price fluctuations), with just under 10% of assets in precious metals shares – where general conditions remain positive but real interest rates after inflation have recently been pressed higher (as nominal interest rates have increased even faster than inflation expectations) – and about 5% of assets in utility shares. A few comments specific to the Strategic Growth Fund: Since the all-time high in Strategic Growth Fund on 9/17/08 through last Friday, the Fund has experienced a total peak-to-trough drawdown of 24.36%, including reinvested distributions. Of this, 21.45% of the decline occurred in the two months between 9/17/08 and 11/20/08. The period since then includes a moderate recovery followed by an extension of the 2008 drawdown by about 3%. By comparison, the deepest loss experienced by the S&P 500 during the recent cycle was 55.25%, including dividends, between 10/09/07 and 3/09/09. To put some algebraic perspective on that difference in risk exposure, even if you’ve experienced a 24.36% drawdown, it takes more than an additional 40% decline to turn that into a 55.25% drawdown. Conversely, it takes a 69% advance just to turn a 55.25% drawdown into a 24.36% drawdown. So while we’ve been uncomfortable during the recent cycle, the notion that our risk has somehow approached that of the market, or that heroic gains are required to establish new highs, or even that we are very tolerant to risk, is simply a misjudgment in my view. Strategic Growth seeks to outperform the S&P 500 over the complete cycle, with smaller periodic losses than a buy-and-hold approach (and has indeed done so since the Fund’s inception - additional performance figures and reports are available on The Funds page of the website). The drawdown we’ve experienced in Strategic Growth in the most recent cycle has been frustrating, but is hardly insurmountable. The majority of my personal assets remain invested in Strategic Growth Fund, and I’m enthusiastic about that despite feeling put through the ringer in recent years. As anyone familiar with our pre-2009 experience knows, I have no intention or expectation of running a single-digit, perpetually-defensive horserace with the S&P 500 over time. The fact that the past cycle has produced that result is a reflection of economic events, policy interventions, and market action that were extraordinary from a historical perspective, and that I believe we can navigate in the future if they become more commonplace. Past performance, favorable or unfavorable, is not indicative of future returns. In my view, there are some points where process, discipline and historical research carry great weight, and I believe this is one of them – as much as bulls might like to declare victory at halftime.--- The foregoing comments represent the general investment analysis and economic views of the Advisor, and are provided solely for the purpose of information, instruction and discourse. Prospectuses for the Hussman Strategic Growth Fund, the Hussman Strategic Total Return Fund, the Hussman Strategic International Fund, and the Hussman Strategic Dividend Value Fund, as well as Fund reports and other information, are available by clicking "The Funds" menu button from any page of this website. |
|||||||||||||||||||||||||
|
For more information about investing in the Hussman Funds, please call us at
1-800-HUSSMAN (1-800-487-7626) 513-326-3551 outside the United States Site and site contents © copyright Hussman Funds. Brief quotations including attribution and a direct link to this site (www.hussmanfunds.com) are authorized. All other rights reserved and actively enforced. Extensive or unattributed reproduction of text or research findings are violations of copyright law. Site design by 1WebsiteDesigners. |