|
|
||||||
|
|

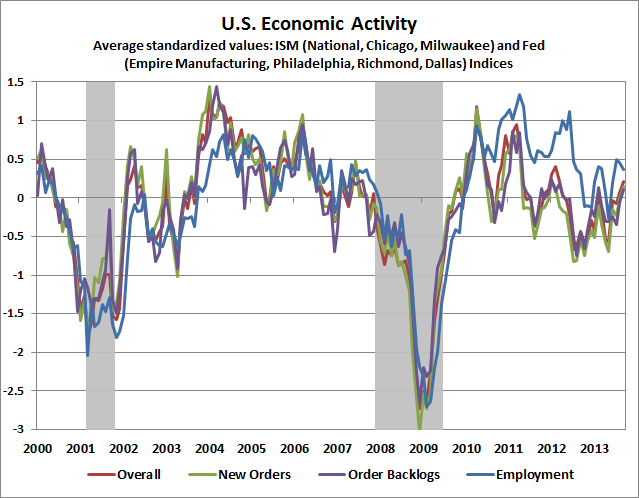
October 7, 2013 When Economic Data Is Worse Than Useless “Errors using inadequate data are much less than those using no data at all.” – Charles Babbage “The greatest enemy of knowledge is not ignorance, it is the illusion of knowledge.” – Stephen Hawking “If we have data, let’s look at data. If all we have are opinions, let’s go with mine.” – Jim Barksdale I spend a large fraction of my waking hours working with numbers, particularly given that we follow a ruthless discipline of evidence-based investing. Generally speaking, I agree with Babbage that even inadequate (what I would call “noisy”) data leaves one less prone to error than using no data at all. One of our key activities around here, in fact, is noise-reduction. A sufficient amount of noisy data can still produce a clean or at least useful signal. Still, numbers and data are only the workhorses of thought and insight, and an important part of data analysis to attend to any breakdown in relationships. During the 2000-2002 market plunge, and again in 2007-2009, investors who believed that one should always “follow the Fed” got their heads handed to them, as the market lost half of its value in both instances, despite persistent and aggressive Fed easing. Models that were too dependent on interest-rate trends fared particularly badly, as plunging interest rates did nothing to support stock prices. So while Babbage is correct to favor noisy data over none at all, Hawking is also correct, essentially warning us to constantly question what we believe to be true. From an analytical perspective, it’s helpful to pay attention to the “data-generating process” – looking carefully at the real-world mechanisms and interactions that produce the data, in order to understand what is driving the numbers being observed. Analysis of the data-generating process is one of the reasons that I’m convinced that quantitative easing will end in tears. Any economic policy achieves its effect basically by removing some constraint on the economy that was previously “binding” – holding the economy back in some way. If you look at QE, it should be clear that adding another trillion dollars of idle reserves will not relieve any constraint that is not already relieved by the trillions of idle reserves already in the banking system. QE basically has its effect on financial markets by forcing someone to hold the zero-interest cash that the Fed has created, which makes them uncomfortable and leads to a game of “hot potato” as each cash holder seeks higher-yielding alternatives. That, in turn, drives up the prices and drives down the yields on those alternatives (primarily stocks) until someone is finally indifferent between holding zero-interest cash and chasing overvalued stocks. QE may not have any durable effects on the real economy beyond short-lived can kicks, but the impact of QE on financial distortion is cumulative. The harder the Fed pushes on the string, the larger the attached bubble becomes. Compound this with the fact that profit margins are temporarily about 70% above their historical norms (a surplus in the corporate sector that is the mirror-image of unusual deficits in the household and government sectors), and it becomes clear that QE has created a situation where investors are willing to hold stocks that they believe are somewhat overvalued, but that are in reality overvalued about 70% beyond even that. I cannot emphasize strongly enough how steep valuations are from a historical perspective. Aside from 1929, 1937, and the secular valuation peak in the mid-1960's, the only steeper valuations in history were points of overvaluation since the late-1990’s that predictably ended with brutal losses over the completion of those market cycles, as investors discovered in 2000-2002 and again in 2007-2009. Did I mention that persistent and aggressive Fed easing did nothing to prevent stocks from losing half of their value in each of those declines? Ah, yes, I believe I did. It will not be a surprise to see the present cycle concluded with similar losses. There's clearly some uncertainty as to when, but this is a very old bull from a historical perspective. Our measures of market internals did not confirm the recent highs, and have not recovered from their deterioration in June (see Market Internals Suggest a Shift to Risk-Aversion). This suggests - at least for now - that the speculative peak is most likely behind us, though the Fed's recent inaction and a variety of short-term factors (Fed Chair nomination, fiscal issues) leave some risk of a speculative blowoff. None of this is to say that seeking a deep understanding of the data won’t keep you from occasionally getting your head handed to you anyway. Though our approach nicely navigated the 2000-2007 peak-to-peak market cycle, as well as the 2007-2009 plunge, my insistence on stress-testing our approach in response to the financial crisis was punished by missed returns in 2009-early 2010 while we solved the “two data sets problem” involving post-war and Depression-era data. In hindsight, we would have been happier had we stuck with our existing methods – trusting that all post-war relationships were still intact – or if our present methods had already been in hand. Needless to say, our present methods have the better record across market cycles through history, but we don’t get a do-over on the extraordinary cycle that forced that transition. Looking at present economic and financial conditions, my impression is that much of the data being used by investors and economists is not simply “inadequate” – which at least allow Babbage to rely on it nonetheless – but is instead what Hawking called an “illusion of knowledge.” That’s most clearly true in the case of valuation measures, where Wall Street’s most cherished benchmark (price to forward operating earnings) is so skewed by unprecedented profit margins that it’s wholly unrepresentative of “valuation” at all. By our estimates, even a 40% market plunge would only restore the prospective 10-year return on the S&P 500 to average historical norms, and certainly not to levels associated with important points of historical undervaluation or “secular” troughs. It may be helpful to examine the data in this regard before it’s too late (see Investment, Speculation, Valuation, and Tinker Bell for some useful perspective). Unfortunately, the “illusion of knowledge” also now extends to economic data – particularly leading indicators of economic activity. Investors and analysts fall over themselves daily to analyze and interpret the latest data from regional Fed surveys (e.g. Philly Fed, Empire Manufacturing), purchasing managers indices (e.g. national manufacturing, national services, regional PMIs), and other economic measures (e.g. new unemployment claims, average weekly hours). The problem is that virtually all of these measures have become not only uncorrelated with subsequent economic outcomes, but negatively correlated with subsequent outcomes. In other words, the economic data have become worse than useless here. To illustrate, let’s start with a quick review of recent economic activity. The basic view, using a variety of national and regional surveys from the Federal Reserve and the Institute for Supply Management (ISM) suggests a slight uptick in activity in recent months, but still at tepid levels. The chart below shows the overall, new order, order backlog, and employment components of these indices as standardized variables (mean zero, unit variance) so they can be compared directly.
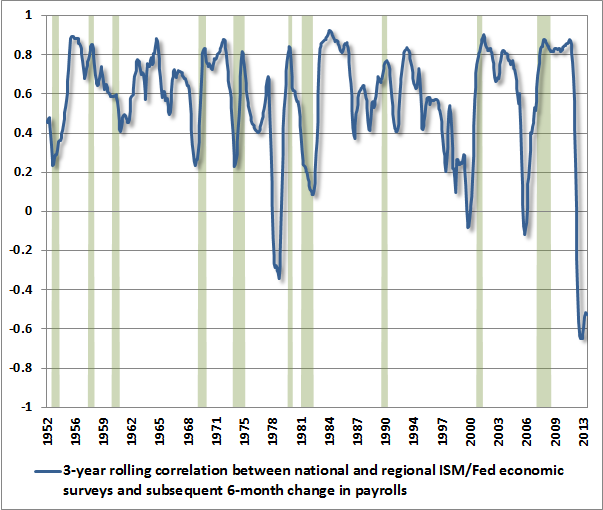
What’s problematic even here, unfortunately, is that this economic data has become not only unrelated, but inversely related to subsequent economic outcomes. The data provides no insight into future economic activity at all. The chart below, for example, shows the relationship between the above measures of U.S. economic activity and the growth of U.S. non-farm payroll employment over the subsequent 6-month period. The line represents the rolling 3-year correlation between the two.
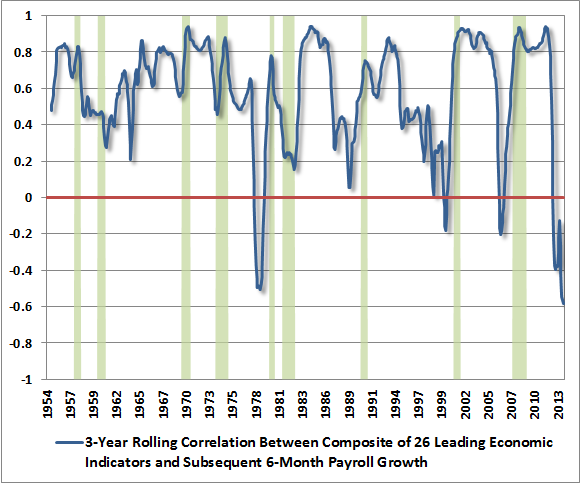
We can extend this analysis to a much broader range of historically reliable, leading measures of economic activity. Again, the relationship between historically useful measures and actual subsequent economic activity has collapsed. This isn’t only true of subsequent employment growth. It’s true of the relationship between historically reliable economic measures and subsequent changes in GDP, industrial production, and importantly, stock prices.
Normally, the dynamic runs something like this: leading economic measures deteriorate; the economy subsequently deteriorates; leading economic measures improve; and the economy subsequently improves. The result is a positive correlation between leading measures and subsequent activity. In contrast, the recent dynamic runs something like this: leading economic measures deteriorate; the Fed responds with some massive intervention that is unprecedented in scale; economic activity and leading measures temporarily improve; but since these improvements were entirely artificial, the improvement is quickly followed by fresh deterioration in both economic activity and leading measures. The result is an inverse correlation between leading measures and subsequent activity. The upshot here is that it’s critical for investors to take month-to-month economic reports with a grain of salt. Given that we accurately anticipated both the 2000-2001 recession and the 2007-2009 recession, the deterioration in the relationship between historically reliable indicators and subsequent economic outcomes has been frustrating, as it probably has for the tiny number of other economists who also accurately anticipated those recessions (e.g. Lakshman Achuthan of ECRI). Aside from briefly clouding our records, only a few economists really understand how closely the U.S. economy has been hugging the edge of recession lately. I have no doubt that the normal historical relationships will reassert themselves over time. Indeed, there’s a modest historical tendency for these correlations to be weakest shortly before recessions. In any event, quantitative easing has distorted more than just the financial markets, and has made a great deal of other data uninformative. In the financial markets, we’ve recently seen a reduced correlation between “overvalued, overbought, overbullish” syndromes and subsequent market outcomes. As I noted in The Road to Easy Street, these syndromes have historically resulted in brutal average market losses, but since late-2011, they’ve been followed by a nearly relentless market advance. Still, it’s not at all clear that the profound downside risk created by these conditions has been removed – it may have simply been postponed (and I believe that’s probably the case). Presently, we face a combination of unfavorable valuation and still unfavorable market internals – what I’ve called a broken speculative peak. Emphatically, our present defensiveness does not rely on the presence or absence of an overvalued, overbought, overbullish syndrome. We haven’t ruled out the possibility of a speculative blowoff, but that’s a risk best treated as something to be insured against than something to be anticipated. A fresh round of risk-seeking in the face of extreme valuations would only make the ultimate losses that much worse. Again, take monthly economic data with a grain of salt here. Historical experience has generally been that the most severe market losses, hands down, occur when a broken speculative peak is joined by an economic downturn. The problem is that such a downturn may or may not be adequately reflected in the most widely-followed data until it is too late. The best approach, in my view, is to attend to valuations and market action, with continued attention – though perhaps not as aggressive – to the emergence of any fresh “overvalued, overbought, overbullish” syndrome of conditions. The foregoing comments represent the general investment analysis and economic views of the Advisor, and are provided solely for the purpose of information, instruction and discourse. Only comments in the Fund Notes section relate specifically to the Hussman Funds and the investment positions of the Funds. Fund Notes As of last week, Strategic Growth Fund remained fully hedged, with a “staggered strike” position that places the strike prices of its index put options close to present market levels. The Fund also has a small fraction of 1% of assets in out-of-the-money index call options, largely as a “contingent” position to insure against the small risk of fresh improvement in our measures of market action at higher levels. With the likely announcement of a candidate nominee for Fed Chairman and fiscal uncertainty, my impression is this sort of insurance remains inexpensive given present levels of implied volatility (which affects the price of option premium). Strategic International remains fully hedged, and Strategic Dividend Value is hedged at about 50% of the value of its stock holdings. Strategic Total Return continues to carry a duration of about 6 years (meaning that a 100 basis point move in interest rates would be expected to impact Fund value by about 6% on the basis of bond price fluctuations). The Fund also has very small exposures in precious metals and utility shares, with about 2% of assets in each sector. --- The foregoing comments represent the general investment analysis and economic views of the Advisor, and are provided solely for the purpose of information, instruction and discourse. Prospectuses for the Hussman Strategic Growth Fund, the Hussman Strategic Total Return Fund, the Hussman Strategic International Fund, and the Hussman Strategic Dividend Value Fund, as well as Fund reports and other information, are available by clicking "The Funds" menu button from any page of this website. |
|||||||||||||||||||||||||
|
For more information about investing in the Hussman Funds, please call us at
1-800-HUSSMAN (1-800-487-7626) 513-326-3551 outside the United States Site and site contents © copyright Hussman Funds. Brief quotations including attribution and a direct link to this site (www.hussmanfunds.com) are authorized. All other rights reserved and actively enforced. Extensive or unattributed reproduction of text or research findings are violations of copyright law. Site design by 1WebsiteDesigners. |