|
|
||||||
|
|

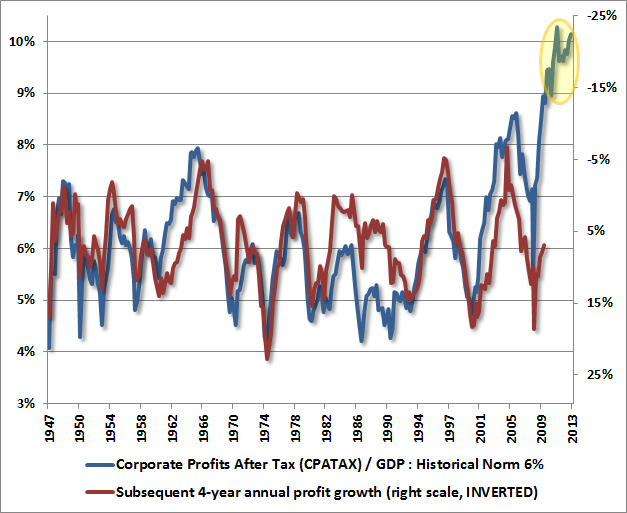
December 16, 2013 The Coming Retreat in Corporate Earnings The iron law of investing is that an investment security is nothing more, and nothing less, than a claim on some expected stream of future cash that will be delivered into the hands of investors over time. In some cases, the future payment is simple, like a bond that promises to pay a lump sum of $100 ten years from today. Pay $38.55 for that bond today, and you can expect a 10% annual rate of return on your money. Pay $67.56 for that bond today, and you can expect a 4% annual rate of return. Pay $82.03 and you can expect a 2% annual rate of return over the next decade. The more you pay today for an expected future amount, the lower your implied rate of return. Conversely, given any “required” rate of return you seek on your investment, you can work backwards and figure out the “present value” that you’re willing to pay. In some cases, the future payment is complicated, like an option that promises to pay you the difference between the price of a stock and some “strike price,” provided that the actual price gets past the strike price in the next few months. For that security, you have to compute the payoff that the option might deliver at every price beyond the strike price, multiply each of those values by the estimated probability the price will get to that particular point, and then discount everything back to present value. To simplify all of that, option pricing models make various assumptions about probability distributions, volatility, and other considerations. But simple, or complex, or anywhere in the middle, an investment security is nothing more, and nothing less, than a claim on some expected stream of future cash that will be delivered into the hands of investors over time. In practice, few investors want to estimate a whole stream of future cash flows, so they take shortcuts. Those shortcuts, however, are entirely dependent on the assumptions one is willing to make. Suppose you have a security that is expected to produce a very smooth stream of future payments over time, growing at some constant rate. In that case, the current payment is really all you need to value the security because it is representative of the whole stream. On the other hand, if the current payment is not representative of the whole stream, you’re in trouble. That warning applies to price/earnings ratios, price/10-year earnings ratios, price/forward earnings ratios, and virtually every other valuation measure that takes any shortcut whatsoever. Treat your “fundamental” as representative when it’s not, and it doesn’t matter which measure you’re using – you’re going to get a misleading estimate of valuation. Applying a seemingly “reasonable” price/earnings multiple to cyclically elevated earnings is a repeated mistake, and is unfortunately exactly the same one that I waved my arms to warn about in 2000 (“One of the hard lessons that investors will learn in the coming quarters is that technology stocks are actually cyclicals”) and 2007 (“You wouldn't buy a lemonade stand by extrapolating the profits it earns in August”) – to no avail. In our own work, we rely on a broad range of valuation measures. Many of them embed various adjustments to capture the fact that earnings, dividends and other value-drivers are often not very representative of the entire future stream. A few very simplified models that still have a near-90% correlation with actual subsequent market returns are presented in Investment, Speculation, Valuation and Tinker Bell. Because the Shiller P/E (the S&P 500 divided by the 10-year average of inflation-adjusted earnings) is simple to calculate and broadly quoted, I often mention it in these weekly comments – at least it has the virtue of being less vulnerable to year-to-year swings in earnings over the course of the business cycle. But our work is emphatically not driven by the Shiller P/E, our valuation approaches go far beyond the Shiller P/E, and even the Shiller P/E is at best a shorthand measure of market valuations. To understand our deeper concern, it’s important to focus on the word “representative.” Any valuation measure like “price/X” is only useful to the extent that X is representative of the very long-term stream of future cash flows. As I’ll detail below, the problem at this moment is that profit margins are about 70-80% above their historical norms; there is a century of history (including the experience of the most recent decade) to demonstrate that elevated profit margins have always normalized over time; we know why they normalize over time; and we already observe pressures that are likely to force this sort of normalization over the coming 2-4 years. In short, the earnings measures typically used in Wall Street’s valuation work are more unrepresentative than at any time in history, and investors are vastly overpaying for stocks as a result. In this context, remember that stocks are presently 50-year duration instruments. Even if margins were to remain elevated for several years more (which is unlikely), it would not follow that present earnings are representative of the long-term stream that is actually relevant for pricing stocks. The coming retreat in corporate earnings We should begin with an observation. If one examines the historical data, there is a very weak relationship between year-to-year changes in earnings and year-to-year changes in the stock market. This lack of relationship partly reflects the fact that stock prices often recover from recessions quite briskly well before earnings advance, and stock prices often collapse well before earnings do. But even accounting for these leads and lags, the relationship between cyclical fluctuations in the S&P 500 and S&P 500 earnings is simply not very strong. My concern at present is emphatically not simply a concern about the near-term direction of earnings, or any assumption that stocks must closely follow earnings. Rather, my present concern is much more secular in nature. It can be expressed very simply: investors are taking current earnings at face value, as if they are representative of long-term flows, at a time when current earnings are more unrepresentative of those flows than at any time in history. The problem is not simply that earnings are likely to retreat deeply over the next few years. Rather, the problem is that investors have embedded the assumption of permanently elevated profit margins into stock prices, leaving the market about 80-100% above levels that would provide investors with historically adequate long-term returns. An equivalent way to say this is that stocks are currently at levels that we estimate will provide roughly zero nominal total returns over the next 7-10 years, with historically adequate long-term returns thereafter There are several ways to look at profit margins, with varying implications – though all negative – for the extent of retrenchment that can be expected in corporate earnings in the coming 2-4 year period. The first chart below presents a rather pure mean-reversion argument. The blue line shows the ratio of corporate profits to GDP, which is currently more than 80% above its historical norm. The red line shows the annual growth in profits over the following 4-year period (inverted). Put simply, high profits/GDP are associated with weak subsequent profit growth, while depressed profits/GDP are associated with strong subsequent profit growth. At present, the extreme profit/GDP ratio we observe here is consistent with expectations of a 22% annual contraction in profits over the coming 4-year period – which would imply a roughly 63% cumulative contraction in profits from present levels. My impression is that’s probably too aggressive an expectation except as a temporary trough. A more reasonable expectation, in my view, would put corporate profits down about 10% annually over the next few years.
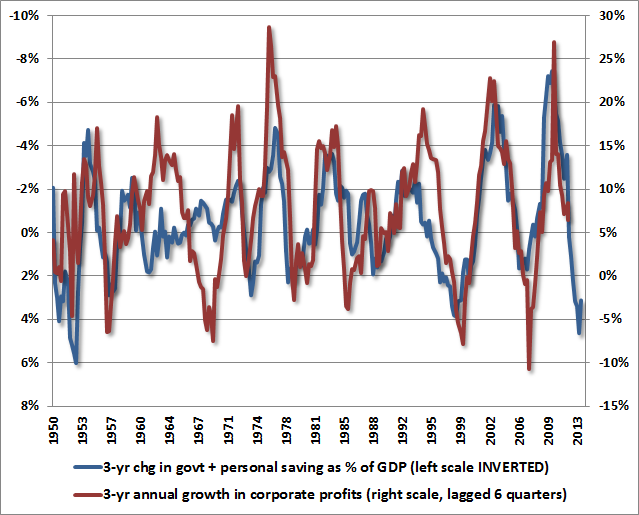
Part of the reason we would expect a more muted contraction in profit margins is the recognition that government budget deficits are likely to remain relatively high in the coming years. A simple way to think of the circular flow of the economy is that corporations produce output and pay salaries, while worker/households use that income to purchase output and consume. In recent years, weak employment paired with massive government deficits have introduced a wedge into the circular flow, allowing wages and salaries to fall to the lowest share of GDP in history, even while households have been able to maintain consumption as the result of deficit spending, reduced household savings, unemployment compensation and the like. The deficits of one sector emerge as the surplus of another. As a result, deep deficits in combined government and household saving have created a mirror-image surplus of corporate profits in recent years. The chart below shows the relationship between 3-year changes in government and household savings versus 3-year growth in corporate profits (partly overlapping, but partly subsequent as inventories and other factors can induce slight lags). The upshot of this chart is that recent improvements in government and household savings are already working their way through the economy, and are likely to be observed as a contraction of corporate profits in the next few years.
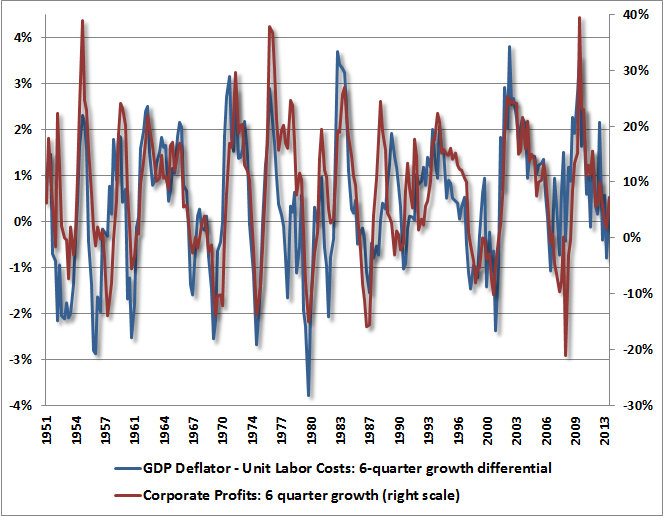
Yet another way to think about corporate profits is presented below. Here, we observe that corporate profits are linked to the difference between output prices and input costs, where the majority of those inputs represent labor. The blue line in the chart below shows the annualized 6-quarter growth of the GDP deflator (an economy-wide price index for output) less the growth of unit labor costs (the amount that must be paid as labor cost in order to produce one unit of output). The red line shows the 6-quarter growth of corporate profits. The relationship here should be clear. Since 2009, and until recently, increases in the GDP deflator over and above unit labor costs were nicely supportive of corporate profit growth. Those growth rates have reversed, with unit labor costs now growing faster than the GDP deflator. This places downward pressure on corporate profits, consistent with what we expect from based on an analysis of profits from other, complementary perspectives.
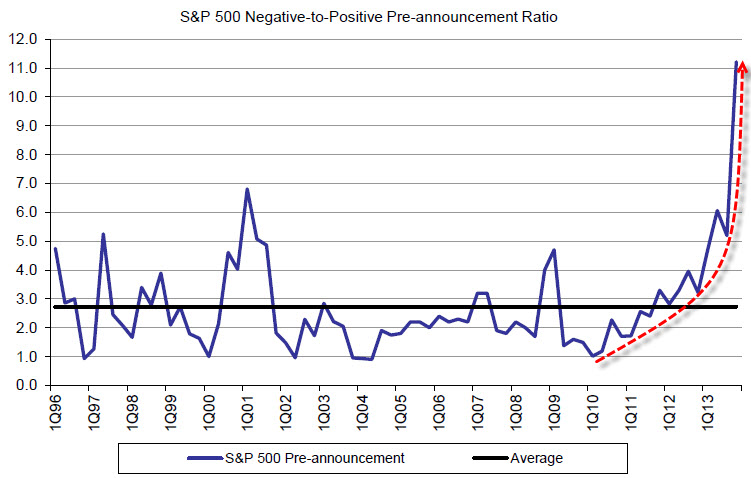
Given this context, it may not be a great surprise that we’re observing an enormous surge of negative earnings pre-announcements from companies that will shortly be reporting earnings for the fourth quarter (chart h/t ZeroHedge). Last week, Thomson-Reuters reported: “The 11.4 negative to positive guidance ratio is the most negative on record by a wide margin.” While the deterioration in the earnings outlook is paced by a surge in the number of negative pre-announcements, the spike in the negative/positive ratio is aggravated by a collapse in the number of positive earnings pre-announcements to a relatively small handful of S&P 500 companies. While we shouldn’t interpret the spike too strongly, it’s difficult to find much encouragement in the imbalance between negative and positive surprises.
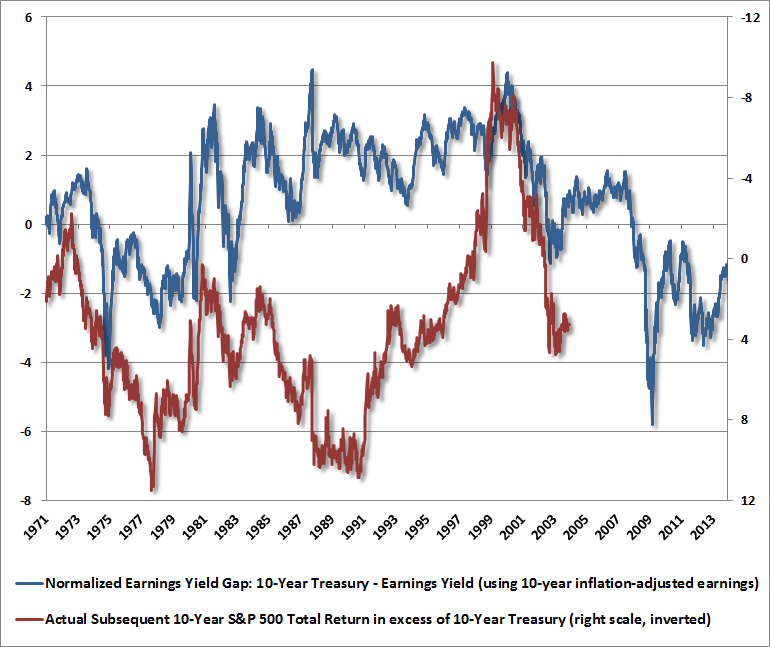
How to evaluate new valuation indicators Keep in mind that the proof of any valuation measure is not simply in its construction, and not simply in its elegance. The proof of any valuation measure is the extent to which it is related to actual subsequent market returns. When the market becomes richly valued, hardly a week goes by – especially at points like 2000, 2007 and today – that someone doesn’t trot out some new “adjusted” valuation measure that proposes to correct for some presumed defect in existing measures (usually by justifying overvalued prices as just fine). I enthusiastically support careful valuation research – provided that the resulting measures are overlaid against actual subsequent total returns. This is almost never done. The rule is simple: with any novel valuation measure, analysts should provide evidence that it is closely correlated with actual subsequent market returns in numerous market cycles across history. We saw an interesting example of this last week, as a Wall Street analyst (whom I disagreed with just as strongly in 2000) trotted out a measure called a “normalized earnings yield gap” – essentially the difference between the Treasury bond yield and the earnings yield of the S&P 500, based on 10-year average earnings. In this construction, high levels are “bad” because Treasuries have a higher yield than stocks, while low levels are “good” because bond yields are low relative to earnings yields. The basic argument was that present levels don’t look bad at all. The problem, if one cared to actually examine the data, is that this measure has a ridiculously poor relationship with actual subsequent returns in the S&P 500 (in excess of Treasury returns). Remember the rule: with any novel valuation measure, analysts should provide evidence that it is closely correlated with actual subsequent returns in numerous market cycles across history. So called “improved” valuation methods with historical records like the one below are useless noise.
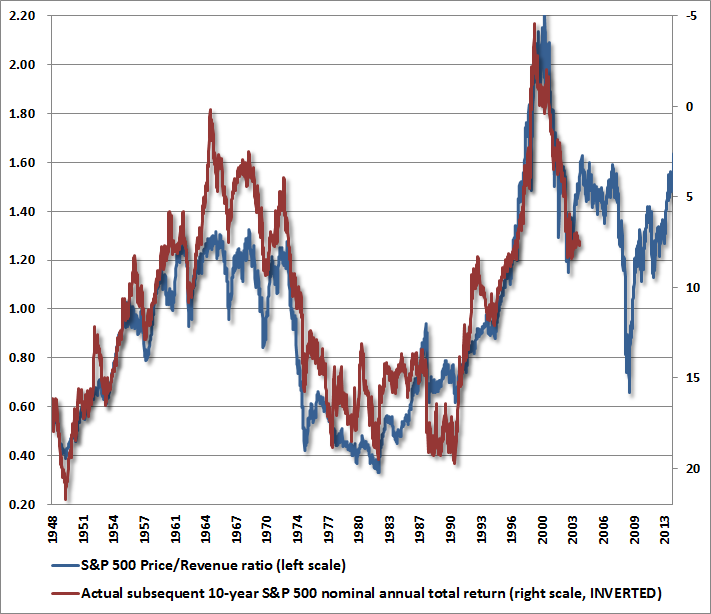
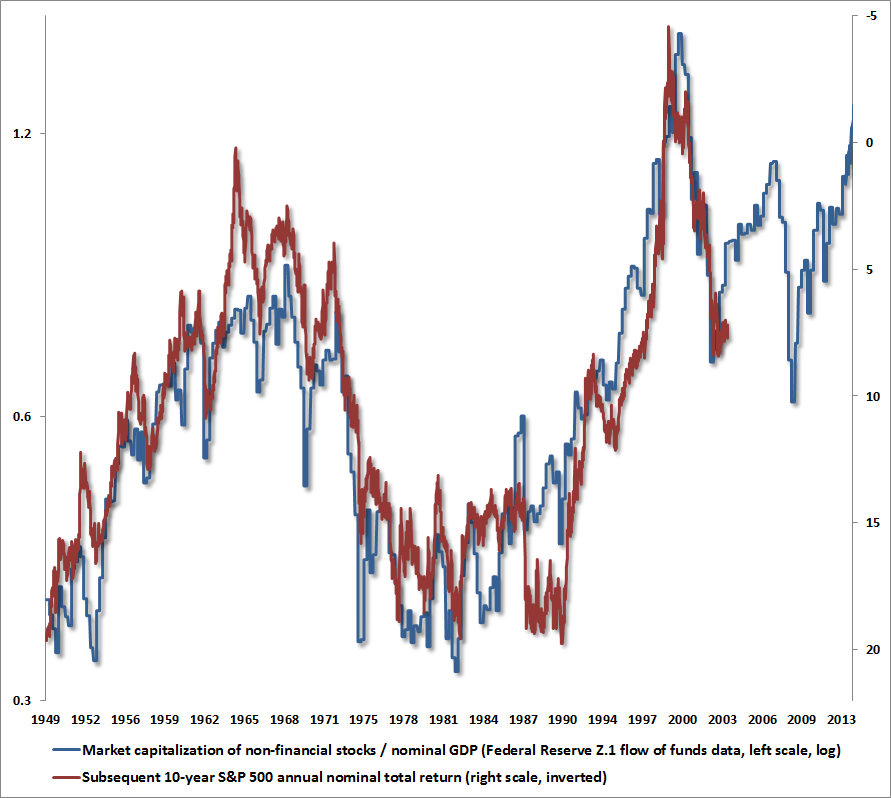
We see the same sort of novelty in a flurry of articles with proposed “adjustments” to other valuation measures that have performed perfectly well up even into the present market cycle. Yes, several reliable valuation measures have hovered at much higher levels since the late-1990’s than were generally seen historically. But that in itself is not evidence that these historically reliable valuation measures are “broken.” It matters that those high valuations have been associated with a period of more than 13 years now where the S&P 500 has scarcely achieved a 3% annual total return. The rule is worth memorizing because it protects against the perennial argument that “the old valuation measures no longer apply” and “this time is different” – heard at every major valuation peak in history. As John Kenneth Galbraith wrote decades ago about the advance to the 1929 peak “It was still necessary to reassure those who required some tie, however tenuous to reality... as in all periods of speculation, men sought not to be persuaded by the reality of things but to find excuses for escaping into the new world of fantasy." The rule: with any novel valuation measure, analysts should provide evidence that it is closely correlated with actual subsequent market returns in numerous market cycles across history. Needless to say, one should also question the ones where data does not exist prior to the most recent cycle, or where no adjustment would have occurred in anything other than the most recent cycle. We saw this a great deal in the late-1990’s tech bubble – it’s a version of “this time is different.” The following charts offer some idea of what reasonably useful valuation metrics should look like against subsequent returns. We’ve got a dozen others just like these, using entirely different fundamental measures. The challenge of any new “adjusted” valuation indicator isn’t just to make investors comfortable with whatever heights the market has scaled, but to demonstrate effectiveness in decades of data. At present, the challenge is also to address the question of why other historically reliable and varied measures – which send exactly the same message at present – are all wrong simultaneously.
Frankly, most debates about valuation methods can be easily settled by the data, but the same arguments emerge at every market top: “It’s different this time. The critics are wrong. Profit margins are fine. Valuations should be higher. And stocks are going up.” It’s a useful reminder that what may have been an unsettled debate on these points in 2007 was quickly followed by a 55% plunge in the stock market, and in 2000 by a 50% plunge. I’ll be the first to agree that the uncompleted half-cycle since the 2009 leaves me open to criticism on some fronts. But it's important to observe that our valuation measures were favorable in late-2008 and 2009 (see Why Warren Buffett is Right and Nobody Cares). Criticize my fiduciary inclination in 2009 to stress-test our approach against Depression-era outcomes, which resulted in a very awkward transition in methods during this half-cycle. Criticize my unwillingness to rest our security on superstitious faith in Fed policy that has no transmission mechanism except to encourage speculative yield-seeking. But don’t ignore the message that reliable valuation measures are screaming here. They haven’t missed a beat. A technical note on valuation multiples and discounting models The first valuation model most finance students learn is the “dividend discount model.” Suppose that a security throws off a dividend every year, growing at rate g forever, and is so long-lived that any “terminal payment” essentially has a present value of zero. In that case, the value of the security works out to D/(k-g) where k is the rate of return demanded by investors. With a $2 dividend, a long-term 10% expected return forever, and a 6% growth rate, you’ll get a $50 “fair value” for the stock price. Indeed, given assumptions about g and k, investors can forget the math. In a nice world like that, the “fair” dividend yield is always 4%. The “fair” price/dividend ratio in that world is always 25. The crucial point here is that a valuation multiple is a shorthand for a proper, fully-specified discounted cash flow model. A seemingly harmless multiple actually embeds all sorts of assumptions about prospective returns, growth rates, and the representativeness of the initial “fundamental.” In the example above, if by chance the company pays a “special dividend” that’s 80% above the norm for a few years, and investors carelessly slap a price/dividend multiple of 25 on that dividend, they’re going to vastly overpay. This is essentially what investors are doing here. What investors think of as a “typical” price/earnings ratio actually embeds numerous assumptions about revenue growth rates, profit margins, dividend payout rates, return on reinvested capital and other matters. Most importantly, it embeds an assumption that this year’s earnings are fully representative of the long-term stream. A note on buybacks – while the infinite dividend discount model is very sensitive to small changes in assumptions in the first place, one variation that should never be made using per-share data is to add stock buybacks as if they are also dividends. Values and fundamentals for the S&P 500 are computed on a “per share” basis that already accounts for buybacks, capturing their effect on both the level and the growth rate of index dividends (which can be demonstrated with straightforward but tedious arithmetic). Buybacks at rich valuations (low k) are harmful, and adding buybacks in a per-share model represents double counting. Moreover, buybacks are often simply a way to reduce the dilution that would otherwise result from grants of shares corporate insiders and employees. The general rule of thumb is that buybacks are beneficial only at valuations where investors would be well-served reinvesting their dividends into a company’s stock on their own behalf. As for dividend discount approaches, they can be very useful when they are properly computed. These approaches supported our concerns at the 2007 peak (see Fair Value – 40% Off). But they are also vulnerable to misuse by analysts who arbitrarily choose k and g to be so close that virtually any price can be justified – the Dow 36,000 argument at the 2000 peak was one spectacular consequence of this misuse. The foregoing comments represent the general investment analysis and economic views of the Advisor, and are provided solely for the purpose of information, instruction and discourse. Only comments in the Fund Notes section relate specifically to the Hussman Funds and the investment positions of the Funds. Fund Notes Strategic Growth Fund remains fully hedged here, with a “staggered strike” position that sets the strike prices of its index put options slightly below present market levels. The Fund continues to carry a position in index call options representing a small fraction of 1% of assets – primarily to cover the uncertainty about Fed policy decisions this week, and the associated contingency a short-term speculative blowoff. Meanwhile, it’s important to recognize that in the absence of significant market movements, most of the day-to-day fluctuation in the Fund here is related to differences in the daily performance of the stocks held by the Fund versus the indices it uses to hedge. Strategic International remains fully hedged. Strategic Dividend Value is hedged at about 50% of the value of its stock holdings. In Strategic Total Return, we increased the duration of the Fund to slightly over 5 years (meaning that a 100 basis point move in interest rates would be expected to impact Fund value by a about 5% on the basis of bond price fluctuations), while clipping our holdings of precious metals shares to slightly under 5%. The Fund also holds a few percent of assets in utility shares. Overall, my view remains that we can expect very little pressure on short-term interest rates in the foreseeable future, and that this is likely to benefit the closest substitute for short-term investments, which is intermediate-term bonds (equity valuations are far more weakly linked to short-term interest rates than investors seem to believe here). With Treasury yields pushing toward 3%, an absence of material inflation pressures, and what we view as low prospects for any change in short-term yields (even in the more likely event of a mild tapering of quantitative easing by the Fed), we expect to modestly increase the Fund’s duration in the event of a further widening of the yield curve between long-term and short-term interest rates. This difference is already well over twice the historical norm. With Thomson-Reuters reporting the largest surge in negative earnings pre-announcements relative to positive pre-announcements in history, the day-to-day performance of our stocks, relative to the indices we use to hedge, is a bit unpredictable. We would expect to lose slightly on days that feature negative pre-announcements in stocks that we hold with greater weight than their representation in the major indices. We would expect to gain slightly on days that feature negative pre-announcements in large-cap stocks that have more weight in the indices than in our portfolios. This kind of small day-to-day variation may have produced some confusion last week, particularly on Wednesday when the S&P 500 dropped and the NAV of Strategic Growth was down a penny while Strategic Dividend Value was flat, despite having greater market exposure than the Strategic Growth Fund. Unfortunately, the heavy ratio of negative to positive earnings pre-announcements about fourth-quarter earnings will create a bit of this “hit-or-miss” behavior on a day-to-day basis. As always, our investment strategy remains focused on the complete market cycle. While Strategic Growth Fund – even at present market extremes – has outperformed the S&P 500 since its inception in 2000, with far smaller interim losses than the market, the uncompleted half-cycle since 2009 has not mirrored the 2000-2008 profile of full-cycle outperformance that I regularly described “as intended – neither extraordinary nor disappointing.” Put simply, my insistence on stress-testing our methods against Depression-era outcomes in 2009 (what I called our “two data sets problem” at the time) resulted in an unintentionally awkward transition to our present methods of estimating prospective market return/risk. Nearly everything I have remains invested in the Hussman Funds, and Strategic Growth Fund is the largest of those holdings. That’s because, despite the miss that largely resulted from my 2009 stress-testing decision, I also understand how both our pre-2009 methods and our present methods have navigated complete market cycles through history, and could have navigated the half-cycle since 2009 - had there been no need to seriously consider Depression-era outcomes or to harden our methods against those risks. My hope is that investors don't mistake that stress-testing miss as a reason to ignore objective valuations and other historically important concerns here. As for our own approach, the caveat that past performance is not indicative of future results cuts both ways, as I believe that the performance of our investment strategy prior to that 2009 stress-testing decision is at least as relevant as the performance during the resulting transition. In any event, having validated our approach against a century of market cycles, including Depression-era data, I view this transition as behind us. Importantly, our defensiveness in the period since about mid-2012 has been unrelated to stress-testing issues. Rather we’ve observed what I see as a persistent and terribly dangerous run of Fed-induced speculation – defying overvalued, overbought, overbullish conditions that have historically produced wicked market losses. One interpretation is that such conditions no longer matter. Another interpretation is that the consequences of these conditions have merely been deferred, and will be worse for the wait. My inclination is to expect the latter, and following a historically-informed discipline, shareholders should recognize that our investment actions will continue to reflect the long-term evidence on this. That’s another way of saying that our discipline is inappropriate for investors who believe that Fed easing is the only investment consideration that matters, and want their investments managed accordingly. Of course, that same belief would have encouraged an aggressive investment position through the bulk of the 2000-2002 and 2007-2009 market plunges, as the Fed was easing persistently in both periods. My impression is that the resulting lesson will have to be learned yet again. --- The foregoing comments represent the general investment analysis and economic views of the Advisor, and are provided solely for the purpose of information, instruction and discourse. Prospectuses for the Hussman Strategic Growth Fund, the Hussman Strategic Total Return Fund, the Hussman Strategic International Fund, and the Hussman Strategic Dividend Value Fund, as well as Fund reports and other information, are available by clicking "The Funds" menu button from any page of this website. |
|||||||||||||||||||||||||
|
For more information about investing in the Hussman Funds, please call us at
1-800-HUSSMAN (1-800-487-7626) 513-326-3551 outside the United States Site and site contents © copyright Hussman Funds. Brief quotations including attribution and a direct link to this site (www.hussmanfunds.com) are authorized. All other rights reserved and actively enforced. Extensive or unattributed reproduction of text or research findings are violations of copyright law. Site design by 1WebsiteDesigners. |