|
|
||||||
|
|

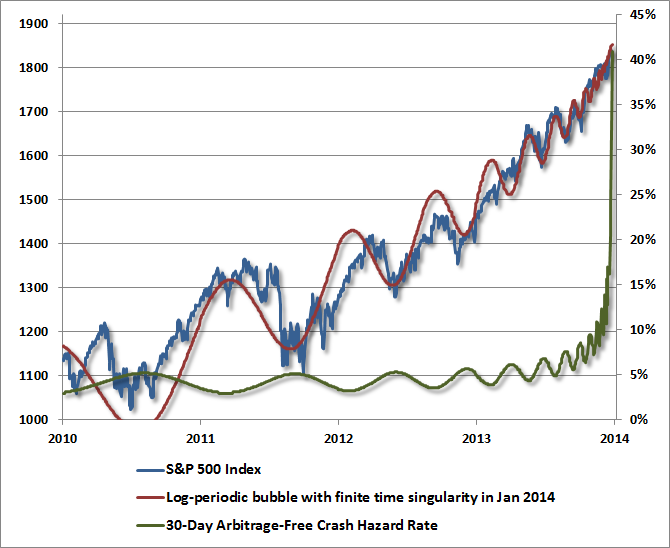
December 30, 2013 Estimating the Risk of a Market Crash “We thought it was the eighth inning, and it was the ninth. I did not think it would go down 33 percent in 15 days.” In April 2000, Stanley Druckenmiller, who managed the phenomenally successful Quantum fund for George Soros, called it quits – saying “I overplayed my hand” in technology stocks. The Nasdaq composite had suffered the first blow of what was to become a much deeper loss, with the index losing an additional 70% by 2002 low. Still, getting out was a good idea in hindsight. With one of the best records in the industry, Druckenmiller has expressed increasing concerns recently that “all the lobsters are in the pot.” A few weeks ago, he said of equities that he holds “the smallest positions I’ve had,” and warned “a necessary condition for a financial crisis, in my opinion, is too loose monetary policy that encourages people to take undue risk.” Floyd Norris of the New York Times reported in 2000 that Druckenmiller was actually the second high-profile hedge manager to call it quits in that cycle. The first was Tiger Fund’s Julian Robertson, who had lagged the advance because he (correctly, in hindsight) viewed technology stocks as vastly overvalued. The article quoted an analyst saying “The moral of the story is that irrational markets can kill you. Julian said ‘This is irrational and I won’t play,’ and they carried him out feet first. Druckenmiller said ‘This is irrational and I will play,’ and they carried him out feet first.” As I noted a few weeks ago “The problem with bubbles is that they force one to decide whether to look like an idiot before the peak, or an idiot after the peak. There’s no calling the top, and most of the signals that have been most historically useful for that purpose have been blazing red since late-2011.” My impression remains that the downside risks for the market have been deferred, not eliminated, and that they will be worse for the wait. For those inclined to understand the unfinished half-cycle since 2009 in its full context, rather than dismissing objective evidence and discipline that have proved valid in complete market cycles throughout history, several prior commentaries may be helpful (see The Diva is Already Singing, The Elephant in the Room, and Aligning Market Exposure with the Expected Return/Risk Profile). This would be a terrible moment to lose that discipline. Estimating the Risk of a Market Crash I want to preface this section by emphasizing that our central investment outlook is driven by none of it. That is, a defensive outlook here does not presume, require, or rely on a market crash. Our ongoing discipline is to align our investment outlook with the market return/risk profile that we estimate on the basis of a broad ensemble of evidence that we can test historically and validate in out-of-sample data. That outlook will shift as that evidence shifts, period. In contrast, what follows is more of an intellectual curiosity – something that we don’t rely on (and neither should you), but that also highlights the fascinating correspondence of market dynamics since about 2010 with the existing literature surrounding market bubbles and crashes. Imagine a game that offers you one of two payoffs. If you choose to play, you’ll get a return of $W with probability p(win) and you’ll lose $L with probability p(lose). What’s your expected return? Simple: Expected return = $W x p(win) + $L x p(lose) For example, if $W is $20, $L is -$10 and p(win) = 60% (so p(lose) is 40%), your expected return is $8. If you’re neutral to risk, you’ll play the game only if the expected return is greater than zero. If you’re risk-averse, you need the expected return to exceed zero by even more. If you’re risk-seeking (which often occurs with small amounts of money like lottery bets), you might even play the game even if the expected return is less than zero, but probably only if the absolute amount of possible loss $L isn’t terribly large. Back in 1979, Harvard economist Olivier Blanchard proposed that financial bubbles could be approached from a “rational expectations” standpoint, where speculators essentially choose whether to exit or continue to speculate for one additional period. If the probability of a loss increases as the bubble proceeds, the result is that toward the end of the bubble, the rate of price advance accelerates, implicitly compensating investors for the smaller probability of continuation (and the increasing expected loss), with a higher immediate reward for holding on for one extra period. This necessity of offsetting the increasing size of the expected loss with an increasing prospect for immediate gain is called a “no arbitrage condition.” As Blanchard and economist Mark Watson observe: “The probability that the bubble ends may well be a function of how long the bubble has lasted, or of how far the price is from market fundamentals. If the probability of a crash increases for example, the price, in the event the crash does not take place, will have to increase faster, not only to compensate for the increased probability of a fall, but also to compensate for the large risk involved in holding the asset.” Olivier Blanchard & Mark Watson, Bubbles, Rational Expectations and Financial Markets, July 1982, National Bureau of Economic Research In effect, if the market is adhering to a “bubble” trajectory, we should not be surprised by a phase of persistent advances toward the end, followed ultimately by a sharp decline that erases a significant amount of prior gains in one fell swoop. This is what I’ve often described as “unpleasant skewness,” and is unpleasant precisely because it has historically emerged in conditions that we identify as “overvalued, overbought, and overbullish.” These conditions are often – at least temporarily – associated with persistent further advances to successive marginal new highs, followed by a steep loss. With regard to present market conditions, the increasingly severe overvalued, overbought, overbullish features of the market here are coupled with soaring margin debt as speculators accumulate stock with borrowed money; record issuance of low-grade “covenant lite” debt; heavy issuance of new stocks – particularly characterized by speculative narratives; and a price trajectory that is eerily well-described by the mathematics of a “log-periodic bubble” that economist Didier Sornette described a decade ago, and has regularly been observed in financial bubbles across asset classes and countries across history. Interestingly, the no-arbitrage condition also gives us the mathematical tool to estimate the “hazard rate” or crash probability over any finite horizon. Our estimate is that this probability is soaring here. [Geek’s Note: Choose any arbitrary crash increment “C” say 25-30% of market value, a finite horizon h (in years), and the non-cyclical trajectory of the log-periodic bubble B (excluding the cosine term). Then p(crash) is the solution to the no-arbitrage condition p(crash)*C + (1-p(crash))*h*dB/dt = 0. The graph below uses a crash increment of 25%. Less extreme crash increments produce higher, not lower, hazard rates].
Sornette described this kind of situation a decade ago in his book Why Stock Markets Crash: “As the price variation speeds up, the no-arbitrage condition, together with rational expectations, then implies that there must be an underlying risk, not yet revealed in the price dynamics, which justifies this apparent free ride and free lunch. The fundamental logic here is that the no-arbitrage condition, together with rational expectations, automatically implies a dramatic increase of a risk looming ahead each time the price appreciates significantly, such as in a speculative frenzy or in a bubble. This is the conclusion that rational traders will reach. This phenomenon can be summarized by the following proverb applied to an accelerating bullish market: ‘It’s too good to be true.’” Examining the prices of S&P 500 futures options during the runup to the 1987 market crash, economist D.S. Bates (Journal of Finance, 1991) observed an increasing “skewness premium” in option prices as the crash approached. Anyone familiar with the Black-Scholes model knows that option prices typically don’t reflect the nice, symmetrical bell-shaped probability distribution that the model assumes. Rather, low-strike options tend to be priced with a little bit more premium than the model would predict, producing a slightly skewed curve that’s known as a “volatility smile” when implied volatility is plotted against strike prices. As long as the probabilities reflected in option prices add up to 100% and produce an expected value equal to the futures contract of the same expiration (ensuring put-call parity), the market can bend the probability distribution all sorts of ways, and it does. Very high "skew" reflects an implied probability distribution with a "fat left tail" - assigning a larger than normal probability to significantly negative outcomes. What’s notable here is that unusually large option skew approaching the 1987 crash suggested that option market participants were implicitly aware of the "too good to be true" nature of the advance, and were compensating by pricing options to better reflect the risk of a steep market drop. What’s equally notable is that the 10-day (exponential) moving average of option skewness hit the highest level in history last week (SKEW on the Bloomberg terminal). Again, I want to be very clear about something – our present concerns about market risk are not driven by the calculations above, and are not dependent on the Shiller P/E or some other factor that might be used reduce our case to a single variable. Emphatically, our defensiveness is driven by an ensemble of evidence relating to valuations, sentiment, market internals, interest rates – yes, monetary factors included – economic factors, profit margins, overbought conditions, record margin debt, and other observable features that classify present market conditions among the most hostile on record. Our view will change as the evidence does. The immediate objection, of course, is that one does not observe an obvious “catalyst” that would warrant a market decline, much less a crash. As I wrote about our defensive stance during the 2000-2002 decline, “Our positions are always built on observable evidence rather than scenarios. We already have sufficient evidence to be fully defensive. Only later will we read in the headlines exactly why this defensive position was warranted.” As I noted again approaching the 2007 market peak, the need to wait for some observable “catalyst” to justify a defensive stance is reminiscent of other awful consequences of overvalued, overbought, overbullish, rising-yield syndromes, including the 1987 crash: “Investors could find no news to explain the crash in that instance, except an unusually large trade gap with Germany, so they continued to fear that particular piece of data. But day-to-day news events rarely ‘cause’ large market movements... Once certain extremes are clear in the data, the main cause of a market plunge is usually the inevitability of a market plunge. That's the reason we sometimes have to maintain defensive positions in the face of seemingly good short-term market behavior.” Sornette described this same regularity a decade ago: “The underlying cause of the crash will be found in the preceding months and years, in the progressively increasing build-up of market cooperativity, or effective interactions between investors, often translated into accelerating ascent of the market price. According to this “critical” point of view, the specific manner by which prices collapsed is not the most important problem: a crash occurs because the market has entered an unstable phase and any small disturbance or process may have triggered the instability. The collapse is fundamentally due to the unstable position; the instantaneous cause of the collapse is secondary. Essentially, anything would work once the system is ripe... a crash has fundamentally endogenous, or internal origin.” My opinion is that present circumstances will not end well, and that a very finite number of speculators will be able to exit with their paper gains successfully. I remember people asking after the 2000-2002 plunge, and again after the 2007-2009 plunge – “Where did all that market value go? Who got it?” The answer is that market value simply vanishes in a decline. A security is nothing more or less than a claim on a stream of cash flows that will be delivered into the hands of investors over time. But the price of a security is simply where the last trade between two people occurred – sometimes pairing a frantic buyer with a reluctant seller, and sometimes pairing a panicked seller with a reluctant buyer. Often, that price is nothing more than a measure of how imbalanced mob psychology has become. My guess is that the present speculative advance may have a few percent to run – I’ll be particularly concerned if the market does so in a rapid, uncorrected manner in the next couple of weeks, which could suggest crash probabilities approaching 100% based on the sort of analysis above. Again, this analysis does not drive our investment stance, which is already defensive based on a broad range of observable and historically-testable evidence. The log-periodic pattern of the S&P 500 since 2010 is more of an experimental curiosity, but it’s certainly an interesting real-time example of bubble dynamics. It will be fascinating to see how this plays out. Wishing you a very Happy New Year. The foregoing comments represent the general investment analysis and economic views of the Advisor, and are provided solely for the purpose of information, instruction and discourse. Only comments in the Fund Notes section relate specifically to the Hussman Funds and the investment positions of the Funds. Fund Notes There was no significant change in our investment stance last week – we remain defensive toward equities, and moderately but not aggressively constructive toward Treasuries and precious metals. As we approach what I expect to be the weaker half of this market cycle, we may observe changes in valuations, market internals, sentiment, economic data, profit margins, and other factors that might provide opportunities to alter our investment stance. At this point, there can be no doubt that we will rigidly follow our investment discipline, but it may be preferable from the perspective of both game-theory and competitive advantage to discuss our investment changes less extensively in real time. --- The foregoing comments represent the general investment analysis and economic views of the Advisor, and are provided solely for the purpose of information, instruction and discourse. Prospectuses for the Hussman Strategic Growth Fund, the Hussman Strategic Total Return Fund, the Hussman Strategic International Fund, and the Hussman Strategic Dividend Value Fund, as well as Fund reports and other information, are available by clicking "The Funds" menu button from any page of this website. |
|||||||||||||||||||||||||
|
For more information about investing in the Hussman Funds, please call us at
1-800-HUSSMAN (1-800-487-7626) 513-326-3551 outside the United States Site and site contents © copyright Hussman Funds. Brief quotations including attribution and a direct link to this site (www.hussmanfunds.com) are authorized. All other rights reserved and actively enforced. Extensive or unattributed reproduction of text or research findings are violations of copyright law. Site design by 1WebsiteDesigners. |