
|
|
||||||
|
|

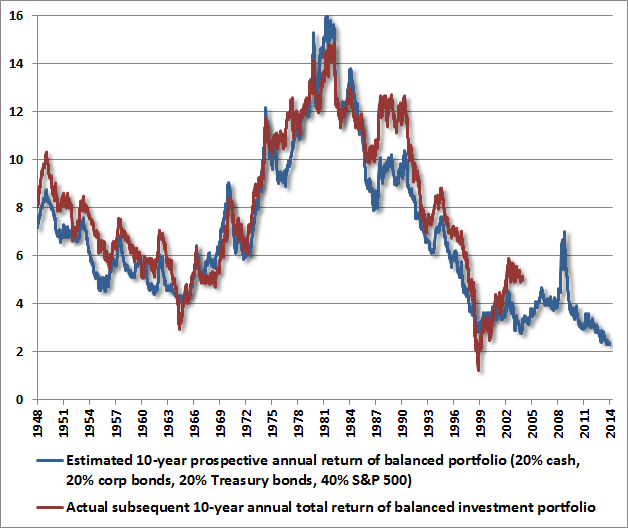
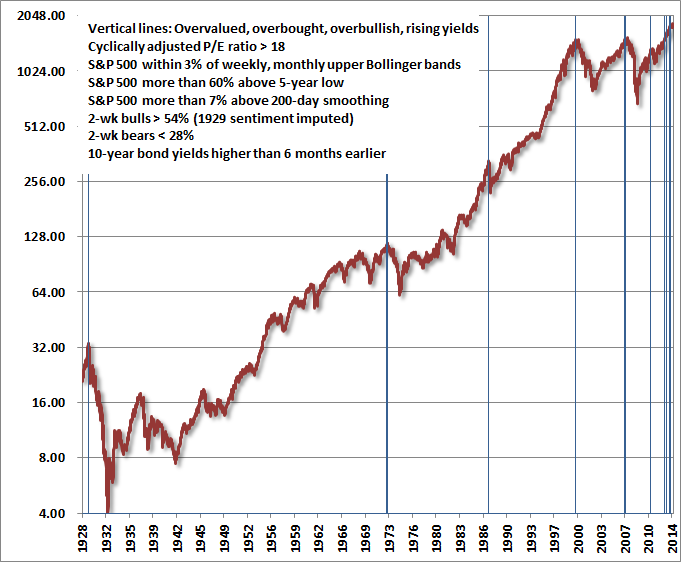
March 24, 2014 Fed-Induced Speculation Does Not Create Wealth In recent years, by starving investors of all sources of safe return, the Federal Reserve has successfully engineered an enormous upward shift in the short-run tolerance of investors to accept risk. Unfortunately, there is no reason to believe that human nature has changed as a result, nor is there reason to believe that the long-run, full-cycle tolerance of investors to accept risk has changed. In the short run – the advancing half of the full cycle – the tolerance for financial risk can be effectively rewarded, regardless of valuation, so long as prices are advancing and valuations are becoming progressively more extreme. These episodes typically end when historically identifiable syndromes of excessive speculation appear (the most extreme version we identify emerged as early as February 2013, and again in May, December, and today). Over the complete market cycle, the tolerance for risk can be rewarded only by the delivery of cash flows that are reasonable in comparison to price paid for the investment, coupled with the absence of significant downward adjustments in valuations over time. The same speculative pressures that have rewarded short-run risk tolerance in recent years have done so only by removing the potential rewards available for maintaining investment positions and risk-tolerance over the longer-run. The arithmetic is simple – the higher the price one pays for a claim to some stream of future cash flows, the lower the long-run return that an investor will achieve. For a review of current valuations and prospective market returns, see the March 10 comment: It is Informed Optimism to Wait For the Rain. Fed-induced speculation does not create wealth. It only changes the profile of returns over time. It redistributes wealth away from investors who are enticed to buy at rich valuations and hold the bag, and redistributes wealth toward the handful of investors both fortunate and wise enough to sell at rich valuations and wait for better opportunities. There won’t be many, because rising prices also encourage overconfidence in a permanent ascent. Few investors are capable of enduring the discomfort of being on the sidelines for very long if a speculative market proceeds further without them. Only those who sell at extreme valuations have the potential to capture any benefit from them, and that benefit only comes by saddling some other investor with poor returns going forward. This is redistribution, not creation of wealth. For those that fail to exit, speculation only changes the profile of returns over time. Excessive reward for short-run risk tolerance goes hand-in-hand with punishment for maintaining that risk tolerance over the longer-run. Over the next few years, the contrast between these short-run rewards and their long-run punishment is likely to be epic. The median stock is more overvalued than at any point in history. Broad market valuations on the most historically reliable measures we identify now exceed the 2007 extreme, and are on parity with 1929. Only the 2000 peak went further. For the vast multitude of investors, repeated bouts of Fed-induced speculation do nothing but to repeatedly create a false hope and then dash it, as investors should have learned from more than 15 years of alternating speculative episodes and subsequent collapses. Despite years of excitement during the tech bubble, leading to the 2000 market peak, the completion of the market cycle left the total return of the S&P 500 no greater than the return from Treasury bills for the entire period from May 1996 to October 2002. Despite years of excitement during the housing bubble, leading to the 2007 peak, the completion of the market cycle left the total return of the S&P 500 no greater than the return from Treasury bills for the entire period from June 1995 to March 2009. Despite years of Fed-induced hope and speculation that has brought the S&P 500 to its recent heights, we easily expect the completion of the present market cycle to leave the total return of the S&P 500 no greater than the return from Treasury bills for the entire period since early 1998, with annual total returns averaging less than 2% over something like an 18-year span of time. It stands repeating that a run-of-the-mill cyclical bear market in a secular bear market period (which clearly began in 2000 and remains incomplete on the basis of nearly every historically reliable valuation measure) comprises a market loss of about 38%. I should emphasize that such a loss over the completion of the present market cycle would not even require valuations to fall to their historical norms. Indeed, while the S&P 500 Index has only advanced about 1% annually since its peak in 2000 (just over 3% annually including dividends), even this return has been achieved only by driving current market valuations, on the most historically reliable measures, approximately 100% above their pre-bubble norms. It’s certainly true that even the most extreme variant of overvalued, overbought, overbullish, rising yield conditions we define – which previously appeared at the 1929, 1972, 1987, 2000, 2007 peaks – has emerged several times in the past year without consequence (February, March and December 2013, and again at present). In my view, the consequences have been deferred, not avoided, by faith in the Fed. Yet even thoughtful voices within the FOMC itself are increasingly concerned about the distortions that monetary policy has created. Fed Governor (and FOMC voting member) Richard Fisher recently observed, “I fear that we are feeding imbalances similar to those that played a role in the run-up to the financial crisis. With its massive asset purchases, the Fed is distorting financial markets and creating incentives for managers and market players to take increasing risk, some of which may result in tears. And all this is happening in uncharted territory. We have aided creation of massive excess bank reserves without a clear plan for how to drain them when the time comes.” Last week, he added that the Fed’s policy of quantitative easing has “overstayed its welcome” and that the Fed has “exhausted the efficacy” of the policy. Likewise, Fed Governor Charles Plosser appeared on CNBC last week saying “A lot of the shocks that we’ve faced, certainly in the United States, have had lasting effects on the economy. We’re not going to close that gap, and to keep thinking we’re going to do that means we overplay our hand in terms of policy. I am very worried about the potential for unintended consequences of all of this action. Expectations of what central banks can do and should do have risen to unhealthy highs.” Plosser added, “We are not the panacea, we are not the silver bullet for all the economic challenges that the world faces. Under many policy rules – and I’m a very big fan of systematic rule-like behavior on the part of monetary policy making – it will not be long before we are no longer bound by the zero bound. That is, these rules will call for higher rates.” As I noted in Restoring the “Virtuous Cycle” of Economic Growth, the economy will be stronger, more productive, and more resilient in the long-run if the financial markets effectively allocate capital toward productive investment rather than repeated bouts of speculation. A retreat in market valuations and a normalization of monetary policy to a less discretionary, more rules-based policy will contribute, not detract, from that outcome. The primary focus of the Fed should be to persistently move closer toward rules-based policy, as well as increasing “macroprudential” oversight – ensuring that potential and in some cases inevitable financial adjustments can occur without too many instances of lax oversight or financial strain. Equity leverage, credit default swaps, exposure to European banks, and speculative exposure to China and Japan should be high on that list. A “Hideous Opportunity Set” Based on valuation methods that have maintained a near-90% correlation with actual subsequent market returns not only historically but also in recent decades, we presently estimate 10-year nominal total returns for the S&P 500 Index averaging just 2.3% annually. It is worth remembering that these same methods indicated the likelihood of 10-year S&P 500 total returns averaging 10-12% annually in late-2008 and early-2009 (our 2009 insistence on stress-testing against Depression-era data was not based on valuation concerns). Moreover, our current estimates of prospective S&P 500 total returns are negative on every horizon shorter than about 7 years. Meanwhile, corporate bond yields and spreads are near record lows, Treasury bill yields are near zero, and the 10-year Treasury bond yield is just over 2.7%. Our friend James Montier at GMO correctly calls this a “hideous opportunity set.” To give an indication of how hideous the opportunity set of both short- and long-horizon investors has become as a result of quantitative easing and Fed-induced speculation, the chart below shows the estimated return of a balanced portfolio that assumes an allocation of 20% in Treasury bills, 20% in corporate bonds, 20% in Treasury bonds, and 40% in the S&P 500. We currently estimate that the prospective 10-year return on such a balanced portfolio is now at the lowest level in history, at just over 2% annually. The process of driving security prices higher and prospective long-term returns lower has been greatly satisfying over the short-run. The future will be a mirror image, as it was following other historic speculative episodes.
In our view, the appropriate response is not to attempt to squeeze water from a stone, but to wait for the rain. This approach requires investors to have a tolerance for portfolio returns that may not track the market should the present speculative episode run further. For investors with no tolerance for tracking risk, there is not much that can be done except to ensure that your portfolio is not more aggressive than your tolerance for loss. Those estimates of potential loss should be based not on the shallow corrections of the uncompleted half-cycle since 2009, but on the experience of 2000-2002 and 2007-2009. Remember also how losses compound, lest investors take shallow market losses as all-out buying opportunities. Once the market lost a relatively manageable 25% of its value in the 2007-2009 decline, it continued to lose another 40% from there, for a 55% compound loss overall. As I’ve often observed, the strongest return/risk profiles emerge when improved valuations are accompanied by an early improvement in market internals. Reminiscences of a misidentified permabear In October 2008, after the market had plunged by more than 40%, our valuation measures indicated a clear shift to undervaluation. The challenge that emerged was not that valuations were rich, but that measures of what we call “early improvement in market action” which were quite reliable in post-war data were whipsawed like mad in the final months of 2008, as they were in the Depression-era. I leave everything I’ve written online – right, wrong, or neutral – and you can see us walk into that challenge in real-time by reviewing my rather constructive October 20, 2008 comment Why Warren Buffett is Right and Why Nobody Cares (note the section on early improvement in market action). It’s quite easy in hindsight to assert that my insistence on stress-testing every aspect of our approach was unnecessary given improved valuations during the crisis. But it’s important to recognize that during the Depression, valuations similar to those of 2008 and 2009 were followed by an additional two-thirds loss of the market’s value. As for whipsaws, the Dow followed the initial 1929 crash by advancing fully 48% between November 13, 1929 and April 17, 1930, and then losing more than 80% of its value from there. In hindsight, what finally ended the credit crisis in 2009 was a stroke of the pen – the March 2009 FASB 157 change that replaced mark-to-market accounting with “significant judgment” – making the risk of widespread bank failures vanish through the magic of erasers and sharpened pencils. Fed interventions and troubled asset purchases did not end the crisis. Though Fed purchases of mortgage securities clearly supported the housing market, the other policies were largely an expensive sideshow. The “miss” that resulted in the interim of our 2009-2010 stress-testing is the real story behind my “permabear” reputation, because I doubt that anyone would think twice or second-guess our concerns about present speculative conditions in the absence of that miss. I sincerely urge investors not to ignore our present concerns on the incorrect belief that these concerns – or even our general investment methods – were responsible for that miss. A century of market history shouts that awful outcomes will unfold over the completion of this now spectacularly uncompleted cycle. In the meantime, while there are certainly historical instances where speculative peaks have collapsed in fairly short order, keep in mind that the typical market peak is not an event but a process. Part of that process is often a deterioration of “uniformity” and a growing tendency toward divergences and non-confirmations across various sectors, securities, and asset classes. For example, each new high in the S&P 500 has been attended by a diminishing number of individual stocks making new highs (this particular metric tends to have a very long lead however). As for non-confirmations, we observe, for example, that the Dow Utilities peaked on April 30, the Nikkei peaked on December 30, the Dow Industrials peaked on December 31, the Dow Euro Stoxx 50 Index peaked on January 15, the German DAX peaked on January 17, the London FTSE peaked on February 24, Russell 2000 peaked on March 4, the Nasdaq 100 peaked on March 5, the NYSE Composite peaked on March 6, the S&P 500 and Dow Transports peaked on March 7. All of these peaks may be breached, of course, but we’ve always noted that a loss of uniformity tends to precede major market declines, and this sort of action is of particular concern in the context of an overvalued, overbought, overbullish, rising-yield syndrome. For more on such considerations, see the July 30, 2007 weekly comment Market Internals Go Negative. That comment also includes a discussion of an interesting technical warning - a double top in the Coppock Guide (sometimes called a “killer wave”) – which we observed at the 2007 peak and see again at present, for the first time since that 2007 instance. The foregoing comments represent the general investment analysis and economic views of the Advisor, and are provided solely for the purpose of information, instruction and discourse. Only comments in the Fund Notes section relate specifically to the Hussman Funds and the investment positions of the Funds. Fund Notes The Hussman Funds maintain a defensive stance toward equities, with a modestly constructive stance toward Treasury securities and precious metals shares. While we view the present investment menu as dismal from the standpoint of prospective returns and risk across nearly every asset class, relative valuations appear generally more favorable in those asset classes having low correlation with the equity market. These classes include Treasury debt and precious metals shares, but even here, our investment stance is certainly not aggressive. Meanwhile, we view corporate and junk debt as profoundly unsuitable here on the basis of prospective return/risk. All of this, fortunately, can change very quickly. Indeed, a confluence of factors, including extreme overvalued, overbought, overbullish conditions, seasonal considerations, and a shift in monetary policy objectives, broadly suggest that the period between now and October may comprise an important adjustment window in the financial markets. In any event, pointed forecasts are unnecessary – we continue to align our investment stance with the average return/risk profile that has historically been associated with observable market conditions at each point in time. Our investment stance will shift as the evidence shifts. Looking forward, we don’t pessimistically view the markets as permanently doomed to extreme valuations and dismal prospective returns across nearly every asset class. Instead, we remain enthusiastic about the prospect for a full range of investment opportunities (moving from our current defensive stance to an unhedged and even aggressive stance in equities and other markets) as market conditions change over the completion of the present market cycle and beyond. Our current defensiveness about the investment opportunity set should not be misinterpreted as gloom, but instead as historically-informed optimism – indeed confidence – about future opportunities.--- The foregoing comments represent the general investment analysis and economic views of the Advisor, and are provided solely for the purpose of information, instruction and discourse. Prospectuses for the Hussman Strategic Growth Fund, the Hussman Strategic Total Return Fund, the Hussman Strategic International Fund, and the Hussman Strategic Dividend Value Fund, as well as Fund reports and other information, are available by clicking "The Funds" menu button from any page of this website. |
|||||||||||||||||||||||||
|
For more information about investing in the Hussman Funds, please call us at
1-800-HUSSMAN (1-800-487-7626) 513-326-3551 outside the United States Site and site contents © copyright Hussman Funds. Brief quotations including attribution and a direct link to this site (www.hussmanfunds.com) are authorized. All other rights reserved and actively enforced. Extensive or unattributed reproduction of text or research findings are violations of copyright law. Site design by 1WebsiteDesigners. |

