|
|
||||||
|
|

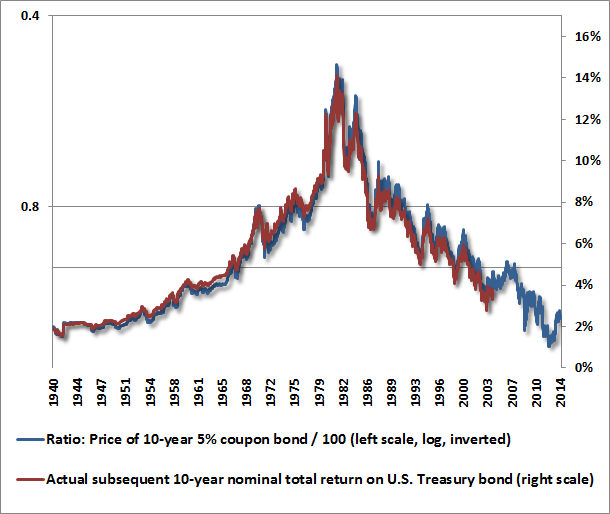
April 14, 2014 Margins, Multiples, and the Iron Law of Valuation The equity market remains valued at nearly double its historical norms on reliable measures of valuation (though numerous unreliable alternatives can be sought if one seeks comfort rather than reliability). The same measures that indicated that the S&P 500 was priced in 2009 to achieve 10-14% annual total returns over the next decade presently indicate estimated 10-year nominal total returns of only about 2.7% annually. That’s up from about 2.3% annually last week, which is about the impact that a 4% market decline would be expected to have on 10-year expected returns. I should note that sentiment remains wildly bullish (55% bulls to 19% bears, record margin debt, heavy IPO issuance, record “covenant lite” debt issuance), and fear as measured by option volatilities is still quite contained, but “tail risk” as measured by option skew remains elevated. In all, the recent pullback is nowhere near the scale that should be considered material. What’s material is the extent of present market overvaluation, and the continuing breakdown in market internals we’re observing. Remember – most market tops are not a moment but a process. Plunges and spikes of several percent in either direction are typically forgettable and irrelevant in the context of the fluctuations that occur over the complete cycle. A corollary to the Iron Law of Valuation is that one can only reliably use a “price/X” multiple to value stocks if “X” is a sufficient statistic for the very long-term stream of cash flows that stocks are likely to deliver into the hands of investors for decades to come. Not just next year, not just 10 years from now, but as long as the security is likely to exist. Now, X doesn’t have to be equal to those long-term cash flows – only proportional to them over time (every constant-growth rate valuation model relies on that quality). If X is a sufficient statistic for the stream of future cash flows, then the price/X ratio becomes informative about future returns. A good way to test a valuation measure is to check whether variations in the price/X multiple are closely related to actual subsequent returns in the security over a horizon of 7-10 years. This is very easy to do for bonds, especially those that are default-free. Given the stream of cash flows that the bond will deliver over time, the future return can be calculated by observing the current price (the only variation from actual returns being the interest rate on reinvested coupon payments). Conversely, the current price can be explicitly calculated for every given yield-to-maturity. Because the stream of payments is fixed, par value (or any other arbitrary constant for that matter) is a sufficient statistic for that stream of cash flows. One can closely approximate future returns knowing nothing more than the following “valuation ratio:” price/100. The chart below illustrates this point.
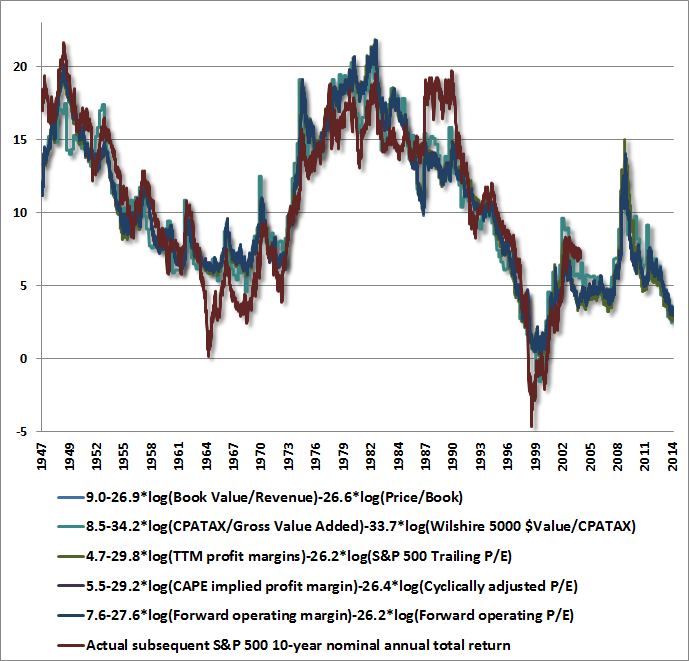
[Geek's Note: the estimate above technically uses logarithms (as doubling the bond price and a halving it are “symmetrical” events). Doing so allows other relevant features of the bond such as the maturity and the coupon rate to be largely captured as a linear relationship between log(price/100) and yield-to-maturity]. Put simply, every security is a claim on some future expected stream of cash flows. For any given set of expected future cash flows, a higher price implies a lower future investment return, and vice versa. Given the price, one can estimate the expected future return that is consistent with that price. Given an expected future return, one can calculate the price that is consistent with that return. A valuation "multiple" like Price/X can be used as a shorthand for more careful and tedious valuation work, but only if X is a sufficient statistic for the long-term stream of future cash flows. Margins and Multiples The Iron Law of Valuation is equally important in the stock market, as is the need for representative measures of future cash flows when investors consider questions about valuation. It’s striking how eager Wall Street analysts become – particularly in already elevated markets – to use current earnings as a sufficient statistic for long-term cash flows. They fall all over themselves to ignore the level of profit margins (which have always reverted in a cyclical fashion over the course of every economic cycle, including the two cycles in the past decade). They fall all over themselves to focus on price/earnings multiples alone, without considering whether those earnings are representative. Yet they seem completely surprised when the market cycle is completed by a bear market that wipes out more than half of the preceding bull market gain (which is the standard, run-of-the-mill outcome). The latest iteration of this effort is the argument that stock market returns are not closely correlated with profit margins, so concerns about margins can be safely ignored. As it happens, it’s true that margins aren’t closely correlated with market returns. But to use this as an argument to ignore profit margins is to demonstrate that one has not thought clearly about the problem of valuation. To see this, suppose that someone tells you that the length of a rectangle is only weakly correlated with the area of a rectangle. A moment’s thought should prompt you to respond, “of course not – you have to know the height as well.” The fact is that length is not a good sufficient statistic, nor is height, but the product of the two is identical to the area in every case. Similarly, suppose someone tells you that the size of a tire is only weakly correlated with the number of molecules of air inside. A moment’s thought should make it clear that this statement is correct, but incomplete. Once you know both the size of the tire and the pressure, you know that the amount of air inside is proportional to the product of the two (Boyle’s Law, and yes, we need to assume constant temperature and an ideal gas). The same principle holds remarkably well for equities. What matters is both the multiple and the margin. Wall Street – You want the truth? You can't handle the truth! The truth is that in the valuation of broad equity market indices, and in the estimation of probable future returns from those indices, revenues are a better sufficient statistic than year-to-year earnings (whether trailing, forward, or cyclically-adjusted). Don’t misunderstand – what ultimately drives the value of stocks is the stream of cash that is actually delivered into the hands of investors over time, and that requires earnings. It’s just that profit margins are so variable over the economic cycle, and so mean-reverting over time, that year-to-year earnings, however defined, are flawed sufficient statistics of the long-term stream of cash flows that determine the value of the stock market at the index level. As an example of the interesting combinations that capture this truth, it can be shown that the 10-year total return of the S&P 500 can be reliably estimated by the log-values of two variables: the S&P 500 price/book ratio and the equity turnover ratio (revenue/book value). Why should these unpopular measures be reliable? Simple. Those two variables – together – capture the valuation metric that's actually relevant: price/revenue. If you hate math, just glide over any equation you see in what follows – it’s helpful to show how things are derived, but it’s not required to understand the key points. price/revenue = (price/book)/(revenue/book) Taking logarithms and rearranging a bit, log(price/revenue) = log(price/book) + log(book/revenue) If price/revenue is the relevant explanatory variable, we should find that in an unconstrained regression of S&P 500 returns on log(price/book) and log(book/revenue), the two explanatory variables will be assigned nearly the same regression coefficients, indicating that they can be joined without a loss of information. That, in fact, is exactly what we observe. Similarly, when we look at trailing 12-month (TTM) earnings, the TTM profit margin and P/E ratio of the S&P 500 are all over the map. When profit margins contract, P/E ratios often soar. When profit margins widen, P/E ratios are suppressed. All of this introduces a terrible amount of useless noise in these indicators. As a result, TTM margins and P/E ratios are notoriously unreliable individually in explaining subsequent market returns. But use them together, and the estimated S&P 500 return has a 90% correlation with actual 10-year returns. Moreover, the two variables – again – come in with nearly identical regression coefficients. Why? Because they can be joined without a loss of information, that is, the individual components contain no additional predictive information on their own. Just like the area of a rectangle and Boyle’s Law: price/revenue = (earnings/revenue)*(price/earnings) Again taking logarithms log(price/revenue) = log(profit margin) + log(P/E ratio) The chart below shows this general result across a variety of fundamentals. In each case, the fitted regression values have a greater than 90% correlation with actual subsequent 10-year S&P 500 total returns. Let’s be clear here – I’m not a great fan of this sort of regression, strongly preferring models that have structure and explicit calculations (see for example the models presented in It is Informed Optimism to Wait for the Rain). The point is that one can’t cry that “profit margins aren’t correlated with subsequent returns” without thinking about the nature of the problem being addressed. The question is whether P/E multiples, or the Shiller cyclically-adjusted P/E, or the forward operating P/E, or price/book value, or market capitalization/corporate earnings, or a host of other possibilities can be used as sufficient statistics for stock market valuation. The answer is no. What we find is that both margins and multiples matter, and they matter with nearly the same regression coefficients – all of which imply that revenue is a better sufficient statistic of the long-term stream of future index-level cash flows than a host of widely-followed measures. Emphatically, one should not use unadjusted valuation multiples without examining the relationship between the underlying fundamental and revenues. That is why we care so much about record profit margins here. Note that in each of these regressions, the coefficients could place a low weight on profit margins and other measures that are connected with revenues, if doing so would improve the fit. They could place significantly different coefficients on margins and multiples, if doing so would improve the fit. They just don’t, and like the area of a rectangle and Boyle’s Law, this tells you that it is the product of the two measures that drives the relationship with subsequent market returns.
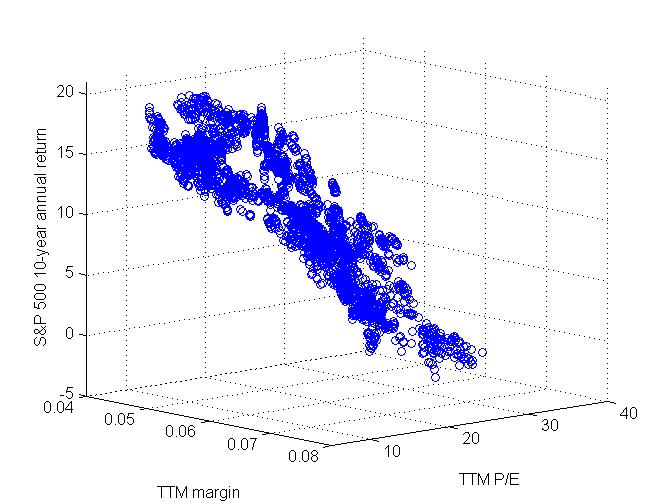
To illustrate these relationships visually, the 3-D scatterplot below shows the TTM profit margin of the S&P 500 along one bottom axis, the TTM price/earnings ratio on the other bottom axis, and the actual subsequent 10-year annual total return of the S&P 500 on the vertical axis. This tornado of points is not distributed all over the map. Instead, you’ll notice that the worst market returns are associated with points having two simultaneous features: not only above-average profit margins, but elevated price/earnings multiples as well. This combination is wicked, because it means that investors are paying a premium price per dollar of earnings, where the earnings themselves are cyclically-elevated and unrepresentative of long-term cash flows. This is the situation we observe at present. It bears repeating that the S&P 500 price/revenue multiple, the ratio of market capitalization to GDP, and margin-adjusted forward P/E and cyclically-adjusted P/E ratios remain more than double their pre-bubble historical norms.
[Geek’s Note: On a 3-D chart where the Z variable is determined by the sum or product of X and Y, a quick way to visually identify the relationship is to view the scatter from either {min(X},max(Y)} or {max(X),min(Y)} as above]. The foregoing comments represent the general investment analysis and economic views of the Advisor, and are provided solely for the purpose of information, instruction and discourse. Only comments in the Fund Notes section relate specifically to the Hussman Funds and the investment positions of the Funds. Fund Notes The Hussman Funds remain defensively positioned in equities, with moderately constructive stances toward Treasury debt and precious metals shares. We don’t view the present environment as one that presents adequate investment merit from the standpoint of estimated future returns. Meanwhile, we continue to observe deterioration in market internals across individual securities, sectors, and investment classes, suggesting a shift in investor risk preferences, following a period of severely overextended speculative enthusiasm. Given the absence, on our measures, of both investment merit and speculative merit for risk-taking, our view remains rather hard-defensive. The largest exception at the moment is in the Treasury markets, precisely because they appear to be the most likely beneficiary of a flight-to-safety. Even here, with yields relatively depressed already, our exposure to Treasuries is not aggressive. We continue to maintain a historically-informed patience and optimism for investment opportunities that we expect to emerge over the completion of the present market cycle. Again, I should strongly emphasize that the belief that we hold a “permabear” view toward market risk is an artifact of our 2009-early 2010 stress-testing and the awkward transition that followed (primarily the need to introduce certain “overlays” that encourage constructive positions in some situations when our return/risk estimates are negative but market action remains favorable). Investors should not be dismayed later in this cycle if we remove most or all of our hedges in response to improved valuations and early improvement in our measures of market action (as we did in early 2003 after the 2000-2002 market plunge). Those who would be dismayed by such a shift, in the belief that we had changed our investment approach, are strongly encouraged to review our reports and Prospectuses. We’re not close to such a shift at present, but a material retreat in market valuations could change that situation. It should be clear from all of our valuation work over recent years that our valuation estimates were constructive in 2009. The problem was not valuation, but the fact that similar valuations in the Depression were followed by a further two-thirds decline in the market, and measures of market action that were quite useful in post-war data were relentlessly whipsawed in Depression-era data. Until the “two data sets” challenge was addressed – ensuring that our methods were robust to both Depression-era and post-war data – it was unclear which state-of-the-world was relevant. Having addressed that challenge and related “overlay” issues, I don’t expect a similar need in the future. Keep in mind that the period since 2009 represents the uncompleted half-cycle of what we fully expect to become a completed whole. We continue to patiently adhere to a historically-informed discipline, and remain optimistic about the prospect for strong investment opportunities over the completion of this cycle. --- The foregoing comments represent the general investment analysis and economic views of the Advisor, and are provided solely for the purpose of information, instruction and discourse. Prospectuses for the Hussman Strategic Growth Fund, the Hussman Strategic Total Return Fund, the Hussman Strategic International Fund, and the Hussman Strategic Dividend Value Fund, as well as Fund reports and other information, are available by clicking "The Funds" menu button from any page of this website. |
|||||||||||||||||||||||||
|
For more information about investing in the Hussman Funds, please call us at
1-800-HUSSMAN (1-800-487-7626) 513-326-3551 outside the United States Site and site contents © copyright Hussman Funds. Brief quotations including attribution and a direct link to this site (www.hussmanfunds.com) are authorized. All other rights reserved and actively enforced. Extensive or unattributed reproduction of text or research findings are violations of copyright law. Site design by 1WebsiteDesigners. |