|
|
||||||
|
|

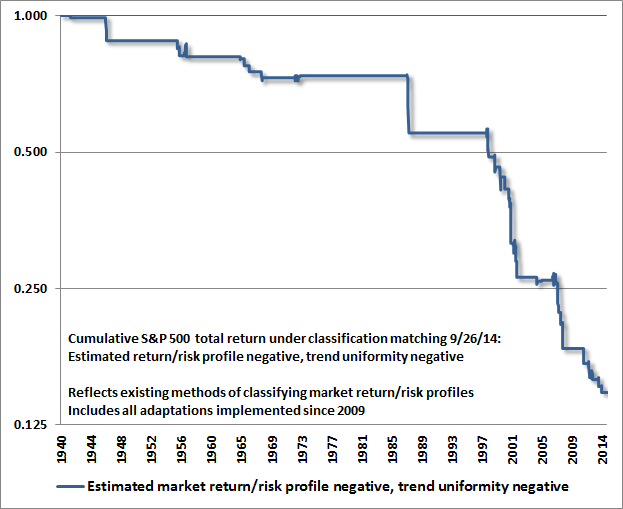
September 29, 2014 The Ingredients of a Market Crash “The information contained in earnings, balance sheets and economic releases is only a fraction of what is known by others. The action of prices and trading volume reveals other important information that traders are willing to back with real money. This is why trend uniformity is so crucial to our Market Climate approach. Historically, when trend uniformity has been positive, stocks have generally ignored overvaluation, no matter how extreme. When the market loses that uniformity, valuations often matter suddenly and with a vengeance. This is a lesson best learned before a crash rather than after one. Valuations, trend uniformity, and yield pressures are now uniformly unfavorable, and the market faces extreme risk in this environment.” Hussman Investment Research and Insight, October 3, 2000 “One of the best indications of the speculative willingness of investors is the ‘uniformity’ of positive market action across a broad range of internals. Probably the most important aspect of last week's decline was the decisive negative shift in these measures. Since early October of last year, I have at least generally been able to say in these weekly comments that ‘market action is favorable on the basis of price trends and other market internals.’ Now, it also happens that once the market reaches overvalued, overbought and overbullish conditions, stocks have historically lagged Treasury bills, on average, even when those internals have been positive (a fact which kept us hedged). Still, the favorable market internals did tell us that investors were still willing to speculate, however abruptly that willingness might end. Evidently, it just ended, and the reversal is broad-based.” Market Internals Go Negative, Hussman Weekly Market Comment, July 30, 2007 “The worst market return/risk profiles we estimate are associated with an early deterioration in market internals following severely overvalued, overbought, overbullish conditions. This is what we observe at present. In contrast, the strongest market return/risk profiles we estimate are associated with a material retreat in valuations coupled with early improvement in market internals. I have every expectation that we will observe this combination over the completion of the present market cycle. So I expect that, perhaps to the surprise of many who don’t understand this approach, we will be quite bullish and aggressively invested as market conditions shift over the completion of the present market cycle. But now is emphatically not that time.” A Hint of Advance Warning, Hussman Weekly Market Comment, August 4, 2014 The most hostile subset of market conditions we identify couples overvalued, overbought, overbullish extremes with a breakdown in market action: deterioration of breadth, leadership and other market internals, along with a shift toward greater dispersion and weakening price cointegration across individual stocks, sectors and security types (what we sometimes call “trend uniformity”). The outcomes are particularly negative, on average, when that shift is joined by a widening of credit spreads. That’s a shift we observed in October 2000. It’s a shift we observed in July 2007. It’s a shift that we observe today. Remember that severe market losses are not by their nature broadly announced by obvious catalysts. As I noted approaching the 2007 peak: “Once certain extremes are clear in the data, the main cause of a market plunge is usually the inevitability of a market plunge. That's the reason we sometimes have to maintain defensive positions in the face of seemingly good short-term market behavior.” Asking what particular news event will trigger a market loss “is like having an open can of gasoline next to your fireplace and blaming the particular spark that sets it off. We need not investigate the personality, life history or future career path of that particular spark.” Present market conditions comprise an environment where risk-premiums are thin and are being pressed higher. See Low and Expanding Risk Premiums are the Root of Abrupt Market Losses for more on why this matters. The current shift does not ensure that the market will decline over the short-term, nor that it will crash in this instance. It’s also worth noting that we don’t rely on a crash, and that we can certainly allow for the possibility that valuations and market internals will improve in a way that reduces or relieves our concerns without severe market losses. Still, what we are concerned about here and now is the steeply negative average behavior of the market in historical periods that match present conditions, as well as the decided skew of that probability distribution, which features extreme negative observations far more often than would be expected under a “normal” bell-shaped distribution. Interestingly, the 3-day average implied skew embedded in S&P 500 index option prices surged last week to the highest level on record. The potential for a “fat-tail” event should be taken seriously here. Why take the concerns of a “permabear” seriously? The inclination to ignore these concerns is understandable based on the fact that I’ve proved fallible in the half-cycle advance since 2009. That’s fine – my objective isn’t to convert anyone to our own investment discipline or encourage them to abandon their own. Somebody will have to hold equities through the completion of this cycle, and it’s best to include those who have thoughtfully chosen to accept the historical risks of a passive investment strategy, and those who have at least evaluated our concerns and dismissed them. The reality is that my reputation as a “permabear” is entirely an artifact of two specific elements since the 2009 low, but that miscasting may not become completely clear until we observe a material retreat in valuations coupled with an early improvement in market internals. For those who understand and appreciate our work, I discuss these two elements frequently because a) I think it’s important to be open about those challenges and to detail how we’ve addressed them, and b) it’s becoming urgent to clarify why we view present conditions as extraordinarily hostile, and to distinguish these conditions from others that – despite an increasingly overvalued market – our current methods would have embraced or at least tolerated more than we demonstrated in real-time. For us, the half-cycle since 2009 has involved the resolution of two challenges. The first: despite anticipating the 2007-2009 collapse, the timing of my decision to stress-test our methods against Depression-era data – and to make our methods robust to those outcomes – could hardly have been worse. In the interim of that “two data sets” uncertainty, we missed what in hindsight was the best opportunity in this cycle to respond to a material retreat in valuations coupled with early improvement in market internals (a constructive opportunity that we eagerly embraced in prior market cycles, and attempted to embrace in late-2008 after a 40% market plunge). The second: I underestimated the extent to which yield-seeking speculation in response to quantitative easing would so persistently defer a key historical regularity: that extreme overvalued, overbought, overbullish market conditions typically end with tragic market losses. Those extremes have now been stretched, uncorrected, for the longest span in history, including the late-1990’s bubble advance. My impression is that the completion of the present market cycle will only be worse as a result. The ensemble approach we introduced in 2010 resolved our “two-data sets” challenge, and was more effective in classifying market return/risk profiles than the methods that gave us a nice reputation by 2009, but our value-conscious focus gave us a tendency to exit overvalued bubble periods too early. During the late-1990’s, observing that stock prices were persistently advancing despite historically overvalued conditions, we introduced a set of “overlays” that restricted our defensive response to overvalued conditions, provided that certain observable supports were present. These generally related to an aspect of market action that I called trend uniformity. In the speculative advance of recent years, we ultimately re-introduced variants of those overlays to our present ensemble approach. As I observed in June, the adaptations we’ve made in recent years have addressed both of these challenges. See the section “Lessons from the Recent Half-Cycle” in Formula for Market Extremes to understand the nature of these adaptations. When we examine the cumulative progress of the stock market in periods we classify as having flat or negative return/risk profiles (and that also survive the overlays), the chart looks like the bumpy downward slope of a mountain. Present conditions are worse, because they feature both a negative estimated return/risk profile and negative trend uniformity on our measures. The cumulative progress of the stock market under these conditions – representing less than 5% of history – looks like the stairway to hell, and captures periods of negative market returns even during the bull market period since 2009. The chart below shows cumulative S&P 500 total returns (log scale) restricted to this subset of history. The flat sideways sections are periods where other return/risk classifications were in effect than what we observe today.
Though we’ve validated our present methods of classifying market return/risk profiles in both post-war and Depression-era data, in “holdout” validation data, and even in data since 2009, there’s no assurance they’ll be effective in the current or future instances. As value-conscious, historically-informed investors, we remain convinced that the lessons of history are still relevant. Our efforts have centered on embodying those lessons in our discipline. While all of these considerations are incorporated into our approach, we’ve had little opportunity to demonstrate the impact we expect over the course of the market cycle. Applied to a century of historical market evidence, including data from the present market cycle, we’re convinced that the adaptations we’ve made have addressed what we needed to address. Our concerns at present mirror those that we expressed at the 2000 and 2007 peaks, as we again observe an overvalued, overbought, overbullish extreme that is now coupled with a clear deterioration in market internals, a widening of credit spreads, and a breakdown in our measures of trend uniformity. These negative conditions survive every restriction that we’ve implemented in recent years that might have reduced our defensiveness at various points in this cycle. My sense is that a great many speculators are simultaneously imagining some clear exit signal, or the ability to act on some “tight stop” now that the primary psychological driver of speculation – Federal Reserve expansion of quantitative easing – is coming to a close. Recall 1929, 1937, 1973, 1987, 2001, and 2008. History teaches that the market doesn’t offer executable opportunities for an entire speculative crowd to exit with paper profits intact. Hence what we call the Exit Rule for Bubbles: you only get out if you panic before everyone else does. Meanwhile, with European Central Bank assets no greater than they were in 2008, and more fiscally stable European countries quite unwilling to finance the deficits of unstable ones, the ECB has far more barriers to sustained large-scale action than Draghi’s words reveal. Moreover, to the extent that the ECB intends to buy asset-backed securities (ABS), which have a relatively small market in Europe, the primary effect (much like the mortgage bubble in the U.S.) will be to encourage the creation of very complex, financially engineered, and ultimately really junky ABS securities that can be foisted on the public balance sheet. Watch. In any event, even if such monetary interventions continue indefinitely, I have no doubt that we’ll have the opportunity to respond more constructively at points where we don’t observe upward pressure on risk-premiums and extensive deterioration in market internals. I should be clear that market peaks often go through several months of top formation, so the near-term remains uncertain. Still, it has become urgent for investors to carefully examine all risk exposures. When extreme valuations on historically reliable measures, lopsided bullishness, and compressed risk premiums are joined by deteriorating market internals, widening credit spreads, and a breakdown in trend uniformity, it’s advisable to make certain that the long position you have is the long position you want over the remainder of the market cycle. As conditions stand, we currently observe the ingredients of a market crash. The foregoing comments represent the general investment analysis and economic views of the Advisor, and are provided solely for the purpose of information, instruction and discourse. Only comments in the Fund Notes section relate specifically to the Hussman Funds and the investment positions of the Funds. Fund Notes The Hussman Funds remain defensive toward stocks, and modestly constructive toward Treasury bonds and precious metals shares. In Strategic Growth Fund, the recent decline has brought the major indices close to the strike prices of the long index put option side of our hedges. Though those put options only represent a couple of percent of portfolio value (and could lose that amount if the market was to advance between now and their late-year expirations if we were to hold them throughout such an advance), they are also likely to change significantly in value if the market declines significantly through those strike prices. At that point, we would expect a good amount of “give-and-take” depending on whether the market advances or declines on a given day. In other words, in the event of a significant market loss from here, these positions will tend to account a significant proportion of day-to-day changes in net asset value. --- The foregoing comments represent the general investment analysis and economic views of the Advisor, and are provided solely for the purpose of information, instruction and discourse. Prospectuses for the Hussman Strategic Growth Fund, the Hussman Strategic Total Return Fund, the Hussman Strategic International Fund, and the Hussman Strategic Dividend Value Fund, as well as Fund reports and other information, are available by clicking "The Funds" menu button from any page of this website. |
|||||||||||||||||||||||||
|
For more information about investing in the Hussman Funds, please call us at
1-800-HUSSMAN (1-800-487-7626) 513-326-3551 outside the United States Site and site contents © copyright Hussman Funds. Brief quotations including attribution and a direct link to this site (www.hussmanfunds.com) are authorized. All other rights reserved and actively enforced. Extensive or unattributed reproduction of text or research findings are violations of copyright law. Site design by 1WebsiteDesigners. |