|
|
||||||
|
|

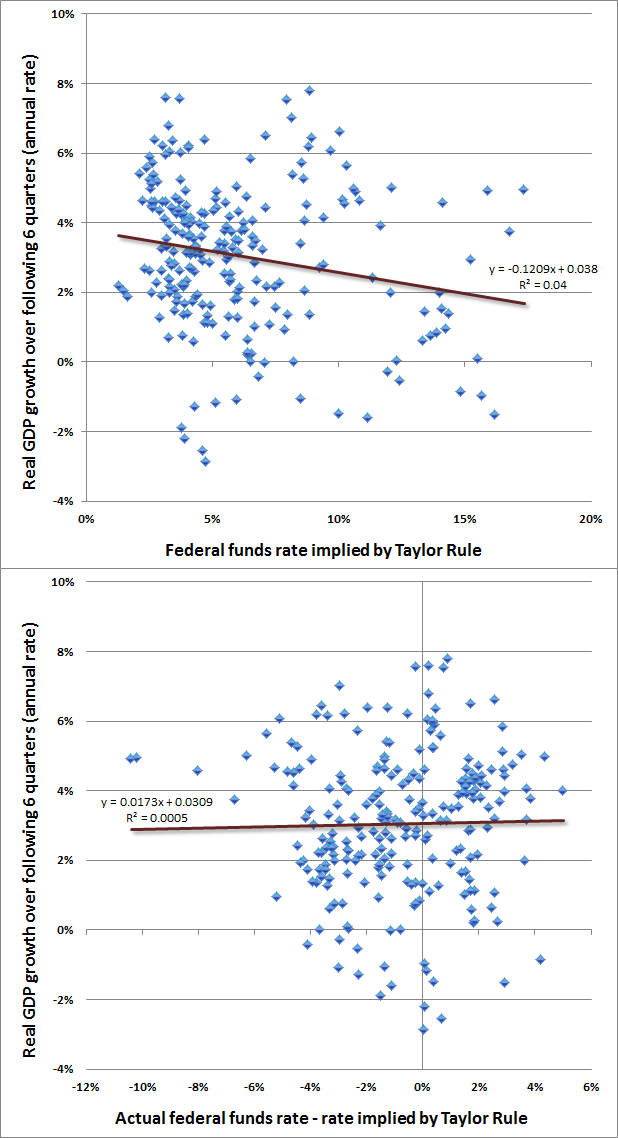
September 14, 2015 The Beauty of Truth and the Beast of Dogma Psychologist Daniel Kahneman won the Nobel Prize in economics in 2002 for his work on decision making. While I've discussed some of this work previously, Kahneman's insights seem particularly useful in thinking about the economy and financial markets here. The key issue is how investors, central bankers, journalists and policy makers should go about evaluating "evidence" in making judgments. In his book, Thinking, Fast and Slow, Kahneman suggested that people normally form judgments by defaulting to a rapid, associative sort of intuitive thinking that immediately gets to work with whatever information it is given. Only when that "System 1" runs into trouble do we call on the slower, effortful System 2 to gather evidence and go through orderly, detailed processing and analysis. System 1 is fast and associative, but it’s also “radically insensitive to both the quality and the quantity of information that gives rise to impressions and intuition... It is the consistency of the information that matters for a good story, not its completeness.” System 1 is a machine for jumping to conclusions. Kahneman writes “Consider the following: ‘Will Mindik be a good leader? She is intelligent, and strong...’ An answer quickly came to your mind, and it was yes. You picked the best answer based on the very limited information available, but you jumped the gun. What if the next two adjectives were corrupt and cruel?” Show someone operating on System 1 a Phillips Curve or an IS-LM model copied out of an economics textbook, and System 1 will immediately go to work spitting out policy recommendations. System 1 doesn’t bother to carefully evaluate the effect sizes of various policy choices in real-world data, and doesn’t even reach for the most basic scatterplot in order to discover how unreliable many of those textbook relationships actually are. The slower, analytical System 2 requires effort, but it’s lazy. As a result, when we’re called on to form a judgment that ought to send us to the data, we tend to substitute the real question with another that can be answered by System 1. “Julie is a senior in a state university. She read fluently when she was four years old. What is her grade point average (GPA)?” Kahneman observes that people tend to come up with a number in the vicinity of 3.7 or 3.8 on a 4 point scale: “How does this occur? Several operations of System 1 are involved. A causal link between the evidence (Julie’s reading) and the target of the prediction (GPA) is sought. Your associative memory quickly and automatically constructs the best possible story from the information available. Next, the evidence is evaluated in relation to a relevant norm. How precocious is a child who reads fluently at age four? The next step involves substitution and intensity matching. The evaluation of the flimsy evidence of cognitive ability in childhood is substituted as an answer to the question about her college GPA. Julie will be assigned the same percentile score for her GPA and for her achievements as an early reader... Intensity matching yields predictions that are as extreme as the evidence on which they are based, leading people to give the same answer to two quite different questions: What is Julie’s percentile score on reading precocity? What is Julie’s percentile score on GPA?” The way to avoid systematic error and form better predictions, Kahneman observes, is to temper your intuition by considering the actual correlation between the data you are given and what you are trying to predict. Intensity-matching leads to exaggerated forecasts that are as extreme as the evidence that's been provided. But if there's only a 30% correlation between reading precocity and GPA, you should only move 30% of the way from the average GPA toward your intuitive guess.* That one step - taking a moment to consider the actual correlation between the data you're given and the object you're trying to predict - is what wakes up System 2. This might seem obvious, except that people don’t seem to actually do it in practice. * Geek's Note - if GPA and reading precocity are both measured as standard deviations from their own averages, this process actually results in the ordinary least squares estimate, since correlation equals the OLS beta in that case. Monetary policy – correlation and effect sizes matter Consider the following question. The GDP of Bumdibai has been growing at 2% annually. Its central bank has just slashed short term interest rates from 3% to zero. How much do you think GDP growth in Bumdibai will be over the next 2 years? If you answered something like 5% or 6%, you’ve most likely answered the question “how extreme is a zero interest rate policy?” and then used that same intensity to answer the question “how fast will GDP grow?” System 1 produces systematic errors because it is utterly unconcerned with the quality of the evidence – the actual correlation between policy interest rates and subsequent GDP growth. It simply matches intensity one-for-one. Based on the actual relationship between central bank policy rates and actual subsequent GDP growth, your answer for GDP growth should have been less than 2.5%. Why? Because as detailed below, the correlation between central bank policy rates and subsequent GDP growth is next to nothing. Even the weak correlation between monetary variables and subsequent GDP growth appears to be incidental. See, when we examine actual economic data across history, what we find is this. GDP growth is slightly mean-reverting, meaning that very slow GDP growth is generally associated with somewhat higher GDP growth two years later, and vice versa. High unemployment rates and low inflation rates are also followed by slightly above-average GDP growth two years later. As a result, if I begin waving a green flag every time that GDP growth is low, unemployment is high, and inflation is low, and a red flag every time that GDP growth is high, unemployment is low and inflation is high, my flag waving will help to predict actual subsequent GDP growth even if it has no causal relationship with GDP at all. People will cheer when the green flag goes up, because at least somewhat higher GDP growth will tend to follow. To a large extent, Federal Reserve policy is indistinguishable from flag-waving. A few months ago, I showed that adding monetary variables such as the Fed funds rate and monetary base growth does not meaningfully improve GDP forecasts beyond what would have been projected using purely non-monetary variables. Instead, monetary variables are largely predicted by past values of non-monetary variables (such as GDP, employment and inflation). Even if we give monetary policy the benefit of the doubt, and assume that the systematic response of monetary policy to past economic fluctuations is actually necessary to produce the slight mean-reverting “stabilization” that follows, we still find that deviations of actual monetary variables from their predicted values have no relationship with subsequent economic activity. A simple way to illustrate this is to examine what’s known as the “Taylor Rule,” which suggests a lower target for the Federal funds rate when GDP and inflation are depressed, and a higher target rate when GDP and inflation are elevated. We can think of the actual Federal funds rate as having two pieces: a “rules based” component like the Taylor rule, plus an “activist” component that measures the extent to which the actual Fed funds rate deviates from the rule. The chart below shows the relationship of each of these components to actual, subsequent GDP growth over the following 6 quarters (long enough for monetary policy to have some amount of impact). Notice that both relationships are super-weak, but at least the Taylor Rule component has the right slope, with lower rates associated with higher growth. The problem is that this slope is still only about -0.12, which means that every 1% cut in the target Fed Funds rate is associated with just 0.12% higher subsequent GDP growth, and even that impact is enormously unreliable and swamped by random noise. We observe the same ineffective response in international data. So when Bumdibai cuts its interest rate from 3% to zero, you might expect, at best, an unreliable bump to GDP growth of about 0.36%, and then only provided that the cut is encouraged by a Taylor Rule type response to the data. If it’s simply an activist policy move, you shouldn’t expect any benefit at all. Rather, you should expect a yield-seeking speculative bubble followed by a brutal, breathtaking bust in Bumdibai.
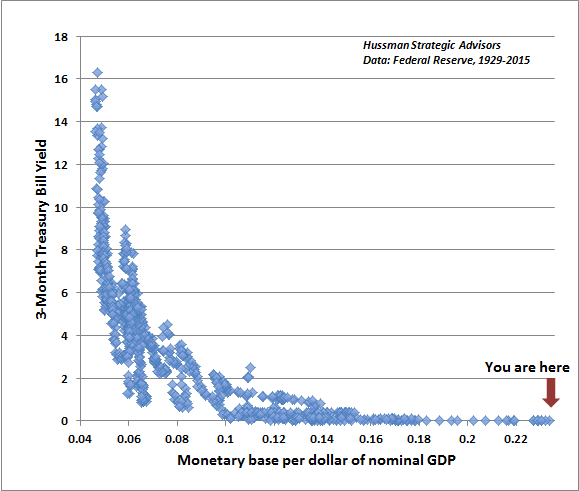
For more evidence on the futility of activist monetary policy, as well as the intensity-matching fallacy, see Extremes in Every Pendulum. The beauty of truth, and the beast of dogma Other “relationships” that are used to justify activist monetary policy have similarly weak support when one actually takes the effort to examine the data. You’ll find a similar shotgun scatter of uncorrelated points if you plot unemployment versus general price inflation, for example. It’s unfortunate that the Federal Reserve is actually allowed and even encouraged to impose massive distortions on the U.S. economy based on relationships that are indistinguishable from someone sneezing on a sheet of graph paper. We do know one thing very clearly, and we should have learned it during the housing bubble – suppressed interest rates encourage yield-seeking speculation, enable low-quality creditors access to the capital markets, direct scarce savings toward unproductive malinvestment, subsidize leveraged carry-trades, and unleash a whole host of “structured” products “engineered” by financial institutions to directly or indirectly piggyback on the good faith and credit of Uncle Sam. When you examine historical data and estimate actual correlations and effect sizes, the dogmatic belief that the Fed can “fine tune” anything in the economy is utter hogwash. At the same time, the demonstrated ability of the Fed to provoke yield-seeking speculation and malinvestment is as clear as day. An activist Federal Reserve is an engine of disaster and little more. Even with the best intentions, a dogmatic Fed, unrestrained by reasonable rules and constraints, is a reckless and deceptive beast, constantly offering to heal the nation with precisely the same actions that inflicted the wounds in the first place. Truth, on the other hand, is beautiful. Economic relationships that are supported in real-world data are a sight to behold. You want to see some relationships you can count on? The chart below shows the relationship between the 3-month Treasury bill and the ratio of the monetary base (currency and bank reserves) to nominal GDP, in data since 1929. Notice something. Without paying banks interest to hold excess reserves idle in the banking system, the Fed could reduce its balance sheet by more than one-third (over $1.4 trillion) without pushing short-term interest rates above zero. That excess base money does nothing to support the real economy. Nobody’s desired level of saving, consumption, or real investment changes just because the Fed has chosen to force the economy to hold more base money and fewer Treasury bonds. But somebody has to hold that cash at every point in time – and nobody wants to hold it. So it simply acts as a hot potato, encouraging yield-seeking speculation in the financial markets. In my view, the most urgent action the Federal Reserve should take is to cease reinvestment of principal as the holdings on its balance sheet mature, in order to reduce this massive pool of idle base money, which does nothing but to promote speculation. No increase in interest rates would need to result from that action.
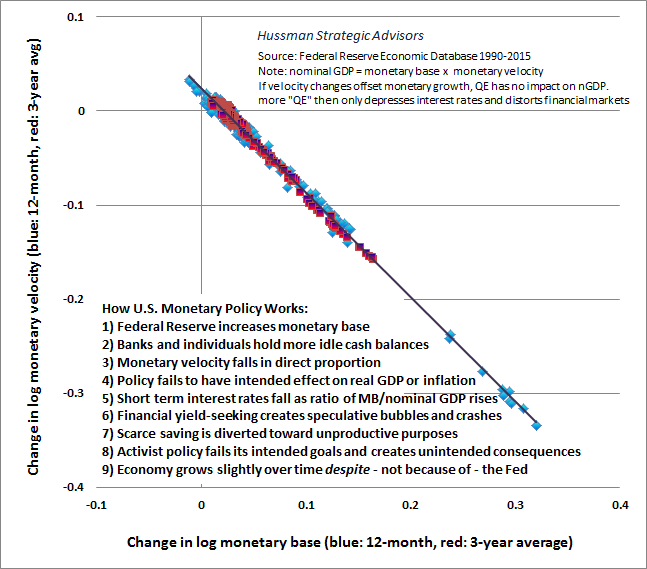
Here’s another relationship you can count on. By definition, nominal GDP is equal to the monetary base multiplied by the “velocity” of the monetary base. People often seem to believe that if the Fed doubles the monetary base, nominal GDP should double as well (either by prices increasing, real GDP increasing, or both). That outcome, however, would only occur if velocity was constant. In that case, quantitative easing would result in a greater level of spending on goods and services, rather than financial speculation. The graph below illustrates that this simply does not happen. In practice, doubling the monetary base simply causes people to hold more idle money balances, and velocity simply falls in half. As a result, actively expanding the money supply in pursuit of higher inflation or higher real GDP growth is ineffective, even if central banks create money in massive amounts as they have in recent years through quantitative easing. Because monetary velocity falls in proportion to growth in the monetary base, more QE simply depresses interest rates and distorts financial markets.
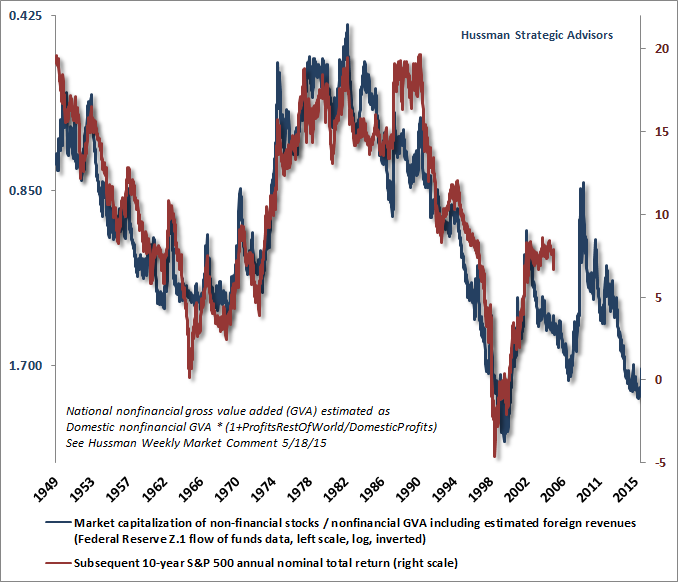
The effect of years of zero interest rate policies has been to progressively drive investors toward securities of greater and greater risk, in the belief that “There Is No Alternative” (TINA). In every other market cycle across history, once an “overvalued, overbought, overbullish” syndrome emerged in the stock market, market internals were either already deteriorating, or collapsed in relatively short order – meaning that investors became more risk averse. When overvaluation was joined by increasing risk aversion, air-pockets, panics and crashes typically followed. In the market cycle since 2009, however, central banks aggressively and intentionally promoted speculation by holding interest rates at zero. That reduced the overlap between “overvalued, overbought, overbullish” syndromes and the eventual deterioration in market internals. Our own rather painful lesson from the recent cycle was that in the presence of QE, one must actually wait for internals to explicitly deteriorate before taking a hard-negative outlook on stocks. We imposed that requirement as an “overlay” to our methods of estimating market return/risk profiles last year. For the past few quarters, we’ve actually seen that explicit deterioration in market internals. That – combined with what we view as obscene overvaluation – is why the stock market has become increasingly vulnerable to vertical losses. To understand how far Fed-induced speculative yield-seeking has gone, the chart below demonstrates another rather beautiful truth: while short-term market outcomes are driven by the risk-seeking and risk-aversion of investors (which we infer from the uniformity or divergence of market internals), the long-term returns that investors achieve in the stock market are overwhelmingly driven by the valuations that investors pay. There have certainly been points where bubbles have briefly caused actual returns to diverge from the returns that would have been expected on the basis of valuations alone (for example, in the decade that followed 1988-1990), but those deviations have also been regularly and rather painfully corrected over time. After years of speculation, we currently estimate a 10-year nominal expected total return for the S&P 500 close to zero – much the same as we projected in real time at the market peak in 2000. The Federal Reserve seems to have no idea what it has done. Poor long-term market returns and severe interim losses are now baked in the cake as a result of obscene valuations. There is no way to undo this outcome – only to manage the consequences.
The dreaded quarter-point of horror With regard to a possible quarter-point hike this week in the amount of interest that the Fed pays banks on idle excess reserves, our view – frankly – is that it doesn’t matter. From a longer-term standpoint, poor stock market returns and the likelihood of 40-55% market losses from the recent peak are already baked in the cake. From a shorter-term standpoint, what matters for market outcomes is not Federal Reserve policy directly, but the effect that any policy move would have on investor risk-seeking or risk-aversion. Historically, the best measure of those risk preferences has not been Fed action itself but the uniformity and divergence of market internals across a broad range of individual stocks, industries, sectors, and security types, including debt of varying creditworthiness. Across the pond, our friend Albert Edwards at SocGen strikes the right note, I think: “The clamour for the Fed not to enact the long-awaited ¼% rate hike next week is growing by the day. Misgivings come not just from reputable mainstream commentators, but now also the World Bank has repeated the IMF’s recent words of caution in advising delay. What a load of nonsense! My esteemed colleague Kit Juckes characterizes the current consensus thinking as ‘If the Fed hikes, pestilence, plague and never-ending deflation will follow.’ Well even those like me who see a deflationary bust awaiting think the Fed should hike next week – because the longer you leave it, the bigger the financial market excesses become, and the bigger the risk of financial dislocation and global recession ensuing. Have we learned nothing from the 2008 Great Recession? Just get on with it!” With respect to the economy, we know that a quarter-point means nothing, given the weak correlation between policy rates and subsequent output, employment and inflation. From a purely economic standpoint, my impression is that the main effect of hiking interest rates would be to draw zero-interest currency into the banking system in the form of even more idle reserves. We’re already seeing indications of an economic slowdown, but the impact of a quarter-point hike on that dynamic is meaningless. The economic slowing we’re seeing here – which as yet isn’t strong enough to warn of recession – was already developing in February (see Market Action Suggests Abrupt Slowing in Global Economic Activity) and based on declining new orders, falling backlogs and rising inventories, is still underway. The real problem isn’t what the Fed may do, but the ultimately unavoidable consequences of what the Fed has already done. The cost of reckless Fed-induced yield seeking will likely be felt first in the financial markets as previous paper gains evaporate, while defaults on excessive low-quality covenant-lite credit will emerge over the course of the economic cycle, and the impact of malinvestment will be to limit productivity and economic growth over the longer run. This is all rather inevitable except in the eyes of those who haven’t watched and memorized a dozen adaptations of the same movie. As the Austrian School economist Ludwig von Mises wrote in Monetary Stabilization and Cyclical Policy (1928), just a year before the Great Depression began: "Every deviation from the prices, wage rates and interest rates which would prevail on the unhampered market must lead to disturbances of the economic equilibrium. This disturbance, brought about by attempts to depress the interest rate artificially, is precisely the cause of the crisis. The ultimate cause, therefore, of the phenomenon of wave after wave of economic ups and downs is ideological in character. The cycles will not disappear so long as people believe that the rate of interest may be reduced, not through the accumulation of capital [i.e. savings made available for productive investment], but by banking policy. “If banks emerge from the crisis unscathed, or only slightly weakened, what remains to restrain them from embarking once more on an attempt to reduce artificially the interest rate on loans and expand circulation credit? The fact that each crisis, with its unpleasant consequences, is followed once more by a new ‘boom,’ which must eventually expend itself as another crisis, is due only to the circumstances that the ideology which dominates all influential groups - political economists, politicians, statesmen, the press and the business world - not only sanctions, but also demands, the expansion of circulation credit." The immediate question isn’t whether a quarter-point hike will have an economic impact, but whether a quarter-point hike will be the “event” that provokes increasingly risk-averse investors to act on selling plans that are already being contemplated. Alternatively, perhaps the Fed will decide not to hike, which might be taken as a kind of “easing” move by the central bank. That’s typically been good for at least a short-lived boost to speculative morale, but as I observed in February (see Expect a Decade of 1.7% Portfolio Returns from a Conventional Asset Mix), keep this in mind: “First and foremost, the response of the equity markets to Federal Reserve easing (and much other news) is conditional on the risk-tolerance of investors at the time, which we infer from observable market action such as internals and credit spreads, among other factors. Quantitative easing ‘works’ by creating default-free liquidity in an environment where that liquidity is viewed by investors as an inferior asset. That is, if investors are risk-seeking, as inferred from the uniformity of market action across securities, sectors and asset classes of all risk profiles, then yes – Fed easing will tend to support further advances in stock prices regardless of the level of valuation. On the other hand, once investors have shifted toward risk-aversion, overvalued markets become vulnerable to abrupt free-falls and crashes, and monetary easing is not materially supportive for stocks because default-free liquidity is desirable. “Again, as I noted in The Line Between Rational Speculation and Market Collapse, investors should remember that the Fed did not tighten in 1929, but instead began cutting interest rates on February 11, 1930 – nearly two and a half years before the market bottomed. The Fed cut rates on January 3, 2001 just as a two-year bear market collapse was starting, and kept cutting all the way down. The Fed cut the federal funds rate on September 18, 2007 – several weeks before the top of the market, and kept cutting all the way down. “What will matter significantly for investors is the condition of market internals, credit spreads, and other risk-sensitive measures in the event that U.S. economic activity begins to further reflect the downturn that is already evident abroad. It is that evidence of investor risk-preferences that will determine the proper response to any change in Fed policy.” In short, my view is that activist Fed policy is both ineffective and reckless (and the historical data bears this out), and that the Federal Reserve has pushed the financial markets to a precipice from which no gentle retreat is ultimately likely. Similar precipices, such as 1929 and 2000, and even lesser precipices like 1906, 1937, 1973 and 2007 have always had unfortunate endings (see All Their Eggs in Janet’s Basket for a review). A quarter-point hike will not cause anything. The causes are already baked in the cake. A rate hike may be a trigger with respect to timing, but that’s all. History suggests we should place our attention on valuations and market internals in any event. The foregoing comments represent the general investment analysis and economic views of the Advisor, and are provided solely for the purpose of information, instruction and discourse. Please see periodic remarks on the Fund Notes and Commentary page for discussion relating specifically to the Hussman Funds and the investment positions of the Funds. --- The foregoing comments represent the general investment analysis and economic views of the Advisor, and are provided solely for the purpose of information, instruction and discourse. Prospectuses for the Hussman Strategic Growth Fund, the Hussman Strategic Total Return Fund, the Hussman Strategic International Fund, and the Hussman Strategic Dividend Value Fund, as well as Fund reports and other information, are available by clicking "The Funds" menu button from any page of this website. |
|||||||||||||||||||||||||
|
For more information about investing in the Hussman Funds, please call us at
1-800-HUSSMAN (1-800-487-7626) 513-326-3551 outside the United States Site and site contents © copyright Hussman Funds. Brief quotations including attribution and a direct link to this site (www.hussmanfunds.com) are authorized. All other rights reserved and actively enforced. Extensive or unattributed reproduction of text or research findings are violations of copyright law. Site design by 1WebsiteDesigners. |