|
|
||||||
|
|

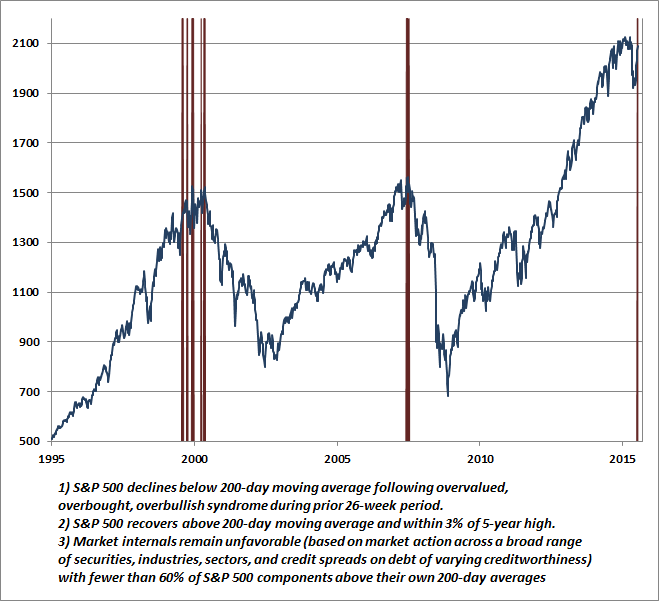
November 2, 2015 Last Gasp Saloon I’ve often emphasized that market peaks are not an event, but a process. One of the elements of that process, as I observed approaching the 2000 and 2007 peaks, and again during the extended range-bound period of recent quarters, is that deterioration in broad market internals — particularly following an extended period of overvalued, overbought, overbullish conditions — is a sign of increasing risk-aversion that typically precedes more extensive losses in the capitalization-weighted averages. Following an abrupt air pocket in the market during August, the capitalization-weighted indices enjoyed a strong rebound in October. Equal-weighted indices have strikingly lagged that rebound. Our own measures of market internals remain unfavorable, and trading volume has been persistently weak, suggesting that the rebound may be more reflective of short-covering than a resumption of the insistent yield-seeking speculation observed prior to mid-2014. Moreover, with the S&P 500 now within a couple of percent of its May record high, only 38% of individual stocks are above their own respective 200-day moving averages. Even among stocks that comprise the S&P 500 index itself, the majority remain below their own 200-day averages. Historically, when the stock market has deteriorated internally following a recent period of overvalued, overbought, overbullish conditions, we know that market outcomes have been negative on average. But what if the S&P 500 Index falls below its 200-day moving average, and then recovers above it again? Doesn’t that recovery signal a resumption of the bull market? The answer largely depends on market internals. If market internals recruit a great deal of uniformity across individual stocks, industries, sectors, and other risk-sensitive securities, then one has to infer that investors have recovered their willingness to speculate. That alone should at least shift the outlook to neutral, and — regardless of the level of market overvaluation — at least defer any immediate expectation of steep market losses, even if the risk of such losses remains. On the other hand, if the recovery of cap-weighted indices like the S&P 500 is not confirmed by uniformity across a broad range of other securities, the historical evidence is that investors have generally been facing the last gasp of a bull market. The chart below should offer some perspective in that regard.
The difficult feature of the interim, at least for hedged equity strategies, is that as the “troops” diverge from the “generals,” portfolios that aren’t comprised of the largest and most speculative stocks of the preceding bull market often underperform the indices during top formations. The same was true in the approach to the 2000 and 2007 peaks. If one is long a broadly diversified portfolio of stocks and hedged with a short position in the major indices, the result is a net portfolio loss — and that can feel excruciating if the major indices are advancing at the same time. All of that tends to reverse itself once the cap-weighted averages break down, or once market internals improve enough to suggest fresh risk-seeking among investors (though that sort of recovery is not typical at extreme valuations). In either event, the interim can be uncomfortable. Emphatically, we can’t rule out the possibility that market internals could improve and support a more neutral or modestly constructive outlook. We also can’t rule out the possibility that this same process of breakdown and recovery could be completed more than once, as it was during the 2000 top formation. But without even a clear improvement in market internals, my impression is that this continues to be an outstanding opportunity for investors to at least rebalance their portfolios to align with their investment horizon and risk tolerance. Equities are essentially 50-year duration investments at current valuations, and even if investors are passive and don’t hold any view about future market returns at all, one of the basic principles of financial planning is to align the duration of ones assets with the expected horizon over which the funds are expected to be spent. A 40% allocation to equities contributes 20 years to portfolio duration. My sense is that many investors presently carry heavy equity allocations that are wholly inappropriate in relation to their investment horizons. For investors who take a full-cycle approach rather than a passive one, a more defensive stance is appropriate. We associate current conditions with negative average expected returns, coupled with risk that is highly skewed to the downside. While we can’t be certain of a market peak until well after the fact, the sequence we observe here is all too familiar. I detailed this transition in real-time during the two prior valuation bubbles of the past 15 years. Despite the most extreme market valuations in history, I wrote in August 2000 “as long as trend uniformity remains modestly constructive, we have to view the market as being in an extended top formation. Historically, market crashes have emerged only after trend conditions have deteriorated measurably, and that will require renewed weakness in market internals. The prospective return from a bullish position is unlikely to justify the risk, so hedging is appropriate.” A few months later, in October 2000, I wrote “Historically, when trend uniformity has been positive, stocks have generally ignored overvaluation, no matter how extreme. When the market loses that uniformity, valuations often matter suddenly and with a vengeance. This is a lesson best learned before a crash rather than after one... On Friday September 1st, the S&P 500 rallied to a peak of 1520.77, capping a string of strong advances. Yet due to a deterioration of market action in a number of economically sensitive groups, our price trend model indicated that trend uniformity had shifted to an unfavorable condition, and we moved to defend our portfolios more fully against downside risk.” That September 1, 2000 peak turned out, in hindsight, to be the final high of the bull market on a total return basis. The stock market followed by losing half of its value. The Nasdaq 100 — comprising the largest and most speculative stocks of the preceding bull market run — collapsed by 83%. It seems remarkable how easily investors forget how market cycles have historically ended. Even a run-of-the-mill bear market decline wipes out more than half of the preceding bull market gains. Likewise, in July 2007, during the peaking process that preceded the 55% market plunge of the global financial crisis, I wrote: “One of the best indications of the speculative willingness of investors is the ‘uniformity’ of positive market action across a broad range of internals. Probably the most important aspect of last week's decline was the decisive negative shift in these measures. Since early October of last year, I have at least generally been able to say in these weekly comments that ‘market action is favorable on the basis of price trends and other market internals.’ Now, it also happens that once the market reaches overvalued, overbought and overbullish conditions, stocks have historically lagged Treasury bills, on average, even when those internals have been positive (a fact which kept us hedged). Still, the favorable market internals did tell us that investors were still willing to speculate, however abruptly that willingness might end. Evidently, it just ended, and the reversal is broad-based.” Put simply, the central features of valuations and market action we observe today closely mirror what we observed, and warned of in real-time, at the 2000 and 2007 peaks. It stands repeating that our difficulty in the advancing half of the present market cycle was the inadvertent result of my 2009 insistence on stress-testing our methods against Depression-era data, after a market collapse that we fully anticipated. I’ve regularly detailed that narrative, along with the adaptations we introduced in mid-2014 to address those inadvertent challenges (see for example, A Better Lesson Than “This Time is Different”). Ignore all of this if you like, but we are convinced that this is how financial markets work. Valuations are the primary driver of long-term returns, and the risk-preferences of investors — as conveyed by the uniformity or divergence of market action across a broad range of individual stocks, industries, sectors and security types (including credit) — drive returns over shorter portions of the market cycle. At present, the valuation measures we find most strongly correlated with actual subsequent S&P 500 total returns suggest zero total returns for the S&P 500 over the coming 10 years, and total returns averaging only about 1% annually over the coming 12-year period. After inflation, we estimate negative prospective real returns on both horizons. Over shorter horizons, market internals, and the investor risk-preferences they convey, are the hinge that determines how stocks are likely to respond to a broad range of other factors, including valuations, interest rates, Fed action, and economic activity. The combination of extreme valuations on historically reliable measures, the deterioration of market internals following an extended period of overvalued, overbought, overbullish conditions, and the weakening of leading economic measures, particularly on measures of new orders and order backlogs, has clear precedents historically, and those precedents are uniformly bad. The interim is uncomfortable for hedged equity strategies because internals typically break down before the capitalization-weighted indices do, but that too is a familiar feature of topping processes. Importantly, and emphatically — if market internals improve, our near-term outlook will immediately shift to a much more neutral stance. Absent a clear retreat in valuations, we don’t see the likelihood of market conditions justifying a shift to a materially bullish outlook, but the immediacy of our downside concerns would be significantly eased were market internals to improve. We’ll respond to changes in market conditions as they emerge.The foregoing comments represent the general investment analysis and economic views of the Advisor, and are provided solely for the purpose of information, instruction and discourse. Please see periodic remarks on the Fund Notes and Commentary page for discussion relating specifically to the Hussman Funds and the investment positions of the Funds. --- The foregoing comments represent the general investment analysis and economic views of the Advisor, and are provided solely for the purpose of information, instruction and discourse. Prospectuses for the Hussman Strategic Growth Fund, the Hussman Strategic Total Return Fund, the Hussman Strategic International Fund, and the Hussman Strategic Dividend Value Fund, as well as Fund reports and other information, are available by clicking "The Funds" menu button from any page of this website. |
|||||||||||||||||||||||||
|
For more information about investing in the Hussman Funds, please call us at
1-800-HUSSMAN (1-800-487-7626) 513-326-3551 outside the United States Site and site contents © copyright Hussman Funds. Brief quotations including attribution and a direct link to this site (www.hussmanfunds.com) are authorized. All other rights reserved and actively enforced. Extensive or unattributed reproduction of text or research findings are violations of copyright law. Site design by 1WebsiteDesigners. |