|
|
||||||
|
|

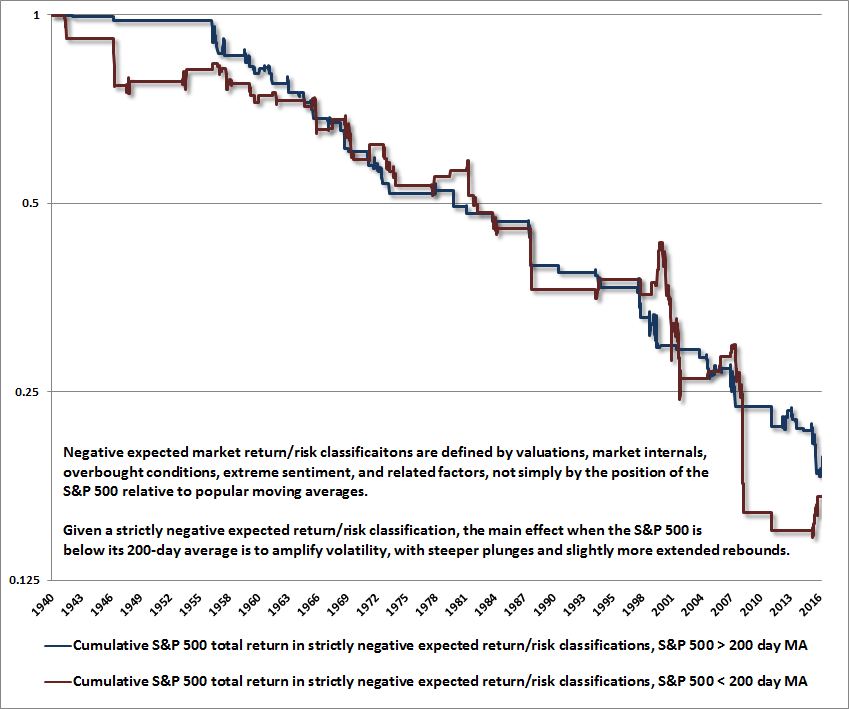
August 22, 2016 Looking Ahead to a Bullish Outlook (and What Will Define It) Current market conditions place our evaluation of the expected market return/risk profile in the most negative classification we identify. Following the British vote to exit the European Union, global economic concerns, coupled with weakness in the Japanese economy, drove interest rates in Britain, Europe and Japan to fresh lows, prompting a burst of yield-seeking speculation that has driven the S&P 500 Index a few percent above its May 2015 peak. At its core, the attempt of central banks to remove any lower bound on yields is an attempt to remove any upper bound on speculation. We expect that materially negative yields will be extremely difficult to sustain, not only for political and economic reasons, but also because the cheap alternative of placing physical currency in a safe creates an arbitrage constraint. The latest yield-seeking euphoria has flattered speculators into believing that imprudence is merely sound investing. As valuations rise, prospective future returns fall, and our 12-year projection for S&P 500 nominal total returns has now dropped to just 1.4% annually. But to reward risk-taking artificially, and for too long, is to amplify the amount of systemic risk that is created. Along with the steepest equity valuations in U.S. history outside of 1929 and 2000 (on measures that are actually reliably correlated with subsequent market returns), private and public debt burdens have reached the most extreme levels in history. My impression is that the market is heaving its last gasp in the extended two-year top formation of the third financial bubble since 2000. While our broad measures of market internals remain rather mixed, and valuations remain obscene, we’ve maintained a fairly neutral near-term outlook lately because several trend-following components among our measures have been favorable. Still, the current return/risk profile features highly “unpleasant skew” - in any given week, the single most likely outcome is actually a small advance, yet the average return in the current classification is quite negative, because those small marginal gains have typically been wiped out by steep, abrupt market plunges that erase weeks or months of gains in one fell swoop (see Impermanence and Full-Cycle Thinking for a chart). For that reason, we would not rely on defenses that require the execution of stop-loss orders, being more inclined toward index put options, particularly given low levels of implied volatility here. Emphatically, the position of the S&P 500 relative to its 200-day moving average is not what defines favorable market action or our overall market return/risk classification. The chart below illustrates why. The lines show the cumulative total return in the S&P 500 Index in all strictly negative market return/risk profiles we identify, partitioned by whether the S&P 500 was above or below its 200-day average at the time. Combined, these instances capture a cumulative 97% loss in the S&P 500, but there’s really not much difference based on the 200-day moving average, except that the market tends to experience more violent declines and somewhat stronger rebounds (that is, higher overall volatility) when the S&P 500 is below that average. The main reason to track the 200-day average here (presently about the 2050 level on the S&P 500) is because it is a widely-referenced trend-following pivot. A decline much more than 2% below that average could provoke coordinated exit attempts by trend-followers, at valuations nowhere near the point where value-conscious investors would be eager to absorb those shares.
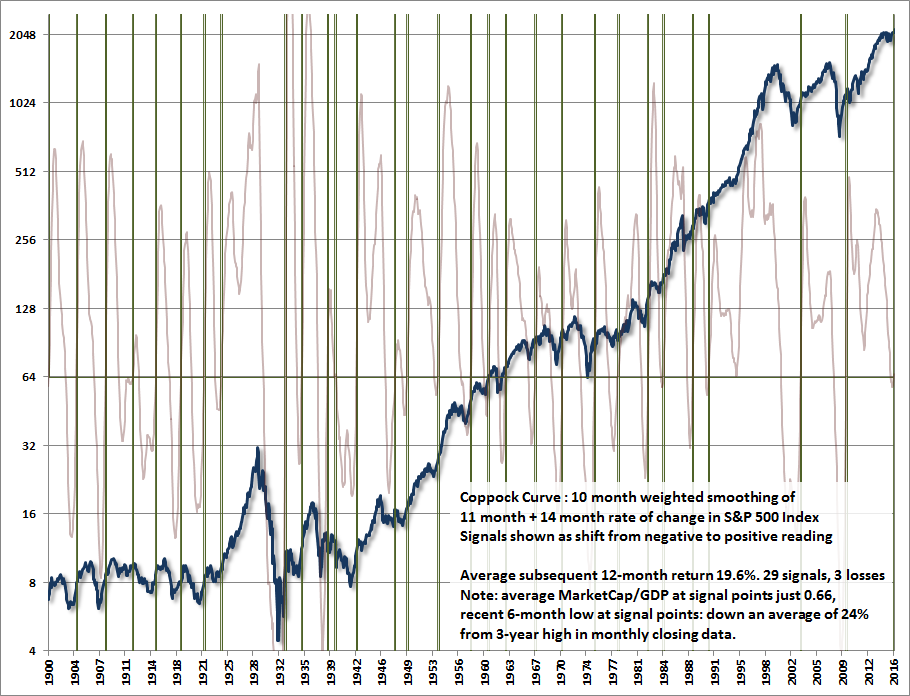
Though our present classification of market conditions is extremely hostile, it’s important to look ahead to the features that will dramatically improve our market outlook over the completion of this cycle. Over the years, I’ve regularly observed that the strongest market return/risk profile we identify is associated with a material retreat in market valuations that is then joined by what I call “early improvement” in market action. That combination of features has encouraged my adoption of a constructive or even leveraged investment stance after every bear market decline in three decades as a professional investor. Our constructive shift in late-2008, after the market had collapsed more than 40%, warrants some discussion. The problem, in that instance, was not that our valuation measures were unfavorable. We clearly recognized that stocks were undervalued relative to historical norms. Rather, measures of early improvement in market action that were effective across every post-war market cycle quickly proved insufficient during the global financial crisis. Taking our methods to older data, we discovered that they also were heavily whipsawed during the Depression, when the same valuations we observed at the 2009 lows were followed by a further loss of two-thirds of the market’s value. The “out of sample” behavior of the economy at that time, compared with post-war behavior, prompted my insistence on stress-testing our methods against Depression-era data. That decision resulted in a difficult and awkward transition that we eventually fully addressed in our mid-2014 adaptations (see the “Box” in The Next Big Short for the complete narrative). While it’s tempting to dismiss our present concerns on the basis of our difficulties in the advancing half of this speculative bubble, I am convinced that this would be a profound mistake. Our defensiveness here is driven by objective measures that have validation in a century of market cycles. But market conditions will change, and I have no doubt that we will observe opportunities to embrace a constructive, and most likely, aggressive investment outlook as this market cycle is completed. As always, the best opportunities are likely to emerge when a material retreat in valuations is joined by an early improvement in our measures of market action (which, following our stress-testing earlier in this half-cycle, are robust to every market cycle we’ve observed across history). Jumping the gun We’ve recently seen some efforts to jump the gun in identifying freshly positive investment conditions. Though there’s a great deal of variability across bear markets, they tend to last somewhat longer than a year, and take the market down by about 32% on average. One of the ways technicians try to capture that profile is to use the “Coppock Curve” - technically, the weighted moving average of the 11-month and 14-month percentage change in the market. The basic formulation is that a positive signal is observed when the curve shifts from a negative to a positive reading. After nearly two years of flat market action at the third highest level of valuation in history, next to 1929 and 2000, the Coppock Curve turned positive this month, prompting enthusiasm among some market technicians. Though we don’t use the Coppock indicator in its popular form, the 29 signals in this measure since 1900 have been associated, on average, with market returns of 19.6% over the following year, and only 3 yearly losses among those signals (one because of the entry into World War II, and the others because the signals were driven by the reversal of a very weakly negative reading, as was the case for the latest signal). The chart below shows this history. The very light purple line is the Coppock curve, and positive signals are identified by the vertical green lines.
When using any indicator, it’s important to have an understanding of why the signals might be useful. Historically, signals from the Coppock Curve have been kind of a shorthand for conditions that we believe actually matter: a material retreat in valuations that is then coupled with an early improvement in market action. Indeed, past signals have been associated with a ratio of market capitalization to GDP averaging just 0.66, which is half of the present level. Likewise, when those signals have emerged, the preceding 6-month low was down an average of -25% from the prior 3-year market high. Those features are no part of present conditions. For our part, we don’t follow the Coppock indicator per se, but the broad range of technical measures we follow include our own variant that is associated with stronger and more reliable subsequent returns (this variant has not even gone to negative levels yet, much less turned favorable). Again, what the signals really capture is a material retreat in valuations that is then joined by an early improvement in market action: the 25 signals since 1900 on our own measure have occurred along with an average MarketCap/GDP ratio of just 0.57, and a prior 6-month low averaging -33% below the prior 3-year high. Put simply, the usefulness of the Coppock Curve largely relates to its tendency to overlap points where valuations have retreated substantially, coupled with an early improvement in market action. The current signal in the raw version of this measure is, in my view, largely an artifact of a high-level top formation that has persisted for nearly two years. The upward bump that produced this signal was provoked by a yield-seeking panic following the Brexit vote. Without a much firmer basis in valuation, prior retreat, and favorable market internals, and without confirmation from more reliable variants, we wouldn’t rest much optimism on this signal. The willingness of investors to embrace indicators without the slightest reflection about what they are intended to measure, frankly, makes us wince. The most favorable market return/risk profiles we identify are associated with a material retreat in valuations that is then joined by an early improvement in market action. I have no question that these conditions will emerge over the completion of the current market cycle, and - despite the truncated bullish shift and awkward transition that followed my 2009 stress-testing decision - there is not a single market cycle in 30 years as a professional investor where those same conditions did not provoke me to adopt a constructive outlook. Investors can dismiss our present concerns with a “permabear” label as they wish. We’ll confidently pursue our investment discipline in any event, in the full expectation that far better conditions will emerge to embrace market exposure over the completion of this cycle, as they always have in market cycles across history.The foregoing comments represent the general investment analysis and economic views of the Advisor, and are provided solely for the purpose of information, instruction and discourse. Please see periodic remarks on the Fund Notes and Commentary page for discussion relating specifically to the Hussman Funds and the investment positions of the Funds. --- The foregoing comments represent the general investment analysis and economic views of the Advisor, and are provided solely for the purpose of information, instruction and discourse. Prospectuses for the Hussman Strategic Growth Fund, the Hussman Strategic Total Return Fund, the Hussman Strategic International Fund, and the Hussman Strategic Dividend Value Fund, as well as Fund reports and other information, are available by clicking "The Funds" menu button from any page of this website. |
|||||||||||||||||||||||||
|
For more information about investing in the Hussman Funds, please call us at
1-800-HUSSMAN (1-800-487-7626) 513-326-3551 outside the United States Site and site contents © copyright Hussman Funds. Brief quotations including attribution and a direct link to this site (www.hussmanfunds.com) are authorized. All other rights reserved and actively enforced. Extensive or unattributed reproduction of text or research findings are violations of copyright law. Site design by 1WebsiteDesigners. |