|
|
||||||
|
|

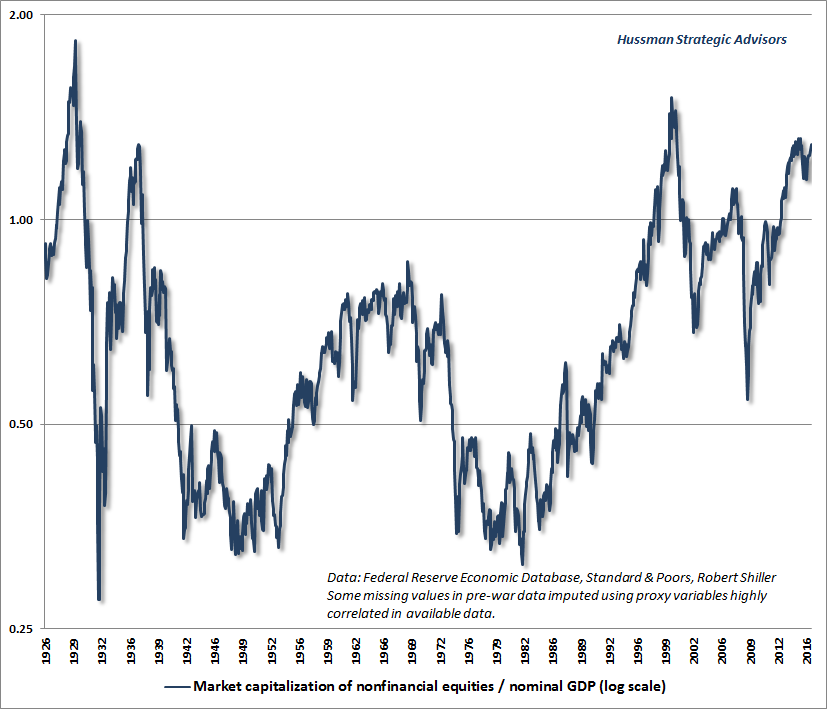
September 12, 2016 Party Like It's 1999 (and 1929) A quick update on near-term market action. Last week’s market retreat was a very minor example of the “unpleasant skew” I’ve discussed in recent months. Under present market conditions, the single most probable outcome in a given week remains a small advance, but with a smaller probability of a steep loss that can wipe out weeks or months of gains in one fell swoop. So the mode is positive, but the mean return is quite negative (see Impermanence and Full Cycle Thinking for a chart of what this distribution looks like). Again, last week was a very minor example. Prospective 10-12 year returns increased by only a few basis points. In recent months, the compression of volatility has encouraged speculative put option writing by pension funds (see here for example), coupled with increased market exposure by volatility-targeting strategies that buy as volatility falls and sell as volatility rises. Last week, JP Morgan’s quantitative derivatives analyst Marko Kolanovic observed “Given the low levels of volatility, leverage in systematic strategies such as Volatility Targeting and Risk Parity is now near all-time highs. The same is true for CTA funds who run near-record levels of equity exposure.” This setup is reminiscent of the “portfolio insurance” schemes that were popular before the 1987 crash, and rely on the same mechanism of risk-control - the necessity of executing sales as prices fall - that contributed to that collapse. I continue to expect market risk to become decidedly more hostile in the event that various widely-followed moving-average thresholds are violated, as those breakdowns are likely to provoke concerted efforts by trend-following market participants to exit, at price levels nowhere near the levels where value-conscious investors would be interested in buying. For reference, the 100-day average of the S&P 500 is about 2120. The 200-day average is about 2057. For now, keep “unpleasant skew” in mind, to avoid becoming too complacent in the event of further marginal advances. I see the most preferable safety nets as those that don’t rely on the execution of stop-loss orders. Looking out on a longer-term horizon, the following chart shows the ratio of nonfinancial market capitalization to nominal GDP, where we can reasonably proxy pre-war data back to the mid-1920’s. Our preferred measure is actually corporate gross-value added, including estimated foreign revenues (see The New Era is an Old Story), but the longer historical perspective we get from nominal GDP is also valuable. The chart shows this ratio on a log scale. To understand why, see the mathematical note at the end of this comment. The recent speculative episode has brought this ratio beyond every extreme in history with the exception of the 1929 and 2000 market peaks.
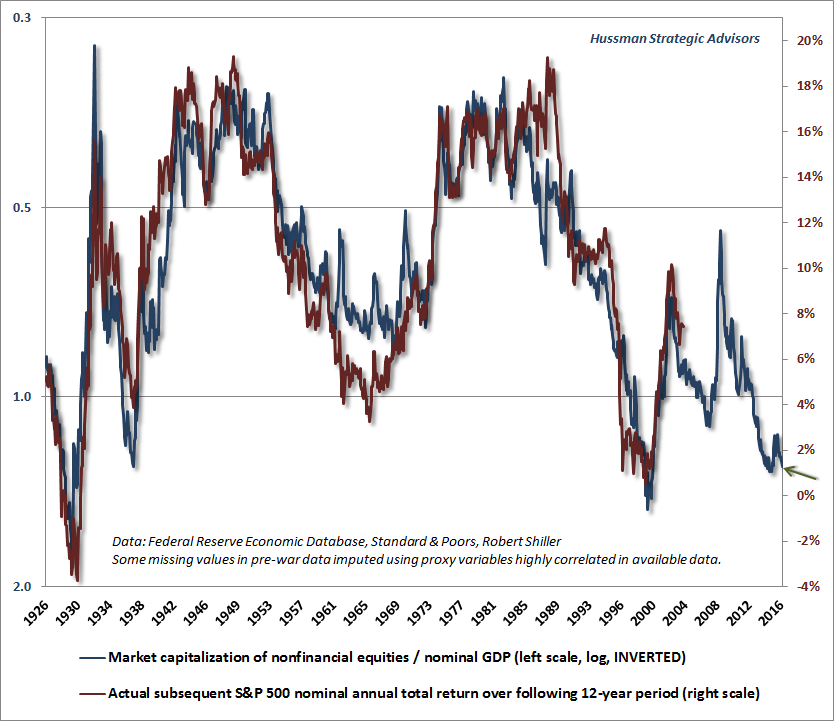
As I’ve often emphasized, one of the most important questions to ask about any indicator is: how strongly is this measure related to actual subsequent market returns? Investors could save themselves a great deal of confusion by asking that question. Hardly a week goes by that we don’t receive a note asking, for example, that “so-and-so says that earnings are going to strengthen in the second half - doesn’t that make stocks a buy?” Well, it might, if year-over-year earnings growth had any correlation at all with year-over-year market returns (it doesn’t), or if there was evidence that earnings tend to strengthen in an environment where unit labor costs are rising faster than the GDP deflator (they don’t). That’s not to say that we can be certain that earnings or stock prices won’t bounce, but we can already conclude that so-and-so hasn’t convincingly made their case. When investors ignore the correlation between indicators and outcomes, they make themselves the victims of anyone with an opinion. The chart below shows the same data as above - the ratio of nonfinancial market capitalization to nominal GDP - but uses an inverted log scale. The red line is the actual subsequent total return of the S&P 500 over the following 12-year horizon. We use that horizon because that's the point where the autocorrelation profile of valuations hits zero (see Valuations Not Only Mean-Revert, They Mean-Invert). The chart offers some sense of why Warren Buffett, in a 2001 Fortune interview, called this ratio “probably the best single measure of where valuations stand at any given moment.” Again, we prefer corporate gross value-added, but at that point, we’re quibbling over a 91% correlation and a 93% correlation with subsequent 12-year market returns. Buffett hasn’t mentioned this measure in quite some time, but that’s certainly not because it has been any less valuable in recent market cycles. As I’ve frequently observed, it’s fine to assert that stocks are “fairly valued” relative to interest rates here, but only provided that “fair” is defined as an expected nominal total return for the S&P 500 averaging about 1.5% annually over the coming 12-year period.
It’s not a theory, it’s just arithmetic Understand that valuation levels similar to the present have never been observed without the stock market losing half of its value, or more, over the completion of the market cycle. We’ve periodically heard analysts talking about stocks being in a “secular” bull market that presumably has years and years to go. These analysts evidently have no sense of what drives such secular market phases. The period from 1949 to about 1965 represented a secular bull market, comprising a series of complete bull-bear market cycles, characterized by progressively richer valuations at the peak of each cyclical bull market. Likewise, the period from 1982 to 2000 represented another long secular bull market, again characterized by progressively richer valuations at each cyclical bull market peak. By contrast, the periods from 1929 to 1949, and again from 1965 to 1982 both represented secular bear markets, comprising a series of complete bull-bear market cycles, but with a somewhat less progressive profile. Still, each period was characterized by a move from extremely rich valuations at the beginning of the secular bear market to extremely depressed valuations (and extremely high expected future returns) nearly two decades later. I'm not at all convinced that these secular phases have reliable periods like 18 years, but suffice it to say that secular movements between durable extremes of overvaluation and undervaluation can span a whole series of cyclical bull-bear cycles. From the chart above, it should be clear that the defining feature of a secular bear market low (and the beginning of a long secular bull market) is deep undervaluation. Indeed, the 1949 and 1982 market troughs each brought the ratio of market capitalization to nominal GDP below 0.33. By contrast, the defining feature of a secular bull market peak (and the beginning of a long secular bear market) is extreme overvaluation. Indeed, the 1929 and 2000 market peaks each brought the ratio of market capitalization to nominal GDP to levels similar to what we observe today (the 2015 peak slightly exceeded 1.30). Let’s do some quick arithmetic. Suppose that real GDP growth accelerates to 2% and inflation picks up to 2%, producing 4% annual nominal GDP growth for the next 25 years. Now allow for the possibility that the stock market hits a secular bear market low similar to 1949 and 1982, not two or three years from now, but fully 25 years from now. On those assumptions, what would happen to the S&P 500 Index over the coming 25 years? The answer is simple. The ratio of the future S&P 500 Index to the current S&P 500 Index would be: (1.04)^25 * (0.33/1.30) = 0.677. Put differently, the S&P 500 Index would be 32.3% lower, 25 years from today, than it is at present. Even including the income from a growing stream of dividends, we estimate that in the event of a secular low 25 years from today, the average annual total return of the S&P 500 between now and then would come to less than 3% annually. It’s not a theory, it’s just arithmetic. Am I suggesting that investors should avoid stocks until the next secular low? Certainly not. Current valuations are more consistent with the start of a secular bear than with a secular bull, and my impression is that we'll eventually look back and see that the 2000 bubble peak was the beginning of what is currently still a secular bear with quite a long time ahead of it. But regardless of where valuations head in the long-term, we expect to observe regular and substantial investment opportunities in stocks over coming market cycles, with the most favorable opportunities emerging at points where a material retreat in valuations is joined by an early improvement in market action. Am I suggesting that the long-term tradeoff between expected return and risk is unfavorable at current valuations, and that near-term and intermediate-term market outcomes could become steeply negative in response to a moderate further deterioration in market action? Absolutely - a century of market evidence offers little to support any other expectation. Elaborate fallacies The danger of the current iteration of “this time it’s different,” I think, is in how elaborate and far-reaching the underlying fallacies have become. By equating the delay of consequences with the absence of consequences, investors have now set up the most extreme episode of equity market speculation in U.S. history next to the 1929 and 2000 market peaks, and the broadest episode of general financial market speculation outside of the 11-month period from November 1928 to September 1929 (as measured by the estimated prospective 12-year total return on a conventional portfolio mix of 60% stocks, 30% bonds and 10% Treasury bills). It’s not just that investors have oversimplified a complex interaction, which they are certainly doing here in assuming that “easy money makes risky assets go up.” This simplification fails to explain, for example, how the U.S. stock market could lose more than half of its value on two separate occasions since 2000, during periods when the Federal Reserve was persistently and aggressively easing. It also overlooks that the Japanese stock market shed more than 60% of its value on two separate occasions since 2000, despite short-term interest rates that were regularly pegged at zero and never breached even 1%. The historically supported, but more complex statement recognizes that the relationship between monetary policy and the financial markets is not reliably mechanical but wholly psychological. Easy money operates by creating safe but low-interest liquidity that someone in the economy must hold at every moment in time until it is retired. Investors often treat that liquidity as an inferior and uncomfortable “hot potato,” but only if they don’t see safety as desirable. So the accurate statement is that “easy money can encourage speculation, but only does so reliably when investors are already inclined to speculate.” As I’ve often noted, we infer the preference of investors toward speculation or risk-aversion by the uniformity or divergence of market internals across a broad range of individual securities, industries, sectors, and security-types. The fallacies underlying today’s “this time is different” mantra go even further, assuming not only that central bank behavior has permanently changed, but that we can also abandon everything we’ve learned from centuries of economic dynamics, human behavior, and even basic arithmetic. Having repeatedly borrowed enough short-lived bursts of consumption from the future to keep U.S. real GDP growth barely above 1% over the past year (and indeed, over the past decade), monetary authorities have convinced investors of a cause-effect relationship between activist monetary policy and economic outcomes that is entirely absent in actual data (see Failed Transmission - Evidence on the Futility of Activist Fed Policy). Worse, central bankers have convinced investors that the progressive overpricing of financial securities can substitute for actual growth. Unfortunately, with every increase in price, what was “prospective future return” a moment earlier is suddenly converted into “realized past return,” leaving nothing but lower expected returns and greater risk on the table for investors who continue to hold those securities. The essence of a Ponzi scheme is to reward investors who leave early, out of the capital of investors who arrive later, thereby ensuring losses for anyone who stays. What else is current central bank policy but a massive greater-fool Ponzi scheme? The recent speculative episode has even convinced investors that human nature itself has changed. Centuries of financial market behavior can easily verify that periodic cycles of greed and fear are an inherent part of market dynamics. Instead, investors have abandoned that lesson, believing that central banks have discovered the ability to do “whatever it takes” to keep markets higher (without realizing that the effectiveness of easy money is entirely dependent on the absence of risk-aversion among investors). The thing that allows this is imagination. In every market cycle, imagination is what gives greed and fear their impetus. In a financial or economic crisis, imagination is what leads investors to question whether the economic system itself can survive. In a bubble, imagination is what leads investors to invent endless reasons why the carnival can continue indefinitely. For example, despite the fact that Japan’s real GDP has grown at just one-half of 1% annually over the past two decades, while the Nikkei stock index has taken an extraordinarily volatile trip to nowhere over that period, imagination leads investors to ask why the Federal Reserve won’t suddenly begin buying stocks, as the Bank of Japan and the Swiss National Bank have done. Well, one answer is that Sections 14 and 15 of the Federal Reserve Act prohibit it. Another is that even if the Fed could emulate the Bank of Japan, the Nikkei Index is still below where it was in 2000, 2007 and 2014 (not to mention 1986), so it’s not at all clear that such purchases exert any sustained effect on stock prices. In addition, one needs to examine the situation of each government to understand why certain central banks, and not others, have purchased equities in the first place. As a fairly insular economy, Japan’s encouragement of overlapping and often centrally-planned relationships between government, business and the banking system has been the dominant economic model for decades, which has allowed more tolerance for the actions of the Bank of Japan. That said, buying corporate securities is actually quite a hostile act toward the public, compared with buying government debt. The reason is that when government bonds are issued for the purpose of public expenditure, or ideally, productive investment, central bank purchases of those bonds are a form of public finance. By contrast, when a central bank purchases corporate securities, and if they subsequently lose value, the creation of base money acts as a public subsidy to private investors who would otherwise have borne that loss. Since central bank purchases of stock are the last resort of a central bank that has already pushed other forms of speculation to the limit, the likelihood of loss is quite high. Those losses will involve a large opportunity cost to the public, as well as a transfer of public wealth to private individuals. From a contrarian perspective, I suspect that the worst time for a central bank to buy stocks is when the public itself is too bullish to oppose it. Meanwhile in Switzerland, the desire to peg the Swiss franc to the value of the euro can only be achieved by following Mario Draghi down the primrose path of asset purchases, and the already bloated balance sheet of the Swiss National Bank leaves stocks among the few assets available to buy. My expectation is that this too, will turn out in hindsight to have imposed a huge opportunity cost on the Swiss public. With regard to the basics of yield arithmetic, investors have equated raw yield with total return, in a way that leaves them with no meaningful prospect for investment returns over the coming 10-12 years, and the likelihood of deep interim losses over the completion of the current market cycle. Understand that the “current yield” of a stock or a bond (the annual dividend or interest payment divided by the current price) is quite a misleading indicator of likely total return. Consider, for example, a 30-year bond with a coupon yield (annual interest payment/face value) of 3%. By the time the price advances enough to bring the current yield (annual interest payment/current price) down to 1.58%, the yield-to-maturity on that bond has already hit zero; investors in that bond will then earn nothing for 30 years. Moreover, an increase in the yield-to-maturity from zero to just 1% will generate a -20% capital loss. Indeed, German 30-year bonds, which hit a record low yield-to-maturity of 0.34% at the end of July (think about that), have already lost about -8% as yields have increased by just a few tenths of 1%. Investors seem to forget that the lower the yield and the longer the maturity of a financial asset, the greater its vulnerability to capital losses in response to even minor changes in yields or risk premiums. This is particularly true for equities. The language of a market top is “well, even if it goes down, it will eventually come back up.” To some extent, that’s true. Over the 16 years since the 2000 market peak, the S&P 500 has posted an average total return of 4% annually, though it’s taken the third most extreme equity market bubble in U.S. history to do it. Unfortunately, a century of market history suggests that all of that return is likely to be wiped away over the completion of the current market cycle; an outcome that would only be run-of-the-mill given current valuations. By that point, investors may be quite right that they didn’t lose anything by purchasing stocks at the 2000 highs. I doubt that it will be much solace. The belief in “TINA” - the notion that “there is no alternative” but to own stocks - ignores that stocks are already so overvalued that the S&P 500 is likely to underperform even the 1.6% yield on Treasury bonds over the coming decade. Frankly, we expect even the average return on Treasury bills to be higher over that horizon. So, yes, I very much believe that safe, low-interest cash is a presently a better investment option, both in terms of prospective return and potential risk, than equities, corporate bonds, junk debt, or even long-term Treasury bonds. My view is that investors should presently make room in their portfolios for safe, low-duration assets, hedged equities, and alternative strategies that have a modest or even negative correlation with conventional securities. I expect that there will be substantial opportunities to alter that mix over the completion of the current market cycle. The time to focus on higher beta and longer duration assets is when those assets are priced at levels that offer potential compensation for their prospective risk. Currently, investors in conventional assets face a combination of weak expected returns and spectacular downside potential. I expect that this will soon enough be as obvious as it was in 2002 and 2009, when investors looked back on their insistence that “This time is different” and replaced that thought with “What the hell were we thinking?” In the interim, as value investor Howard Marks observed in The Most Important Thing, “Since many of the best investors stick most strongly to their approach - and since no approach will work all the time - the best investors can have some of the greatest periods of underperformance. Specifically, in crazy times, disciplined investors willingly accept the risk of not taking enough risk to keep up... Investment risk comes primarily from too-high prices, and too-high prices often come from excessive optimism and inadequate skepticism and risk aversion.” A mathematical note on valuations and subsequent market returns I’ve introduced a lot of analytical methods and indicators over the years, and various graphics demonstrating the relationship between reliable valuation measures and subsequent market returns have come to be known as the “Hussman valuation chart.” Since we continually do research and learn from those efforts, we’ve identified increasingly accurate measures over time. For example, while Shiller’s cyclically adjusted P/E (CAPE) is preferable to say, price/forward earnings, the CAPE becomes much more reliable when one corrects for variations in the embedded profit margin (see Two Point Three Sigmas Above the Norm). Some observers seem keen to characterize learning from research as some sort of nefarious “evolution,” or to dismiss a century of evidence on valuations as “data mining” or “curve fitting,” so it’s important to understand how strongly the relationships between valuations, growth rates, and investment returns are rooted in identities and basic arithmetic. As a side note, I also use logarithms quite a bit. If you’re serious about investing, learning how to work with logs is time well-spent, because returns tend to be linear in log valuations (see, for example, The Coming Fed-Induced Pension Bust). Let's review this arithmetic (see Rarefied Air: Valuations and Subsequent Market Returns for details and data). Below, P is price, F is some reasonably reliable fundamental, V is the valuation ratio P/F, and g is the nominal growth rate of that fundamental over the following T years. We can then write the future capital gain in the form of an arithmetic identity: P_future / P_today = (F_future/F_today) * (V_future / V_today) P_future / P_today = (1+g)^T x (V_future / V_today) Or in log terms: log(P_future/P_today) = T x log(1+g) + log(V_future) - log(V_today) All this says is that your future investment return is driven by: the holding period T, the growth rate of fundamentals g over that horizon, and the change in valuations over the holding period. Because departures of valuations and nominal growth from their historical norms tend to mean-revert over time, one can obtain reliable estimates of prospective 10-12 year market returns by using historical norms for g and V_future. But we can actually go further. The estimates turn out to be accurate even in periods where g and V_future depart from their historical norms. The reason is that variations in g over a 10-year period tend to systematically offset variations in terminal valuations log(V_future), largely because of how investors respond to inflation. Put simply, market valuations tend to be negatively correlated with the growth rate of nominal GDP over the preceding decade. It’s a systematic relationship. Meanwhile, average dividend income over a given holding period has a high inverse correlation with starting valuations. The consequence is that annual nominal total returns in the S&P 500 over a 10-12 year horizon have a robust and inverse correlation with the log of starting valuations, particularly as measured by market capitalization/GDP or market capitalization/corporate gross value-added. That’s not data mining or curve-fitting. It’s not a theory, it’s just arithmetic.The foregoing comments represent the general investment analysis and economic views of the Advisor, and are provided solely for the purpose of information, instruction and discourse. Please see periodic remarks on the Fund Notes and Commentary page for discussion relating specifically to the Hussman Funds and the investment positions of the Funds. --- The foregoing comments represent the general investment analysis and economic views of the Advisor, and are provided solely for the purpose of information, instruction and discourse. Prospectuses for the Hussman Strategic Growth Fund, the Hussman Strategic Total Return Fund, the Hussman Strategic International Fund, and the Hussman Strategic Dividend Value Fund, as well as Fund reports and other information, are available by clicking "The Funds" menu button from any page of this website. |
|||||||||||||||||||||||||
|
For more information about investing in the Hussman Funds, please call us at
1-800-HUSSMAN (1-800-487-7626) 513-326-3551 outside the United States Site and site contents © copyright Hussman Funds. Brief quotations including attribution and a direct link to this site (www.hussmanfunds.com) are authorized. All other rights reserved and actively enforced. Extensive or unattributed reproduction of text or research findings are violations of copyright law. Site design by 1WebsiteDesigners. |