|
|
||||||
|
|

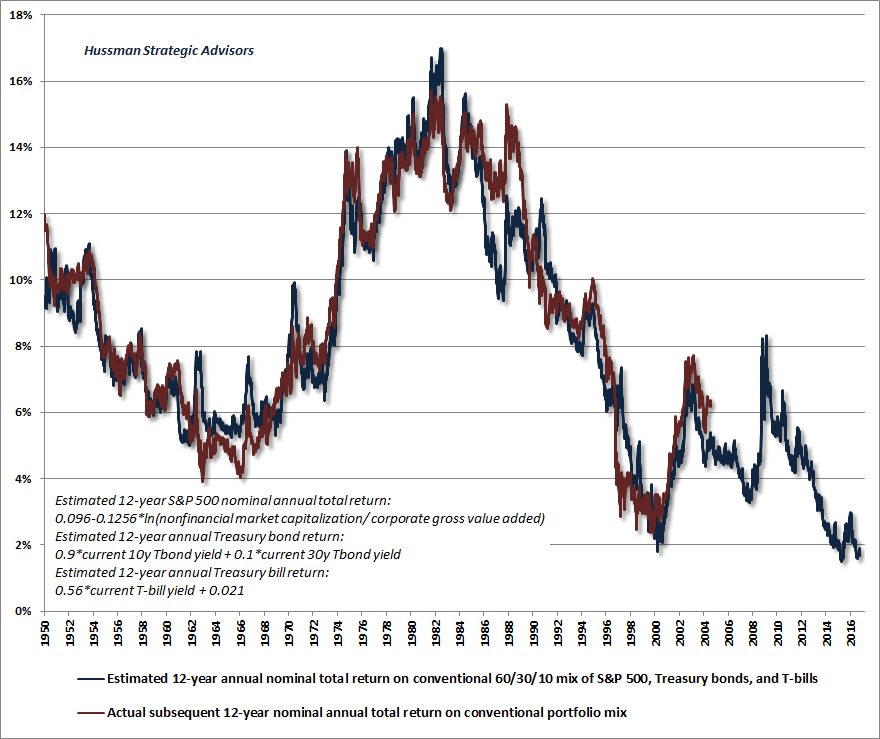
October 17, 2016 Calm Before the Storm Several weeks ago, we shifted from a rather neutral near-term stock market view, to a hard-negative outlook, based on fresh deterioration in various trend-sensitive components within our broad measures of market action. From a cyclical perspective, the stock market has effectively gone nowhere since mid-2014 (with zero total return on the broad NYSE Composite since then). The past two years can be characterized less as an ongoing bull market than as the extended top-formation of the third speculative episode since 2000, the third most extreme equity market bubble in history (next to 1929 and 2000), and the most extreme point of overvaluation in history across the broad cross-section of individual stocks and asset classes. I’ve discussed nearly every detail of our present concerns with charts, data, and analysis in dozens of recent weekly comments. The chart below is a reminder that our estimates for the prospective 10-12 year return on a conventional portfolio mix of stocks, bonds, and money market instruments have never been lower. This poor long-term outlook is also joined by immediate near-term concerns. We currently estimate flat or negative prospective return/risk profiles across virtually every major asset class, including domestic equities, international equities (which despite better relative valuations, still tend to have a beta of roughly 1.0 when U.S. markets decline), Treasury bonds, corporate bonds, junk bonds, utilities, and even precious metals shares (which despite reasonable long-term valuations are facing sufficient near-term headwinds to keep us roughly neutral).
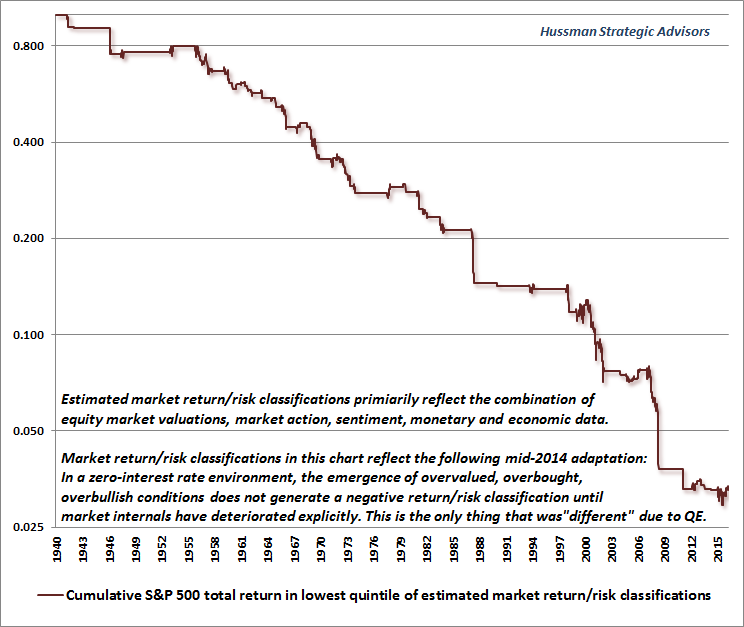
We don’t expect the current situation to end well for investors who insist on taking larger investment exposures than they’re actually willing to hold, with discipline, through a period of severe market losses. From present valuation extremes, a 40-55% market loss would represent a fairly run-of-the-mill resolution to the current market cycle; a decline that would take valuations only to the high-end of the range they’ve visited or breached over the completion of every market cycle in history. By the completion of the current cycle, I expect over $10 trillion of what investors count as paper “wealth” in U.S. equities to disappear without a trace. Keep in mind that what investors count as “wealth” in financial assets doesn’t “go” somewhere else during a market decline. It simply vanishes. Market capitalization equals price times the number of shares outstanding. If even one share changes hands at a lower price, market capitalization falls by the change in price times the number of shares outstanding. If a dentist in Poughkeepsie sells a single share of Apple stock, at a price that’s just a dime lower than the previous price, over $500 million of paper “wealth” is instantly wiped out of U.S. stock market capitalization. Every security that’s issued has to be held by someone until that security is retired. It’s just that the owners change. The actual cumulative economic wealth embodied in a security is the stream of future cash flows it will deliver to its holders over time, and even that stream of cash flows counts as a liability of the issuer. Both investors and policy makers would do well to understand that when one nets out all of the assets and liabilities in the economy, the only true wealth of a society consists of its stock of real private investment (e.g. housing, capital goods, factories), real public investment (e.g. infrastructure), intangible intellectual capital (e.g. education, inventions, organizational knowledge and systems), and its endowment of basic resources (e.g. land, energy, water). In an open economy, one would include net claims on foreigners (negative in the U.S. case). So contrary to the idea that Fed-induced yield-seeking speculation has created “wealth,” the fact is that monetary policy has done little but to distort the financial markets and encourage repeated cycles of malinvestment and collapse. It’s misguided to imagine that the gap between the future consumption needs of an aging population and the future output of a productivity-challenged economy can be addressed by central banks through greater purchases of riskier assets or “helicopter drops" of spending power, as if speculation generates economic productivity, or as if fiscal policy is run by central banks rather than Congress. No. The only way to close the gap is through policies that encourage productive real investment at every level of the economy, rather than fostering pointless financial speculation. Every day that central banks hold out the false hope of a paper solution is a day that chips away at the productive foundations of our economy. Passive returns look glorious in the rear-view mirror precisely because Fed-induced yield-seeking speculation has driven nearly every asset class to rich or obscene valuations in recent years. But investors should understand that risky securities do not, over time, persist without risk premiums. Indeed, neither aggressive Fed easing nor low interest rates has historically supported stocks during periods when, for whatever reason, investor preferences shift toward risk-aversion. This lesson should have been drawn from the 2000-2002 and 2007-2009 collapses. The same lesson is likely to be taught again shortly, as we infer increasing risk-aversion among investors based on deteriorating uniformity and increasing dispersion across market internals. The immediacy of our concerns would ease in response to a material improvement in those internals. Over the completion of the current market cycle, prospective returns are likely to spike toward more normal levels, which is another way of saying that security prices are likely to plunge. Given the record leverage that central banks have encouraged across governments, corporations, and financial institutions (particularly in Europe), it’s likely that economic and credit events will figure high on the list of catalysts. But historically, the best way to anticipate market weakness is not to insist on identifying the “catalyst” for such losses in advance (they are almost always identified in hindsight), but instead, by focusing on the prevailing and observable combination of valuations, market action, and related factors. Our outlook will change as that observable evidence does. At present, on a blended horizon of 2-weeks to 18-months, our estimate of the prospective market return/risk profile for stocks is in the most negative 2% of all historical periods. The chart below shows the cumulative total return of the S&P 500 since 1940 in periods that fall into the lowest quintile of estimated return/risk profiles, based on our current classification methods. Together, these periods capture a cumulative 97% market loss, which is another way of saying that the other 80% of periods capture a cumulative S&P 500 total return about 30 times the cumulative total return of the passive index itself. The chart is on log scale, so that equal percentage movements cover the same vertical distance. The chart reflects the adaptation we introduced in mid-2014 (see the Box in The Next Big Short for the full narrative), lest investors are tempted to imagine that “this time is different” to a greater degree than is actually consistent with historical data.
Notice the little region of churning movement in the lower right of the chart. That’s market behavior in recent quarters, including the selloff early this year. The fluctuations are quite small relative to the larger losses that are characteristic of this set of return/risk profiles. From that perspective, the churning we’ve seen since mid-2014 is likely to be remembered as the calm before the storm. We saw the same sort of churning during the 2000 and 2007 top formations, which was memorably frustrating before the market collapsed. The combination of small “churning” movements coupled with large, steep declines reflects the “unpleasant skew” I’ve often discussed in relation to similar conditions. The single most likely outcome in any particular week is actually a small gain, but those gains are ultimately overwhelmed by abrupt, steep, and nearly untethered vertical losses, which investors experience as air-pockets, free-falls, and crashes. I believe that I’ve been sufficiently clear about the evidence that drives our concerns, and that I’ve appropriately recognized and adapted to our own challenges during the speculative half-cycle since 2009. Still, in more than three decades as a professional investor, I’ve found that there’s nothing like the completion of a market cycle to drive home the point that a disciplined focus on the market return/risk profile is essential, and that “this time” is never as “different” as Wall Street encourages investors to imagine. As a fully-leveraged “lonely raging bull” in the early 1990’s, I found it nearly impossible to convince investors that market prospects were positive, as they imagined that the “Bush recession” would never end. In 2000 and again in 2007, it was nearly impossible to convince investors of the speculative extremes and downside risks of markets where the “old rules” didn’t seem to apply. Once a market cycle is completed, everything seems obvious in hindsight. Soon enough, investors will wonder why they didn’t consider the extreme risks of the current environment to be just as obvious.The foregoing comments represent the general investment analysis and economic views of the Advisor, and are provided solely for the purpose of information, instruction and discourse. Please see periodic remarks on the Fund Notes and Commentary page for discussion relating specifically to the Hussman Funds and the investment positions of the Funds. --- The foregoing comments represent the general investment analysis and economic views of the Advisor, and are provided solely for the purpose of information, instruction and discourse. Prospectuses for the Hussman Strategic Growth Fund, the Hussman Strategic Total Return Fund, the Hussman Strategic International Fund, and the Hussman Strategic Dividend Value Fund, as well as Fund reports and other information, are available by clicking "The Funds" menu button from any page of this website. |
|||||||||||||||||||||||||
|
For more information about investing in the Hussman Funds, please call us at
1-800-HUSSMAN (1-800-487-7626) 513-326-3551 outside the United States Site and site contents © copyright Hussman Funds. Brief quotations including attribution and a direct link to this site (www.hussmanfunds.com) are authorized. All other rights reserved and actively enforced. Extensive or unattributed reproduction of text or research findings are violations of copyright law. Site design by 1WebsiteDesigners. |