
|
|
||||||
|
|

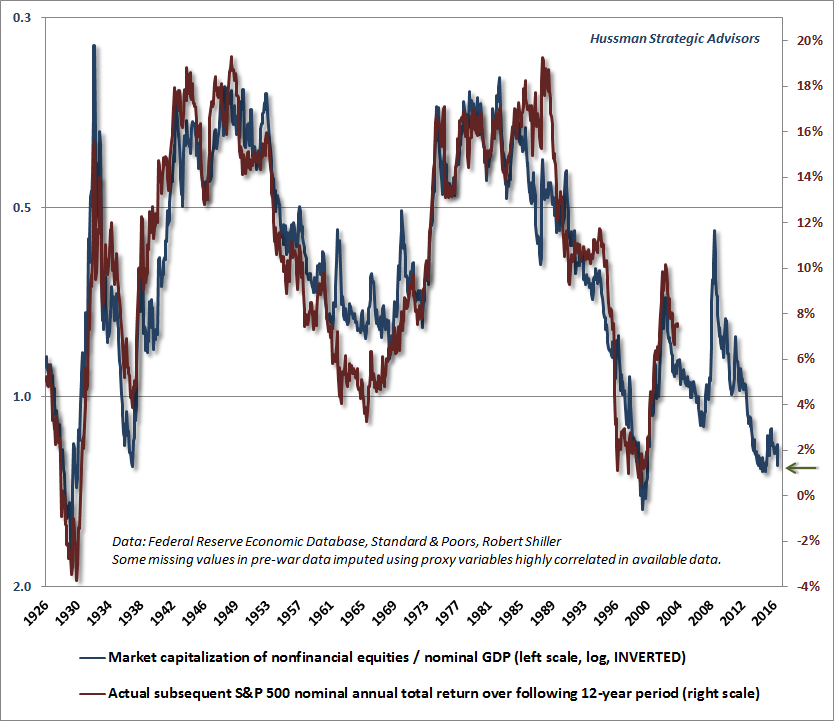
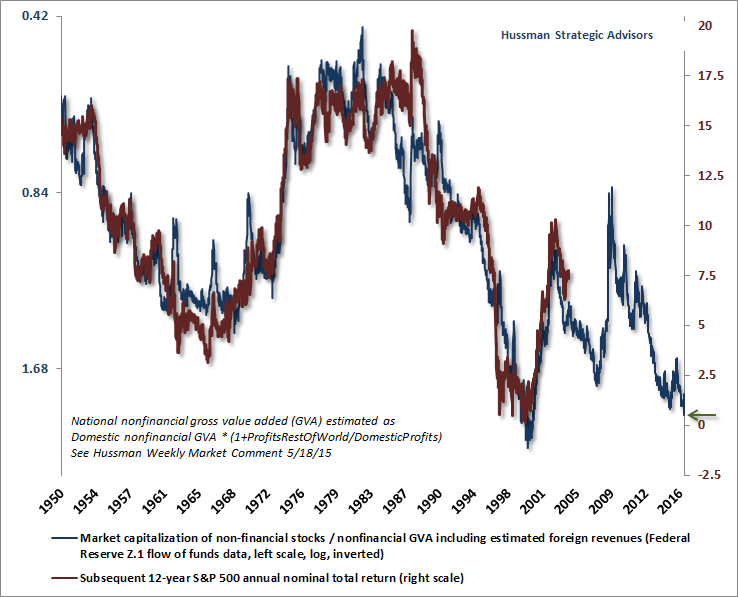
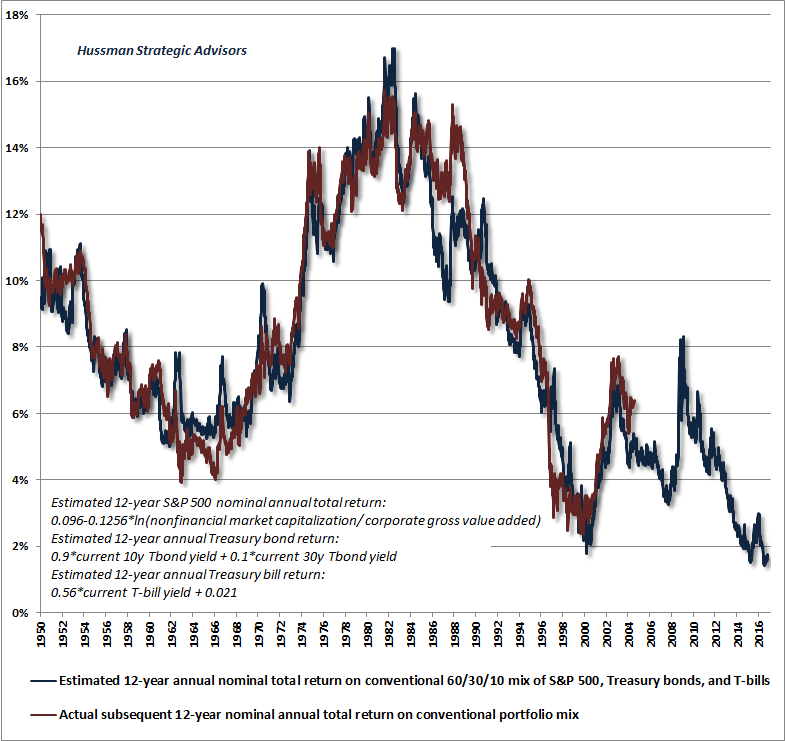
December 19, 2016 Red Flags Waving “Happiness isn’t good enough for me! I demand euphoria!” - Bill Watterson, Calvin & Hobbes There are several instances across history when valuations have broken well-beyond their historical norms, as the speculative “animal spirits” of investors have scrambled off like greased pigs at a rodeo. Those speculative episodes were typically concluded by one of two events: 1) a combination of overvalued, overbought, overbullish conditions appearing as a joint syndrome, or 2) deteriorating uniformity and widening dispersion of market internals across a broad range of individual securities, industries, sectors, and security-types, indicating a subtle shift among investors toward risk-aversion (when investors are risk-seeking, they tend to be indiscriminate about it). Indeed, in market cycles across history, those two events were regularly “stuck together,” in the sense that overvalued, overbought, overbullish extremes were typically either accompanied or closely followed by deterioration in market internals. That regularity turned out to be our Achilles Heel in the half-cycle since 2009. After admirably navigating previous complete market cycles, I insisted on stress-testing our methods against Depression-era data in 2009. The resulting methods picked up the fact that overvalued, overbought, overbullish extremes were consistently associated with market losses across history, and we responded by taking a hard-negative market outlook when they appeared. The problem in the half-cycle since 2009 was that zero interest rates - and specifically short-term interest rates below about 10 basis points - acted as a kind of “solvent” that separated the two events, and encouraged yield-seeking speculation by investors long after extreme overvalued, overbought, overbullish conditions had emerged. In the presence of zero-interest rate policy, one had to wait for market internals to deteriorate explicitly before adopting a hard-negative market outlook. We presently observe the third most overvalued extreme in history based on the most reliable valuation measures we identify, in the presence of 1) the most extreme “overvalued, overbought, overbullish” syndrome we identify, and 2) explicitly deteriorating market internals. Based on a composite of measures best correlated with actual subsequent market returns across history, other two competing extremes were 1929 and 2000. After more than three decades as a professional investor, it’s become clear that when investors are euphoric, they are incapable of recognizing euphoria itself. Presently, we hear inexplicable assertions that somehow euphoria hasn’t taken hold. Yet in addition to the third greatest valuation extreme in history for the market, the single greatest valuation extreme for the median stock, and expectations for economic growth that are inconsistent with basic arithmetic, both the 4-week average of advisory bullishness and the bull-bear spread are higher today than at either the 2000 or 2007 market peaks. In the recent half-cycle, extreme bullish sentiment and deteriorating market internals also preceded the near-20% decline in 2011, yet extreme bullish sentiment was also uneventful on a few occasions when interest rates were in the single digits and market internals were intact. That distinction is critical. The zero-rate “solvent” that allowed overvalued, overbought, overbullish extremes to detach from deteriorating market internals and downside risk is now gone, and investors should understand that subtlety. As a side note, among popular alternatives, Investors Intelligence publishes one of the better surveys of bullish/bearish sentiment, while the AAII survey is far noisier. For our part, we focus on a slightly different balance, between trend-sensitive and value-conscious investor groups. As I detailed in Lessons From the Iron Law of Equilibrium: “When prices are unusually elevated relative to the norm, it’s almost always because trend-followers (and other price-insensitive buyers) are ‘all in.’ Those positions are - and in fact have to be - offset by equal and opposite underweights by value-conscious investors. A sudden increase in the desired holdings of trend-sensitive traders has to be satisfied by inducing a price increase large enough to give value-conscious investors an incentive to sell. Conversely, a sudden decrease in the desired holdings of trend-sensitive traders has to be satisfied by inducing a price decline large enough to give value-conscious investors an incentive to buy. Any tendency of investors to buy on greed and sell on fear obviously amplifies this process. “From this perspective, (and one can show this in simulation), what we’re really interested in is not the balance between bulls and bears per se, but the balance of sentiment between trend-sensitive and value-conscious investors. Market tops emerge when trend-followers are beating their chests while value-conscious investors are nursing bruises from their shorts. Market bottoms are formed when trend-followers wouldn’t even touch the market, and value-conscious investors are bleeding from all of the falling knives they’ve accumulated.” Valuation update Over a century ago, Charles Dow wrote “To know values is to comprehend the meaning of movements in the market.” To offer a long-term and full-cycle perspective of current market conditions, I published a chart last week of the ratio of nonfinancial market capitalization to corporate gross value added, including estimated foreign revenues (what I’ve called MarketCap/GVA), and a second chart relating that measure to the actual 12-year S&P 500 total returns that have followed. From present valuation extremes, we expect 12-year S&P 500 total returns averaging just 0.8% annually, with a likely interim market collapse over the completion of this cycle on the order of 50-60%. Valuations are poor tools to gauge near-term market outcomes, but they are both invaluable and brutally honest about potential consequences over the complete market cycle. They also offer a consistent framework to understand market fluctuations. Recall for example, my April 2007 estimate of a 40% loss to fair-value, and then following that 40% loss, my late-October 2008 comment observing that stocks had become undervalued. Over the complete market cycle, valuation is quite a strong suit for us. Similarly, as I wrote at the March 2000 bubble peak: “Investors have turned the market into a carnival, where everybody ‘knows’ that the new rides are the good rides, and the old rides just don’t work. Where the carnival barkers seem to hand out free money for just showing up. Unfortunately, this business is not that kind - it has always been true that in every pyramid, in every easy-money sure-thing, the first ones to get out are the only ones to get out... One of the things that you may have noticed is that our downside targets for the market don’t simply slide up in parallel with the market. Most analysts have an ingrained ‘15% correction’ mentality, such that no matter how high prices advance, the probable maximum downside risk is just 15% or so (and that would be considered bad). Factually speaking, however, that’s not the way it works... The inconvenient fact is that valuation ultimately matters. That has led to the rather peculiar risk projections that have appeared in this letter in recent months. Trend uniformity helps to postpone that reality, but in the end, there it is... Over time, price/revenue ratios come back into line. Currently, that would require an 83% plunge in tech stocks (recall the 1969-70 tech massacre). The plunge may be muted to about 65% given several years of revenue growth. If you understand values and market history, you know we’re not joking.” As it happened, the S&P 500 lost half of its value by the October 2002 low, while the tech-heavy Nasdaq 100 Index lost an oddly precise 83% of its value. With regard to the advancing half-cycle since 2009, I can be reasonably criticized for my insistence on stress-testing our methods in response to the global financial crisis (which we anticipated, but that also produced outcomes that were "out of sample" from a post-war perspective). My well-intended fiduciary inclination inadvertently shot us in the foot, because the resulting approach to classifying market return/risk profiles embedded a regularity of both Depression-era and post-war market cycles that, in this cycle, was disrupted by zero-interest rate policy. Our mid-2014 adaptations resolved that issue. Though I’m convinced that our methods have ultimately come out stronger, the criticism is legitimate, as is criticism about the time it took to disentangle and address the underlying issue. That said, investors are entirely misguided if they believe that those challenges in this cycle give them a "free pass" to ignore obscene valuations. If investors rule out the potential for the S&P 500 to lose 50-60% of its value over the completion of this cycle, they’re actually ruling out an outcome that would be wholly run-of-the-mill from a historical perspective, given current valuation extremes. They’re also ignoring that my previous risk estimates in prior cycles were devastatingly correct. Disciplined investing isn't easy (and whenever it seems like it is, you're about to learn a costly lesson). The market has been in a more than two-year top-formation with internals lagging the major indices, with investors chasing high-beta stocks (those with amplified sensitivity to market fluctuations), and with rather shallow corrections from a full-cycle perspective. All of that has been a headwind for value-conscious hedged-equity strategies, but it won’t prevent the completion of this market cycle. Indeed, our impression is that the recent swing by investors from active to passive investment strategies represents nothing but performance-chasing, at a point where valuations imply historically low prospective 12-year returns for a conventional portfolio mix. If history is a guide, nobody will remember the patience, discipline, and tolerance for frustration that were required to avoid or to benefit from the 50-60% market loss that we estimate over the completion of this cycle. A focus on market internals may help, but even the less-extended 2000 and 2007 peaks were frustrating for us. As John Kenneth Galbraith wrote decades ago about the Great Crash, “Only a durable sense of doom could survive such discouragement.” Meanwhile, distinguish full-cycle outcomes from immediate outcomes. They can often be two quite different objects. While MarketCap/GVA is an apples-to-apples measure with a correlation of about 94% with actual subsequent 12-year S&P 500 total returns, the ratio of market capitalization to GDP compensates for its slightly lower reliability by providing a more extended historical view. The completion of every market cycle in history has taken this ratio at least 40% below present levels, and generally much lower. The chart below shows MarketCap/GDP on an inverted log scale (blue line, left scale) versus actual subsequent 12-year S&P 500 average annual total returns (red line, right scale). Current valuations are consistent with expectations of S&P 500 nominal total returns averaging scarcely 1% annually over the coming 12-year horizon. Outside of value-conscious, historically-informed, risk-managed, full-cycle investment disciplines, I’m not terribly excited about the 10-12 year investment prospects for either stocks or bonds. But given a 10-year Treasury yield of 2.6%, I expect Treasury bonds to outperform the S&P 500 over that horizon.
Internals deteriorate further As for recent market action, under cover of a negligible pullback in the S&P 500 last week, our measures of market internals deteriorated materially. Notably, declines on the NYSE outpaced advances by nearly 2-to-1, an imbalance that’s usually associated with a weekly market loss closer to -1.5%; corporate debt weakened; the number of issues registering new lows expanded past levels last seen when the major indices were materially lower; and Friday registered a high-volume reversal characteristic of previous buying climaxes. A week ago, we observed the single most extreme syndrome of “overvalued, overbought, overbullish” conditions we identify (see Speculative Extremes and Historically Informed Optimism); a secondary signal at a level on the S&P 500 4% higher than the syndrome we observed in July. With the exception of set of signals in late-2013 and early-2014 (when market internals remained uniformly favorable as a result of Fed-induced yield-seeking speculation), an overextended syndrome this extreme has only emerged at the market peaks preceding the worst collapses in the past century. Prior to the advance of recent years, the list of these instances was: August 1929, the week of the bull market peak; August 1972, after which the S&P 500 would advance about 7% by year-end, and then drop by half; August 1987, the week of the bull market peak; July 1999, just before an abrupt 12% market correction, with a secondary signal in March 2000, the week of the final market peak; and July 2007, within a few points of the final peak in the S&P 500, with a secondary signal in October 2007, the week of that bull final market peak. Last week also produced enough internal dispersion to generate a confirmed “Hindenburg Omen.” I discussed this widely-misunderstood signal the last time we observed it (see the section of my August 10, 2015 comment titled “When Hindenburg Omens are Ominous”). That instance was quickly followed by a decline of over 11% in the S&P 500 over the next two weeks. Part of that discussion is reprinted below: “I’ve frequently noted that Hindenburg ‘Omens’ in their commonly presented form (NYSE new highs and new lows both greater than 2.5% of issues traded) appear so frequently that they have very little practical use, especially when they occur as single instances. While a large number of simultaneous new highs and new lows is indicative of some amount of internal dispersion across individual stocks, this situation often occurs in markets that have been somewhat range-bound. Still, when we think of market ‘internals,’ the number of new highs and new lows can contribute useful information. To expand on the vocabulary we use to talk about internals, ‘leadership’ typically refers to the number of stocks achieving new highs and new lows; ‘breadth’ typically refers to the number of stocks advancing versus declining in a given day or week; and ‘participation’ typically refers to the percentage of stocks that are advancing or declining in tandem with the major indices. “The original basis for the Hindenburg signal traces back to the ‘high-low logic index’ that Norm Fosback created in the 1970’s. Jim Miekka introduced the Hindenburg as a daily rather than weekly measure, Kennedy Gammage gave it the ominous name, and Peter Eliades later added several criteria to reduce the noise of one-off signals, requiring additional confirmation that amounts to a requirement that more than one signal must emerge in the context of an advancing market with weakening breadth. Those refinements substantially increase the usefulness of Hindenburg Omens, but they still emerge too frequently to identify decisive breakdowns in market internals. However, one could reasonably infer a very unfavorable signal about market internals if leadership, breadth, and participation were all uniformly negative at a point where the major indices were still holding up. Indeed, that’s exactly the situation in which a Hindenburg Omen becomes ominous.” As I noted in the August 2015 instance, a situation where fewer than 60% of stocks are above their 200-day average typically defines sufficiently weak participation to give a confirmed Hindenburg Omen substantial bite. Currently, that figure is about 68%, so intrepid speculators insistent on scaling past Dow 20,000, red flags be damned, can at least monitor participation. For our part, it turns out that these syndromes also typically bite when we observe unfavorable market action on our own measures. In contrast, we observed several instances in 2013 and early-2014 that were not accompanied by broader internal deterioration or weak participation, and those signals were ineffective. Suffice it to say that under most conditions, Hindenburg signals in their raw form are of little use, but when they are complemented by other measures of internal dispersion and extremely overvalued, overbought, overbullish syndromes, they do tend to live up to the “omen” part. Emphatically, our pointed concerns about market risk would quickly ease to a neutral outlook if our measures of market internals were to become favorable. Again, the reason is that overvaluation typically gives way to sharp market losses only during segments of the market cycle when investors have subtly shifted toward risk-aversion. Since risk-seeking speculators tend to be indiscriminate about that speculation, the best measure we’ve found to infer those risk-seeking or risk-averse preferences is the uniformity or divergence of market action across a broad range of internals. So while our long-term (10-12 year) expectations for S&P 500 returns remain near zero, and we now expect a 50-60% market retreat over the completion of this cycle (an outcome that would be only run-of-the-mill from present valuation extremes), our expectations about more immediate market outcomes will remain heavily driven by the quality of market action we observe at each point in time. Presently, those measures are hostile, which is why we’ve got red flags waving, but a shift toward favorable uniformity across our measures of market internals would defer those concerns. Put simply, market conditions don’t forecast or require a near-term market collapse. Rather, they are currently permissive of a market collapse, and on average, market returns under such conditions have historically been quite negative until those conditions have cleared. The next regular comment will be the week of January 9, though I'll post a brief update over the holidays if market conditions require. Wishing you a wonderful Christmas, a bright Hanukkah, and a joyful New Year! - John The foregoing comments represent the general investment analysis and economic views of the Advisor, and are provided solely for the purpose of information, instruction and discourse. Please see periodic remarks on the Fund Notes and Commentary page for discussion relating specifically to the Hussman Funds and the investment positions of the Funds. --- The foregoing comments represent the general investment analysis and economic views of the Advisor, and are provided solely for the purpose of information, instruction and discourse. Prospectuses for the Hussman Strategic Growth Fund, the Hussman Strategic Total Return Fund, the Hussman Strategic International Fund, and the Hussman Strategic Dividend Value Fund, as well as Fund reports and other information, are available by clicking "The Funds" menu button from any page of this website. |
|||||||||||||||||||||||||
|
For more information about investing in the Hussman Funds, please call us at
1-800-HUSSMAN (1-800-487-7626) 513-326-3551 outside the United States Site and site contents © copyright Hussman Funds. Brief quotations including attribution and a direct link to this site (www.hussmanfunds.com) are authorized. All other rights reserved and actively enforced. Extensive or unattributed reproduction of text or research findings are violations of copyright law. Site design by 1WebsiteDesigners. |

