
|
|
||||||
|
|

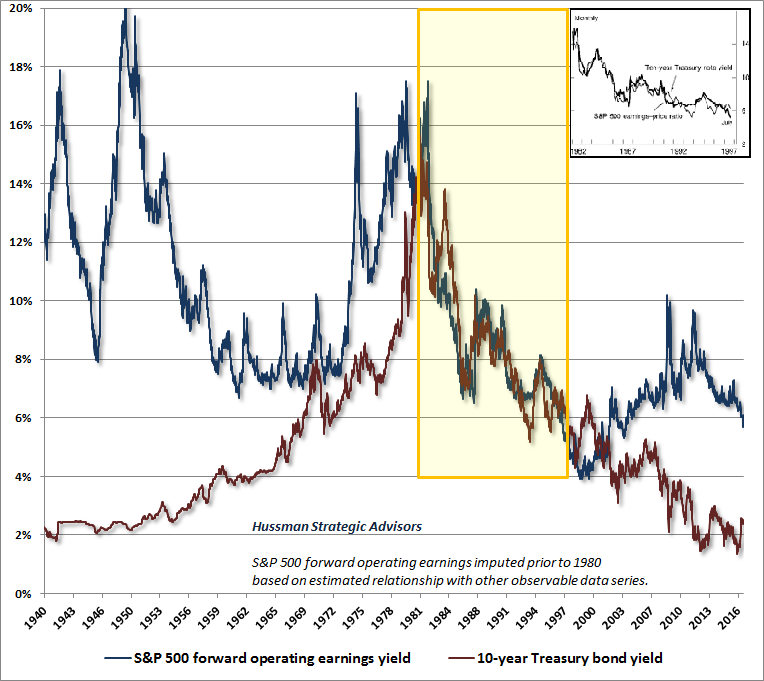
March 6, 2017 The Most Broadly Overvalued Moment in Market History "The issue is no longer whether the current market resembles those preceding the 1929, 1969-70, 1973-74, and 1987 crashes. The issue is only - are conditions like October of 1929, or more like April? Like October of 1987, or more like July? If the latter, then over the short-term, arrogant imprudence will continue to be mistaken for enlightened genius, while studied restraint will be mistaken for stubborn foolishness. We can't rule out further short-term gains, but those gains will turn bitter... Let's not be shy: regardless of short-term action, we ultimately expect the S&P 500 to fall by more than half, and the Nasdaq by two-thirds. Don't scoff without reviewing history first." - John P. Hussman, Ph.D., Hussman Econometrics, February 9, 2000 "On Wall Street, urgent stupidity has one terminal symptom, and it is the belief that money is free. Investors have turned the market into a carnival, where everybody 'knows' that the new rides are the good rides, and the old rides just don't work. Where the carnival barkers seem to hand out free money just for showing up. Unfortunately, this business is not that kind - it has always been true that in every pyramid, in every easy-money sure-thing, the first ones to get out are the only ones to get out... Over time, price/revenue ratios come back in line. Currently, that would require an 83% plunge in tech stocks (recall the 1969-70 tech massacre). The plunge may be muted to about 65% given several years of revenue growth. If you understand values and market history, you know we're not joking." - John P. Hussman, Ph.D., Hussman Econometrics, March 7, 2000 On Wednesday, the consensus of the most reliable equity market valuation measures we identify (those most tightly correlated with actual subsequent S&P 500 total returns in market cycles across history) advanced within 5% of the extreme registered in March 2000. Recall that following that peak, the S&P 500 did indeed lose half of its value, the Nasdaq Composite lost 80% of its value, and the tech-heavy Nasdaq 100 Index lost an oddly precise 83% of its value. With historically reliable valuation measures beyond those of 1929 and lesser peaks, capitalization-weighted measures are essentially tied with the most offensive levels in history. Meanwhile, the valuation of the median component of the S&P 500 is already far beyond the median valuations observed at the peaks of 2000, 2007 and prior market cycles, while our estimate for 10-12 year returns on a conventional 60/30/10 mix of stocks, bonds, and T-bills fell to a record low last week, making this the most broadly overvalued moment in market history. There is a quick, knee-jerk response floating around these days, which asserts that “stocks are still cheap relative to interest rates.” This argument is quite popular with investors who haven’t spent much time getting their hands dirty with historical data, satisfied to repeat verbal arguments they’ve heard elsewhere as a substitute for analysis. It’s even an argument we recently heard, almost inexplicably, from one investor we’ve regularly agreed with at market extremes over several decades (more on that below). In 2007, as the market was peaking just before the global financial crisis, precisely the same misguided assertions prompted me to write Long-Term Evidence on the Fed Model and Forward Operating P/E Ratios. See also How Much Do Interest Rates Affect the Fair Value of Stocks? from May of that year. Let’s address this argument once again, in additional detail. Valuations and interest rates There’s no question that interest rates are relevant to the fair valuation of stocks. After all, a security is nothing but a claim to some future stream of cash flows that will be delivered into the hands of investors over time. The higher the price an investor pays for a given stream of future cash flows, the lower the long-term return the investor can expect to earn as those cash flows are received. Conversely, the lower the long-term return an investor can tolerate, the higher the price they will agree to pay for that stream of future cash flows. If interest rates are low, it’s not unreasonable to expect that investors would accept a lower expected future return on stocks. If rates are high, it’s not unreasonable to expect that investors would demand a higher expected future return on stocks. The problem is that investors often misinterpret the form, reliability, and magnitude of this relationship, and become confused about when interest rate information is needed and when it is not. Specifically, given a set of expected future cash flows and the current price of the security, one does not need any information about interest rates at all to estimate the long-term return on that security. The price of the security and the cash flows are sufficient statistics to calculate that expected return. For example, if a security that promises to deliver a $100 cash flow in 10 years is priced at $82 today, we immediately know that the expected 10-year return is (100/82)^(1/10)-1 = 2%. Having estimated that 2% return, we can now compare it with competing returns on bonds, to judge whether we think it’s adequate, but no knowledge of interest rates is required to “adjust” the arithmetic. There are three objects of interest here: the current price, the future stream of expected cash flows, and the long-term rate of return that converts one to the other. Given any two of these, one can estimate the third. For example, given a set of expected future cash flows and some “justified” return of the investor’s choosing, one can use those two pieces of information to calculate the price that will deliver that desired expected return. If I want a $100 future payment to give me a 5% future return over 10 years, I should be willing to pay no more than $100/(1.05)^10 = $61.39. So when you want to convert a set of expected cash flows into an acceptable price today, interest rates may very well affect the “justified” rate of return you choose. But if you already know the current price, and the expected cash flows, you don’t need any information about prevailing interest rates in order to estimate the expected rate of return. One does not have to “factor in” the level of interest rates when observable valuations are used to estimate prospective long-term market returns, because interest rates are irrelevant to that calculation. The only thing that interest rates do at that point is to allow a comparison of the expected return that’s already baked in the cake with alternative returns available in the bond market. The Fed Model is an artifact of just 16 years of history There’s an additional problem. While it’s compelling to believe that the expected return on stocks and bonds should have a one-to-one relationship, history doesn’t bear that out at all. Indeed, over the past century, the correlation between bond and stock yields has historically gone in the entirely wrong direction except during the inflation-disinflation cycle from about 1970 to 1998. What investors may not realize is that the correlation between interest rates and earnings yields (as well as dividend yields) has been negative since 1998. Investors across history have not been consistent at all in treating stocks and bonds as closely competing substitutes. As I noted during the bubbles that ended in 2000 and 2007, the problem with the Fed Model (which compares the S&P 500 forward operating earnings yield with the 10-year Treasury yield) is that this presumed one-to-one relationship between stock and bond yields is wholly an artifact of the disinflationary period from 1982 to 1998. The stock market advance from 1982 to 1998 represented one of the steepest movements from deep secular undervaluation to extreme secular overvaluation in stock market history. Concurrently, bond yields declined as inflation retreated from high levels of the 1970’s. What the Fed Model does is to overlay those two outcomes and treat them as if stocks were “fairly valued” the entire time. The chart below shows the S&P 500 forward operating earnings yield alongside the 10-year Treasury bond yield. The inset of the chart is the chart that appeared in Alan Greenspan’s 1997 Humphrey Hawkins testimony, and is the entire basis upon which the Fed Model rests. The same segment of history is highlighted in the yellow block. Notice that this is the only segment of history in which the presumed one-to-one relationship actually held.
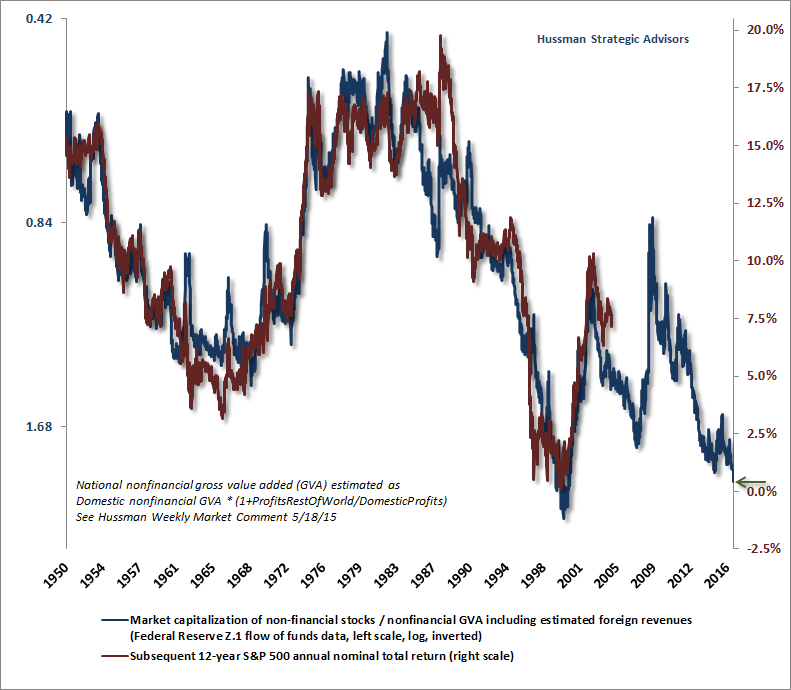
Descriptive versus predictive The Fed Model is not a fair-value relationship, but an artifact of a specific disinflationary segment of market history. It is descriptive of yield behavior during that limited period, but it has a very poor predictive record with regard to actual subsequent market returns. When investors assert that stocks are “fairly valued relative to interest rates,” they are essentially invoking the Fed Model. What they seem to have in mind is that regardless of absolute valuation levels, stocks can be expected to achieve acceptably high returns as long as the S&P 500 forward operating earnings yield is higher than the 10-year Treasury yield. No, no. That’s not how any of this works, and we have a century of evidence to show it. The deep undervaluation of stocks in 1982 was followed by glorious subsequent returns. The steep overvaluation of stocks in 1998 was followed by one crash, then another, which left S&P 500 total returns negative for more than a decade. I fully expect that current valuations, which are within a breath of 2000 extremes on the most historically reliable measures, will again result in zero or negative returns over the coming 10-12 years. Let’s dig into some data to detail the basis for those expectations. First, a quick note on historically reliable valuation measures. The value of any security is based on the long-term stream of cash flows that it can be expected to deliver over decades and decades. While corporate earnings are certainly required to generate future cash flows, current earnings (or even forward earnings) are very poor “sufficient statistics” for that stream of cash flows. That’s true not only because of fluctuations in profit margins over the economic cycle, but also due to very long-term competitive forces that exert themselves over multiple economic cycles. From the standpoint of historical reliability, valuation measures that dampen or mute the impact of fluctuating profit margins dramatically outperform measures based on current earnings. Indeed, even the Shiller CAPE, which uses a 10-year average of inflation-adjusted earnings, provides substantially better results when one also adjusts for the embedded profit margin (the denominator of the CAPE / S&P 500 revenues). For a brief primer on the importance of implied profit margins in evaluating market valuations, see Two Point Three Sigmas Above the Norm and Margins, Multiples, and the Iron Law of Valuation. The chart below shows the ratio of nonfinancial market capitalization to corporate gross value-added, including estimated foreign revenues. I created this measure, MarketCap/GVA, as an apples-to-apples alternative to market capitalization/GDP that matches the object in the numerator with the object in the denominator, and also takes foreign revenues into account. We find this measure to be better correlated with actual subsequent S&P 500 total returns than any other measure we’ve studied in market cycles across history, including price/earnings, price/forward earnings, price/book, price/dividends, enterprise value/EBITDA, the Fed Model, Tobin’s Q, market cap/GDP, the NIPA profits cyclically-adjusted P/E (CAPE), and the Shiller CAPE. MarketCap/GVA is shown below on an inverted log scale (blue line, left scale), along with the actual subsequent 12-year total return of the S&P 500 (red line, right scale). From current valuations, which now rival the most extreme levels in U.S. history, we estimate likely S&P 500 nominal total returns averaging less than 1% annually over the coming 12-year horizon. As a side note, we tend to prefer a 12-year horizon because that is the point where the autocorrelation profile of valuations drops to zero, and is therefore the horizon over which mean reversion is most reliable (see Valuations Not Only Mean-Revert, They Mean-Invert).
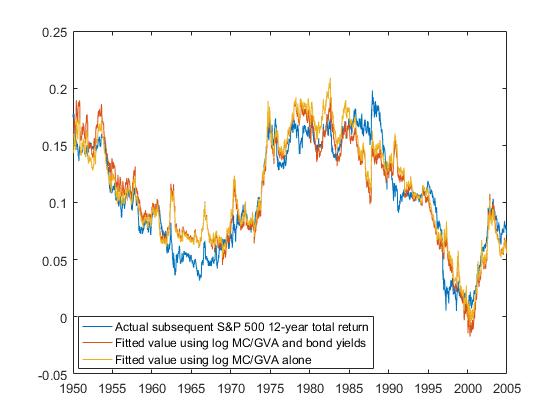
I’m often asked why we don’t “adjust” MarketCap/GVA for the level of interest rates. The answer, as detailed at the beginning of this comment, is that given both the price of a security, and the expected stream of future expected cash flows (or a sufficient statistic for those cash flows), one does not need any information at all about interest rates in order to estimate the expected long-term return on that security. Each point in the chart below shows the actual 12-year subsequent total return of the S&P 500 index, along with two fitted values, one using MarketCap/GVA alone, and the other including the 10-year Treasury bond yield as an additional explanatory variable. That additional variable adds absolutely no incremental explanatory power. Both fitted values have a 93% correlation with actual subsequent 12-year S&P 500 total returns.
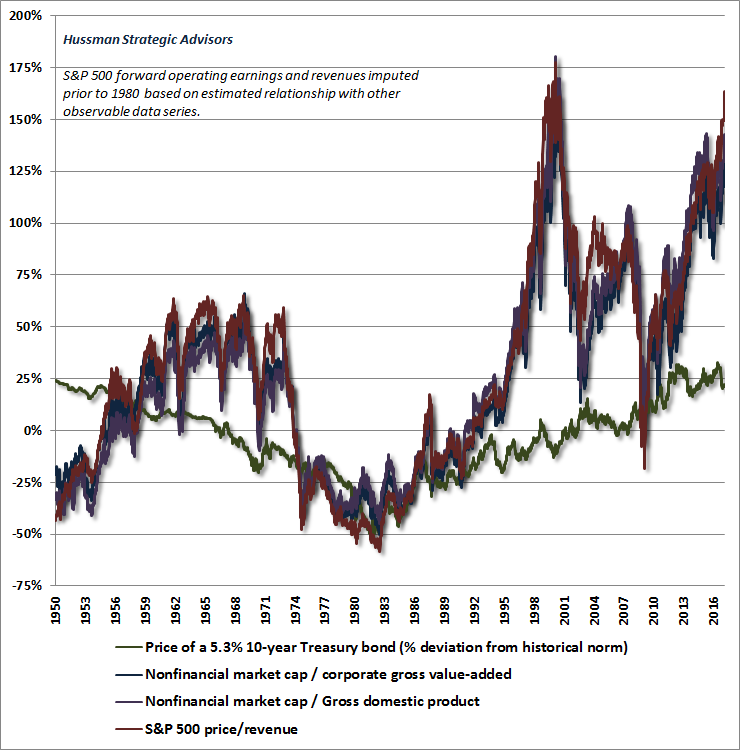
We’re now in a position to say something very precise about current valuations and interest rates. Given the present level of interest rates, investors who are willing to accept likely prospective nominal total returns on the S&P 500 of less than 1% over the coming 12-year period are entirely welcome to judge stocks as “fairly valued relative to interest rates.” But understand that this is precisely what that phrase implies here. Moreover, as one can see from the foregoing charts, there’s not a single market cycle in history, neither in the period before the 1970’s (when interest rates regularly hovered near current levels), nor in recent decades, that has failed to raise prospective 10-12 year S&P 500 total returns to the 8-10% range or beyond over the completion of that cycle. So even if investors are willing to accept 10-12 year total returns of next to nothing, they should also be fully prepared for an interim market loss on the order of 50-60%, because that is the decline that would now be required to restore those 8-10% return expectations, without even breaking below historical valuation norms. It’s important for investors to recognize how extreme market valuations have become. The chart below shows the valuation measures we find best correlated with actual subsequent S&P 500 total returns, shown as percentage deviations from their historical norms, along the premium of the 10-year Treasury to its own historical norm. While yields on U.S. Treasury bonds were regularly below current levels prior to the 1960’s, the yield on a 10-year constant maturity Treasury bond has averaged about 5.3% since 1940. At current interest rates, a 5.3% coupon bond would currently trade about 20% above its historical norm. If you’re willing to adjust your expected return on stocks downward on an equivalent basis over the coming decade, I have no objection to pricing that kind of premium into stocks, relative to their historical norms. But a premium of that magnitude comes nowhere close to justifying valuations that pushed beyond 160% above those norms last week.
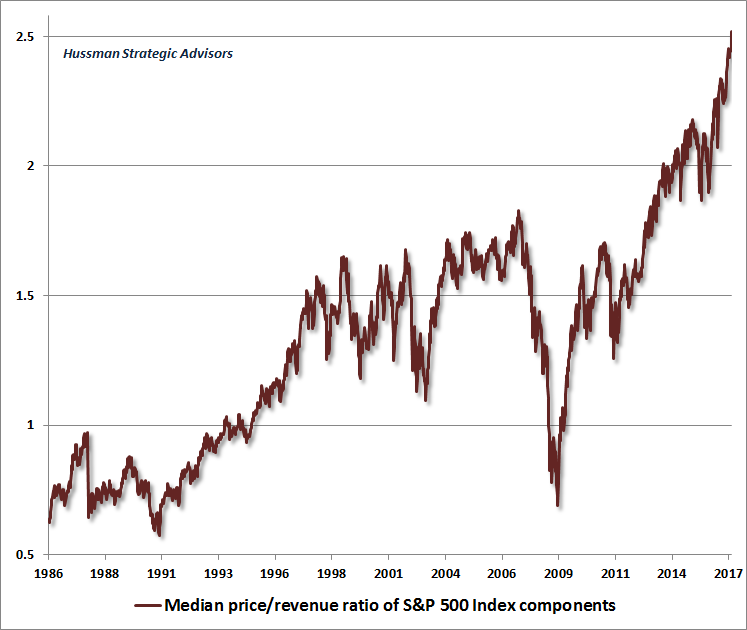
Recall that the 2000 market peak was dominated by breathtaking overvaluation among a subset of very large capitalization stocks, while the broader market was less extreme, particularly among smaller capitalization issues. That didn’t prevent the S&P 500 Index from losing half of its value, or the Nasdaq 100 Index from losing 83% of its value, but it did create the basis for a long period of relative outperformance by small cap stocks. By contrast, we presently observe, by far, the most extreme median valuations in history. The chart below shows the median valuation of S&P 500 components, which is now well beyond levels observed at the 2000 and 2007 market peaks.
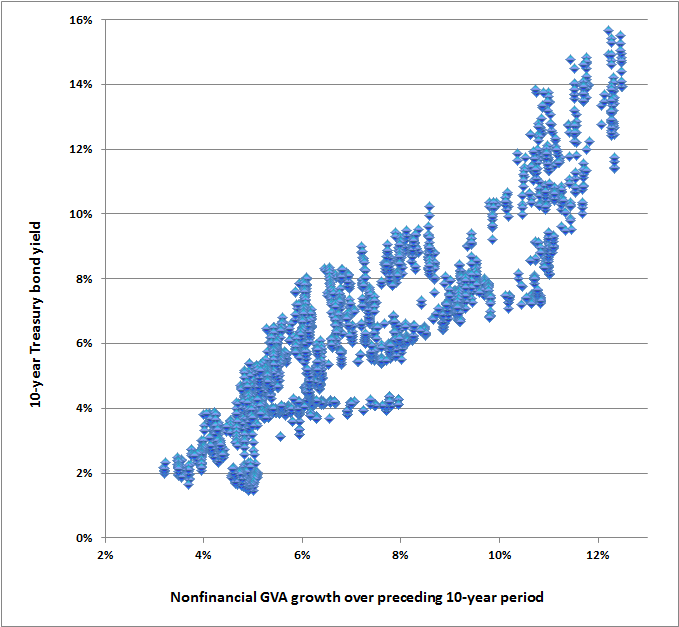
From a stock pricing perspective, it’s also important to understand that if investors expect interest rates to remain depressed forever, they should also be pricing in low nominal economic growth forever. The fact is that variations in those two factors have historically canceled out, which is another reason why the relationship between reliable valuation measures and actual subsequent S&P 500 total returns are largely unaffected by those variations. The chart below plots the 10-year Treasury yield versus the nominal growth of nonfinancial gross value-added (essentially U.S. corporate revenues) over the preceding decade, in data since the 1940’s. Whatever assumption one makes for nominal growth in corporate fundamentals over the coming decade, one should make the same assumption about future interest rates, and vice versa.
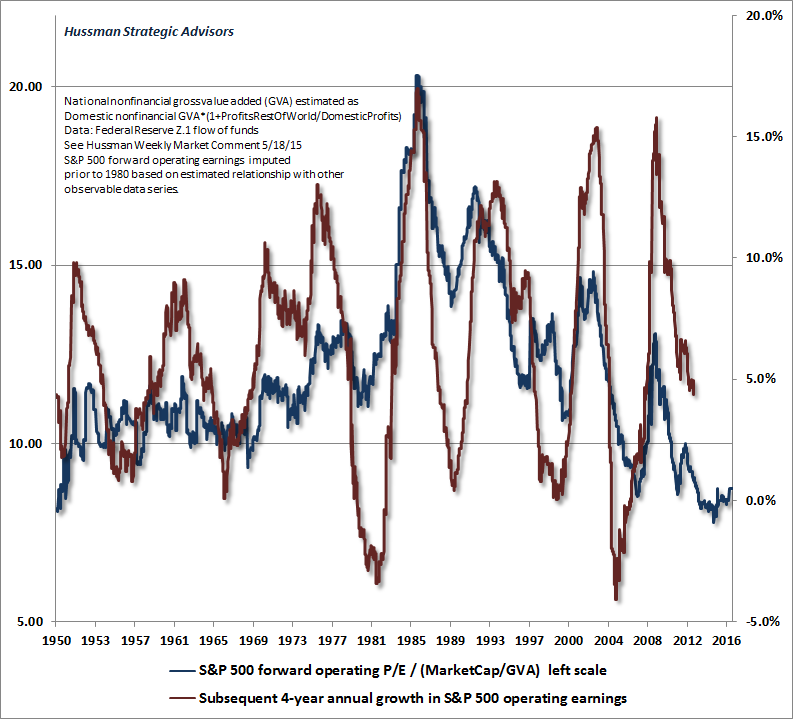
So understand that there is no historical basis to expect that a rebound in nominal growth will occur without also observing substantially higher interest rates. Rather, the level of interest rates a decade from now will be strongly determined by the nominal economic growth we observe between now and then. A note on earnings dynamics Investors often ask why we don’t place more weight on forward operating P/E ratios. Presently, the S&P 500 P/E on the basis of next year’s estimated operating earnings is about 18. That’s high, but certainly not far beyond double historical norms, which is what we observe from better-performing valuation measures. One has to remember that “forward earnings” came into common use during the tech bubble, as an “alternative” valuation measure to actual 12-month trailing earnings (which include “bad stuff” like actual losses that are regularly classified as “extraordinary”). By the 1990’s, investors had become used to the fact that a normal P/E on trailing earnings was about 14-15, and have kept that figure in their heads as a “normal” P/E, even though forward operating earnings typically run an average of nearly 35% above trailing earnings, while current estimates are about 50% higher than trailing figures. The fact is that prior to the late-1990’s bubble, the median forward operating P/E for the S&P 500 in imputed data since 1940 is actually less than 11 (which agrees with estimates by Cliff Asness at AQR). But using the correct median is easy to address. The reason we still would not rely on forward P/E ratios, as noted above, is that stocks are not a claim on next year’s earnings, but a stream of payments that will be delivered over decades. Earnings-based measures, unadjusted for their embedded profit margins, are quite poor “sufficient statistics” for those long-term cash flows. It’s easy to demonstrate that these measures have substantially weaker correlations with actual subsequent market returns than a variety of more robust measures we’ve presented over time, such as MarketCap/GVA. Because profit margins are systematically elevated at cyclical economic peaks, raw earnings-based measures invariably reassure investors that extreme stock market levels are really not as dangerous as they seem. As Ben Graham warned decades ago, “The purchasers view the good current earnings as equivalent to ‘earning power’ and assume that prosperity is equivalent to safety.” To illustrate this recurring phenomenon, the chart below presents the S&P 500 forward operating P/E as a ratio to MarketCap/GVA (blue line). The interpretation here is that when the blue line is very low, as it is today, market valuations appear much more attractive on a P/E basis than on measures that are less vulnerable to profit margin fluctuations. Conversely, when the blue line is high, it indicates that market valuations appear more expensive on a P/E basis than on other measures. The red line shows the actual subsequent 4-year annual growth of S&P 500 operating earnings. Notice that when stocks look “cheap” on forward earnings, relative to other measures, operating earnings growth tends to collapse over the subsequent 4-year period.
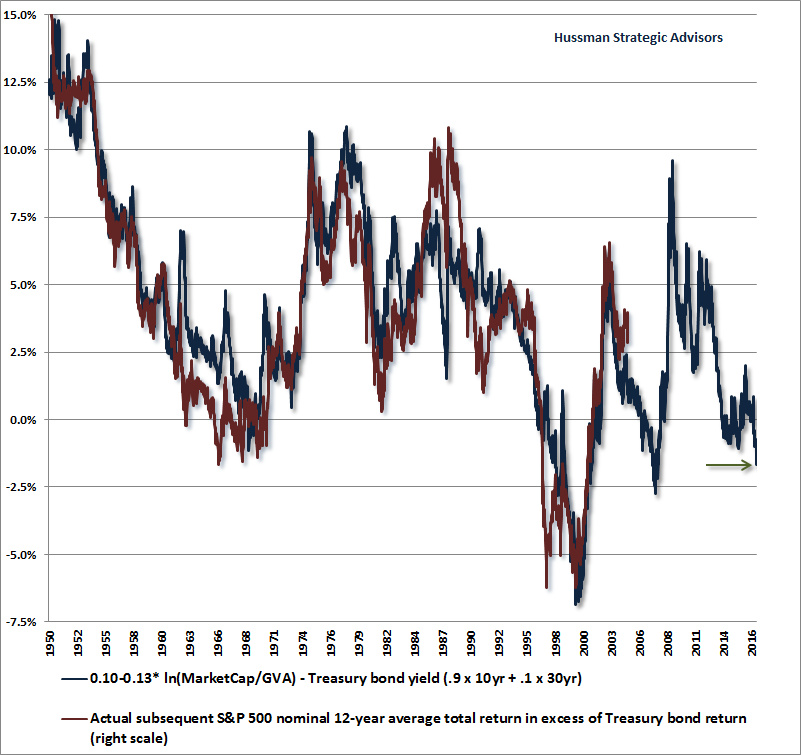
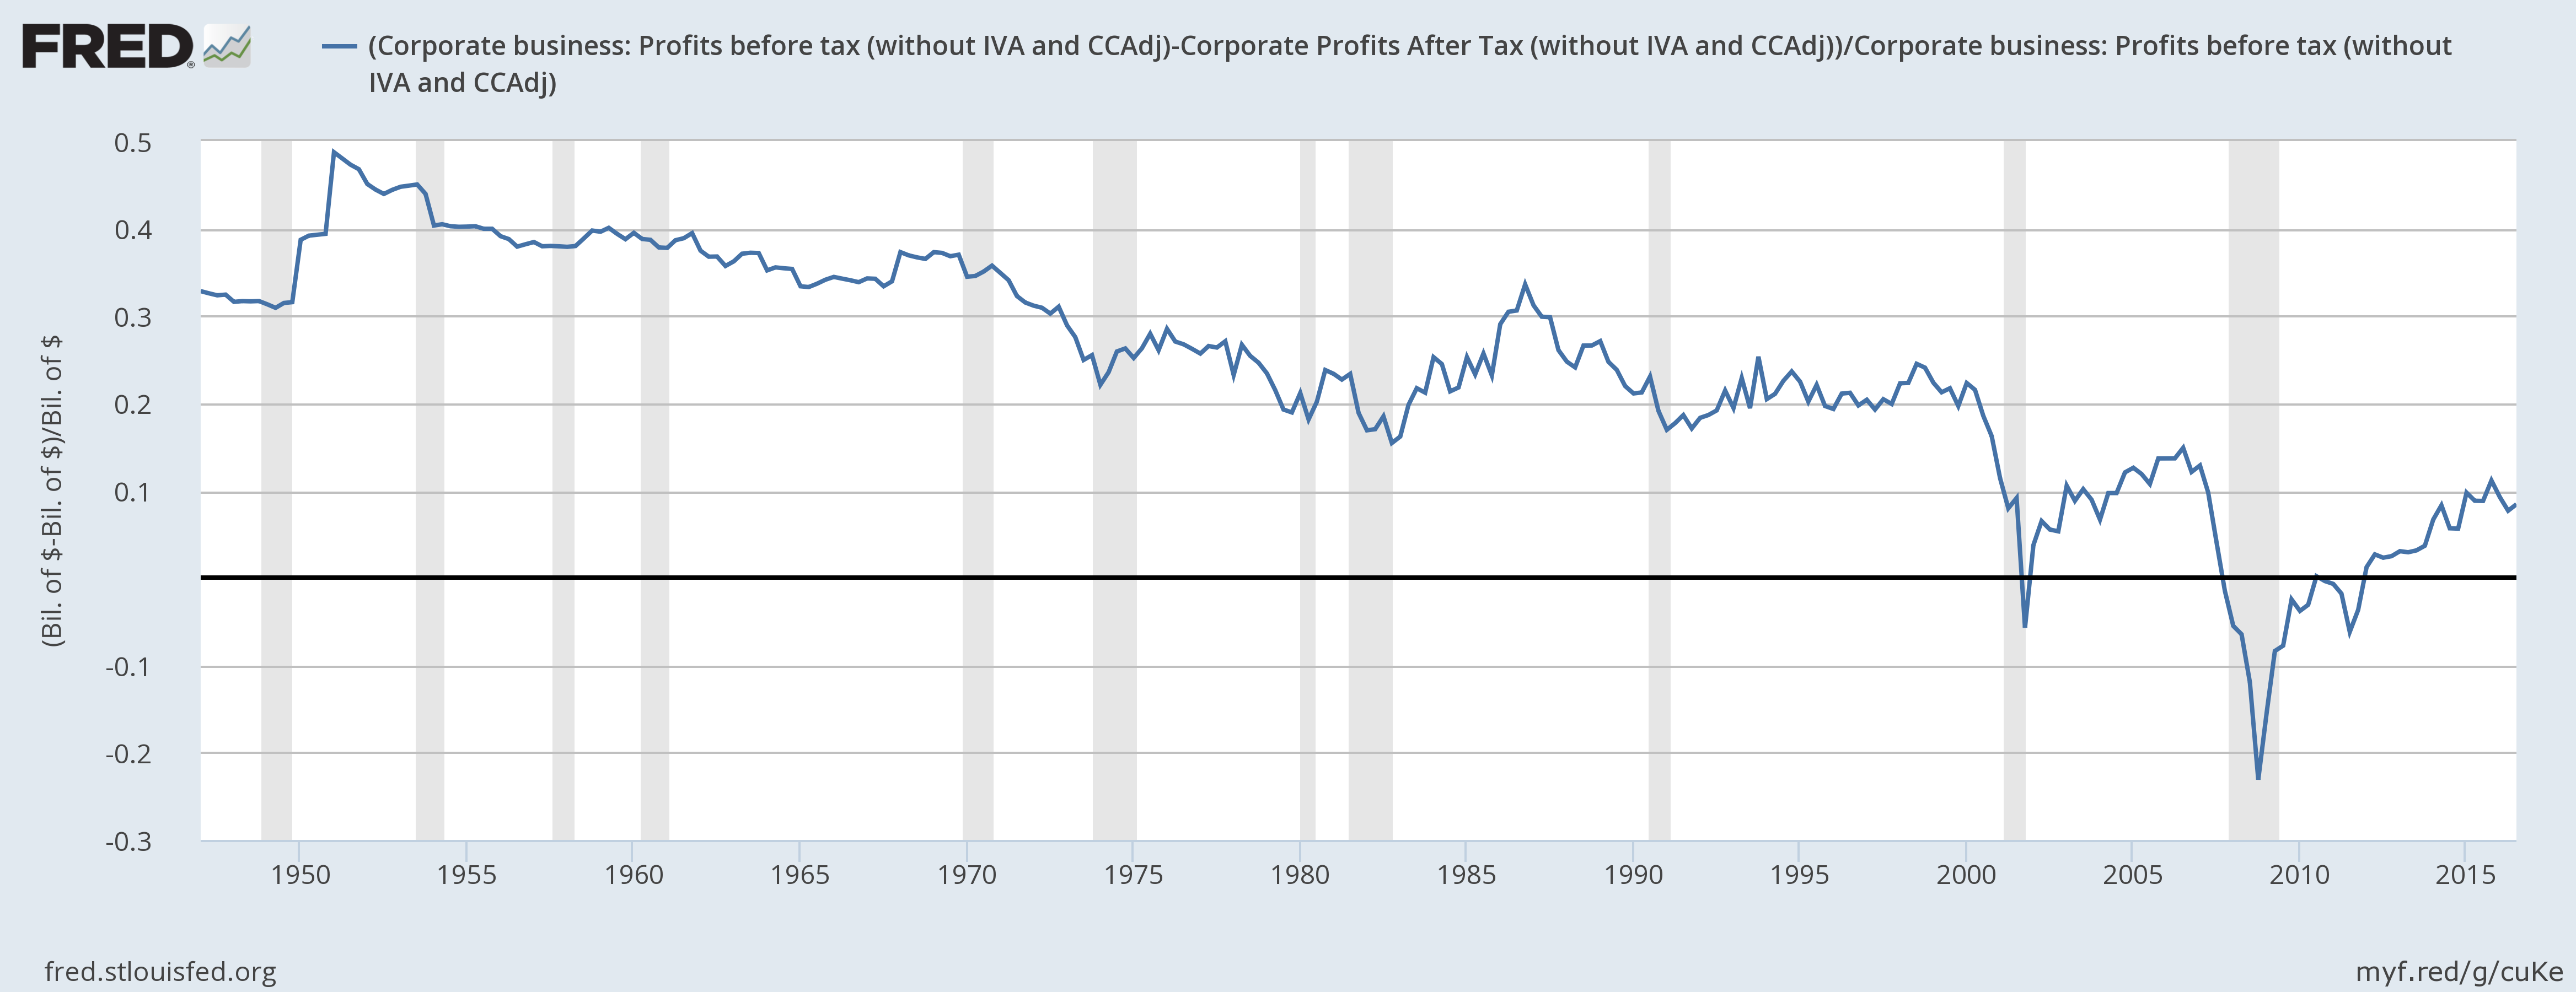
At present, corporations have benefited because wages and salaries as a share of GDP are near record lows, while nonfinancial corporate debt is at a record high ratio to revenues (about double the historical norm, even after netting out cash). This leaves margins vulnerable to any normalization in either the wage share or interest rates. Finally, while there’s a lot of enthusiasm over the potential for tax cuts to boost after-tax earnings, the fact is that the effective U.S. corporate tax rate (what corporations actually pay as a fraction of pre-tax profits) is already near the lowest level in history outside of recessionary periods, and earnings would benefit rather little even from quite a sharp reduction in tax rates. With reduced labor force slack, upward interest rate pressure, and little room for further reduction in effective taxes, we expect that this is as good as it gets. Indeed, the data suggest that investors should not be at all surprised to see S&P 500 operating earnings lower in 4 years than they are today. Mapping current valuations to subsequent expected returns To understand why good valuation measures are so reliable in projecting 10-12 year market returns, a little bit of arithmetic is useful, which I detailed formally in Rarefied Air: Valuations and Subsequent Market Returns. The essential idea is that the return investors obtain from stocks over a given holding period is a function of initial valuations, terminal valuations at the end of the period, and the growth rate of fundamentals in the interim. Given the relationships I’ve outlined above, think carefully about how this works. Rapid growth in fundamentals over a given decade is systematically associated with higher interest rates at the end of that decade. Moreover, because rapid growth also often reflects transient cyclical expansion or contraction in profit margins, investors tend to split the difference except in their most reckless moments (like today). Specifically, following periods of rapid growth and expanding profit margins, they tend to be more conservative with the multiples they assign to stocks, and following periods of weak growth and contracting profit margins, they tend to be more generous. Interest rate movements reinforce these effects. The combined outcome is that periods of rapid growth in fundamentals tend to be associated with lower terminal valuations at the end of a given decade, while periods of dismal growth in fundamentals tend to be associated with richer terminal valuations. In short, total returns are driven by initial valuations, terminal valuations, and the growth rate of fundamentals in the interim. As detailed above, unexpected fluctuations in growth and terminal valuations over a 10-12 year holding period tend to systematically cancel each other out. As a result, it turns out that initial valuations alone are reliable in projecting S&P 500 total returns over that horizon. As for real returns, equity market valuations provide very little information about future inflation, so while they certainly do well in projecting real investment returns, there’s no particular advantage to the additional inflation adjustments. For reasons detailed above, we’ve found it best to estimate nominal total returns directly, and then subtract a well-formed estimate of inflation that relies on a broader information set. Still, see the final chart of my November 30, 2015 comment for a scatterplot of the robust relationship between MarketCap/GVA and subsequent real S&P 500 total returns. On a related note, investors who feel compelled to use interest rate information to adjust the implications of reliable valuation measures should do so as I outlined at the beginning of this comment. First, use the valuation measures to estimate prospective 10-12 year total returns, then subtract the observed level of interest rates of that maturity (or a blended average that approximates it). The result is the amount by which the S&P 500 can be expected to outperform or underperform Treasury securities over the chosen horizon. The approximate projection for S&P 500 annual total returns on a 12 year horizon is 0.10 - 0.13 x ln(MC/GVA). The chart below shows this “excess return” estimate (blue) versus the actual performance of the S&P 500 versus Treasury bonds over the following 12-year period (red). It will come as no surprise that at present valuations, we expect the S&P 500 total return to underperform Treasury yields by about -2% annually over the coming 12-year horizon. The correlation between projected and actual returns here is 93%, which strikingly exceeds the reliability of any variant of the Fed Model we’ve tested over time.
Who are you, and what have you done with Warren Buffett? Back in 2001, Warren Buffett gave an interview with Carol Loomis in Fortune Magazine, and made the following observations: “I was no good then at forecasting the near-term movements of stock prices, and I’m no good now. I never have the faintest idea what the stock market is going to do in the next six months, or the next year, or the next two. “But I think it is very easy to see what is likely to happen over the long term. Ben Graham told us why: ‘Though the stock market functions as a voting machine in the short run, it acts as a weighing machine in the long run.’ Fear and greed play important roles when votes are being cast, but they don’t register on the scale. “A stock is a financial instrument that has a claim on future distributions made by a given business, whether they are paid out as dividends or to repurchase stock or to settle up after sale or liquidation. These payments are in effect ‘coupons.’ The set of owners getting them will change as shareholders come and go. But the financial outcome for the business’ owners as a whole will be determined by the size and timing of these coupons. Estimating those particulars is what investment analysis is all about. “On a macro basis, the quantification doesn’t have to be complicated at all. Below is a chart, starting almost 80 years ago and really quite fundamental in what it says. The chart shows the market value of all publicly traded securities as a percentage of the country’s business; that is, as a percentage of GNP. The ratio has certain limitations in telling you what you need to know. Still, it is probably the best single measure of where valuations stand at any given moment. And as you can see, nearly two years ago the ratio rose to an unprecedented level. That should have been a very strong warning signal.” Warren Buffett on the Stock Market, Fortune Magazine, December 10, 2001 I’ve always shared Buffett’s respect for Ben Graham and value-conscious investing. Indeed, and at market extremes, we’ve almost always been in agreement about valuations. That was certainly true during the tech bubble. After the 2000-2002 collapse, we shifted to a constructive outlook on stocks, not because stocks had become deeply undervalued, but because the sufficiently large retreat in valuations during prior years was joined, in early-2003, by early improvement in our measures of market action. By late-2006, our market outlook had become quite negative, and I wrote two pieces on Buffett, largely defending continued adherence to a value-focused investment discipline. One piece, When Value Mavens Lag, observed that the performance of value-conscious investors has typically been least impressive just before the market itself has fallen into a long period of dull and often negative returns. See, value investing relies on a certain amount of mean reversion, and at points where the market is at speculative extremes, the most overvalued stocks - precisely those that are not included in a value investor’s portfolio - have yet to experience that mean reversion. As a consequence, value portfolios will typically have already lagged large-cap glamour stocks for some period of time at the point that a speculative market reaches its peak. The pattern then tends to reverse during periods of market weakness. The following week, I wrote Why Warren Buffett Plays Bridge, which includes one of my favorite passages from Ben Graham on the long-term importance of informed discipline, rather than the constant attempt to win every hand. I wrote: “Aside from an affection for cheeseburgers and cherry Coke, one of the personal facts commonly known about Warren Buffett is his love of bridge, which he periodically plays online with Bill Gates. “Why bridge? Though Graham wasn't talking about Buffett at the time, he offers a clue: ‘I recall to those of you who are bridge players the emphasis that bridge experts place on playing a hand right rather than on playing it successfully. Because, as you know, if you play it right you are going to make money and if you play it wrong you lose money - in the long run. There is a beautiful little story about the man who was the weaker bridge player of the husband-and-wife team. It seems he bid a grand slam, and at the end he said very triumphantly to his wife ‘I saw you making faces at me all the time, but you notice I not only bid this grand slam but I made it. What can you say about that?' And his wife replied very dourly, ‘If you had played it right you would have lost it.' “It seems to me (and it has certainly been my experience) that it takes an enormous amount of restraint to focus on playing every investment hand ‘right,’ according to an established discipline, allowing the law of averages to work in your favor, rather than trying to win every hand. I would guess that this is exactly what appeals to Warren Buffett's temperament. Over the long-term, good investing requires it.” By May 2007, my views had become much the same as they are today, and I wrote, “we can't have any assurance that the market will roll over into a bear market next week, next month, next quarter or even next year. But we can have reasonable confidence that markets will continue to cycle between great optimism and great despair. With stocks at over 18 times top-of-channel earnings on record profit margins, with the major indices at multi-year highs, with short-term trends easily through the upper Bollinger bands at the monthly, weekly and daily frequencies, with 54.3% of advisors bullish and only 19.6% bearish according to the latest Investors Intelligence figures, and with 10-year Treasury yields higher than they were 6 months ago, it should be reasonably easy to determine which extreme the market more closely resembles at present.” In the quarters that followed, the stock market would collapse. By late-October 2008, the S&P 500 was down more than 40% from its peak. If you’ve studied the charts earlier in this comment, you can see the substantial improvement in valuations at the time. Buffett’s outlook turned positive, and so did ours. Given the improvement in market valuations, I wrote Why Warren Buffett is Right (and Why Nobody Cares), observing: “The best way to begin this comment is to reiterate that U.S. stocks are now undervalued. I realize how unusual that might sound, given my persistent assertions during the past decade that stocks were strenuously overvalued (with a brief exception in 2003). Still, it is important to understand that a price decline of over 40% (and even more in some indices) completely changes the game. Last week, we also observed early indications of an improvement in the quality of market action, and an easing of the upward pressure on risk premiums.” Here’s where the story takes a detour. Had I simply stuck with that constructive shift and extended that record, most of you would be running for your lives from market risk right now. But I made a critical mistake, in hindsight, and it’s important to recognize that it had nothing to do with the reliability of our valuation methods. See, the collapse in the economy that accompanied the global financial crisis was so out-of-sample relative to post-war data that I insisted on stress-testing our own classification methods against Depression-era data (when valuations similar to those observed in 2009 were followed by a further two-thirds loss in the stock market). The classification methods that resulted from that stress-testing made our methods robust to Depression-era outcomes and holdout data, but inadvertently bared an Achilles Heel in the face of zero interest rate policy, and took us until 2014 to fully address (see Portfolio Strategy and the Iron Laws for a detailed narrative). Absent that challenging period, I doubt that anyone would find my present market outlook, in the face of historically obscene valuations, as either controversial or inconsistent with the identical concerns I expressed in 2000 and 2007. Which brings us to the present. Last week, Warren Buffett himself made the jaw-dropping suggestion that the market was “cheap relative to interest rates.” Now, if you understand a century of market history, and Buffett’s own investment decisions over time, the most obvious conclusion is that Warren has been abducted and replaced by either an imposter or a highly sophisticated yet folksy robot. My friend Jesse Felder has a simpler explanation, which is that Buffett strongly prefers not to disrupt the markets to the downside. In a piece titled Why Warren Buffett is So Reluctant to Call Stocks a ‘Bubble’ Jesse mentions the 2001 Fortune article and writes, “What you need to know about Mr. Buffett, though, is that he was eager to share this warning signal with investors only well after stocks had peaked. In fact, the Nasdaq Composite had already crashed by more than 70% before the words above were published. It’s true that he did make an earlier warning in Fortune but both articles were the products of the enterprising (or kindhearted - I’ll let you choose) reporter Carol Loomis who learned of Buffett’s private worries about the stock market and convinced him to make them public.” Two years ago, as the broad market was about 10% below current levels, Alice Schroeder, who authored a book on Buffett titled The Snowball, also observed, “in private he has been more negative, at least with me, about the economy, money-printing, employment, than he is in public.” Buffett has always expressed an admiration for the U.S. economy, and for long-term investment in the equity market. Knowing that every share of stock outstanding has to be held by someone at every point in time, he undoubtedly recognizes that there is no way for investors, in aggregate, to avoid market risk. My impression is that he has decided that he’s not going to be the guy who busts their bubble. To the extent that Buffett is now in the commendable process of divesting his holdings for the benefit of charity, one might even view his reluctance to rock this boat to be protective of that legacy - provided that investors aren’t encouraged by his words to take investment positions they can’t tolerate holding over the completion of this market cycle and for a very, very, long time thereafter. For our part, we’ve always given more weight to a century of observable evidence than to anyone’s verbal arguments, even those who we hold in high esteem. Still, as long as investors are comfortable with expected S&P 500 10-12 year total returns of less than 1% annually, with likely interim losses on the order of 50-60%, investors are free to label this situation as “fairly valued” or with any other phrase they wish.The foregoing comments represent the general investment analysis and economic views of the Advisor, and are provided solely for the purpose of information, instruction and discourse. Please see periodic remarks on the Fund Notes and Commentary page for discussion relating specifically to the Hussman Funds and the investment positions of the Funds. --- The foregoing comments represent the general investment analysis and economic views of the Advisor, and are provided solely for the purpose of information, instruction and discourse. Prospectuses for the Hussman Strategic Growth Fund, the Hussman Strategic Total Return Fund, the Hussman Strategic International Fund, and the Hussman Strategic Dividend Value Fund, as well as Fund reports and other information, are available by clicking "The Funds" menu button from any page of this website. |
|||||||||||||||||||||||||
|
For more information about investing in the Hussman Funds, please call us at
1-800-HUSSMAN (1-800-487-7626) 513-326-3551 outside the United States Site and site contents © copyright Hussman Funds. Brief quotations including attribution and a direct link to this site (www.hussmanfunds.com) are authorized. All other rights reserved and actively enforced. Extensive or unattributed reproduction of text or research findings are violations of copyright law. Site design by 1WebsiteDesigners. |

