|
|
||||||
|
|

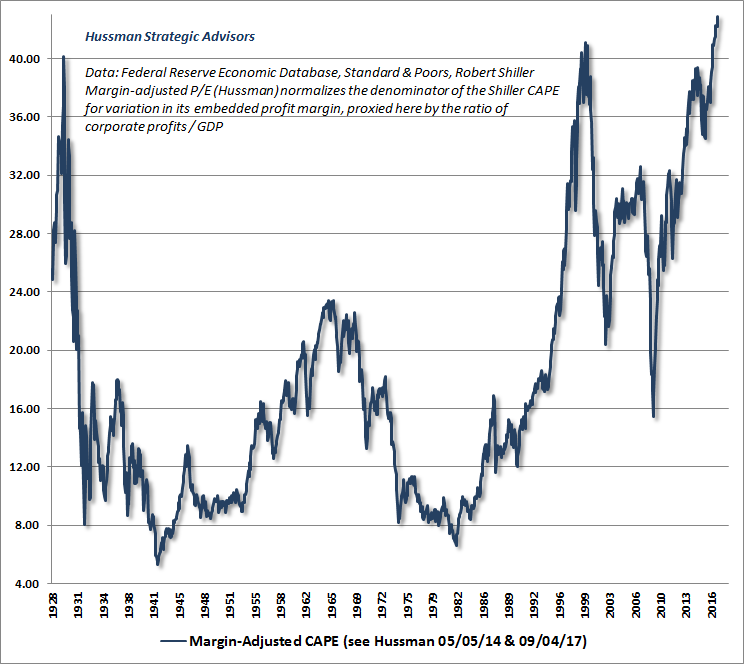
October 2, 2017 Blissful Delusion The present moment of blissful delusion is remarkable to witness. Take it in. A few words and updated charts will do. The first chart below updates our variant of Robert Shiller’s cyclically-adjusted P/E (CAPE), where we’ve adjusted the measure to account for variation in the embedded profit margin; an adjustment that substantially improves the correlation of the resulting measure with actual subsequent market returns across history. Few investors recognize that one of the reasons why valuation multiples were so rich in 2000 is that profit margins were actually below historical norms at the time. It's also worth noting that the benefit of normalizing the embedded profit margin comes not just from muting margins that are above historical norms, but also from normalizing margins in periods where they are below historical norms.
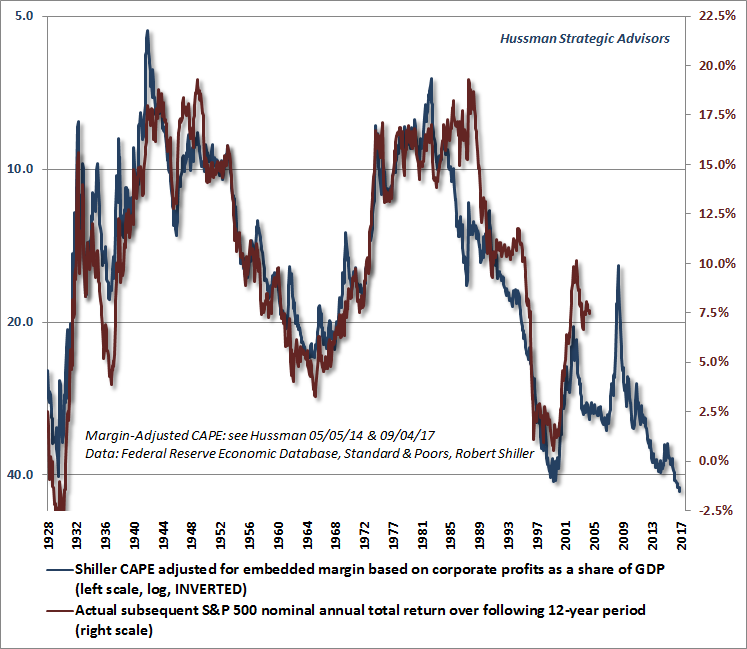
The next chart shows the margin-adjusted CAPE on an inverted log scale (left, blue line), along with the actual subsequent S&P 500 nominal average annual total return over the subsequent 12-year period (right, red line).
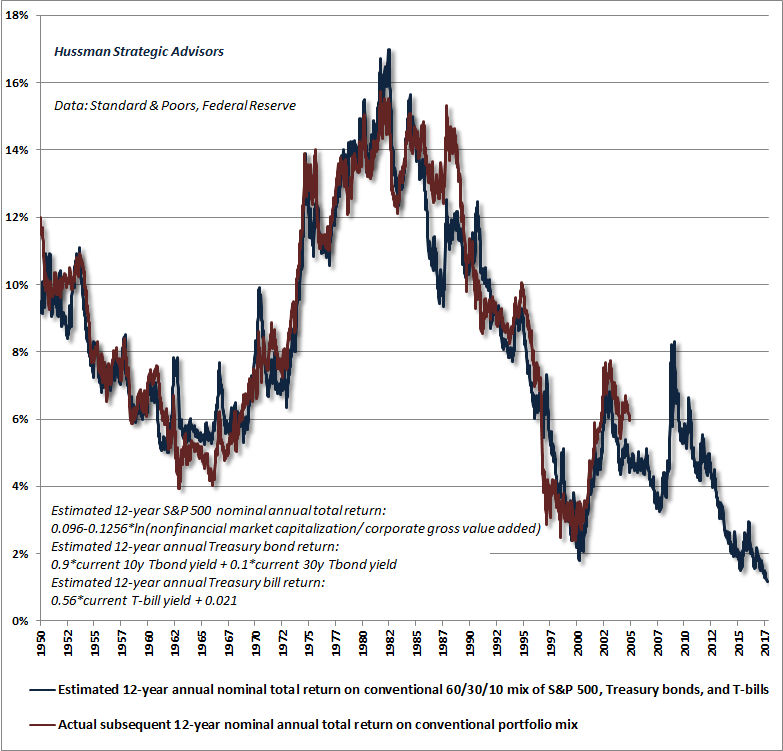
The next chart updates our best estimate of the likely 12-year prospective total return on a conventional portfolio mix invested 60% in the S&P 500 Index, 30% in Treasury bonds, and 10% in Treasury bills. The current projection is the lowest in history, and I expect these weak passive investment returns, as they unfold, to trigger a rather broad crisis of pension underfunding in the years ahead. To estimate the S&P 500 component here, we’re using another measure I’ve introduced over time: the ratio of nonfinancial market capitalization to corporate gross value-added (including estimated foreign revenues).
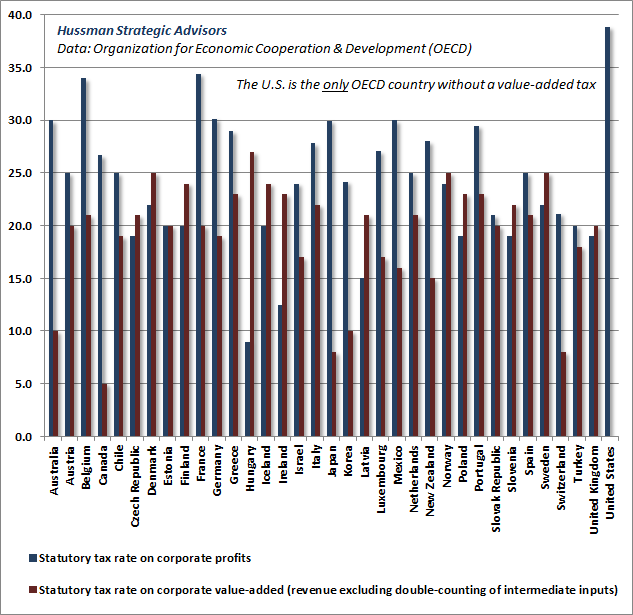
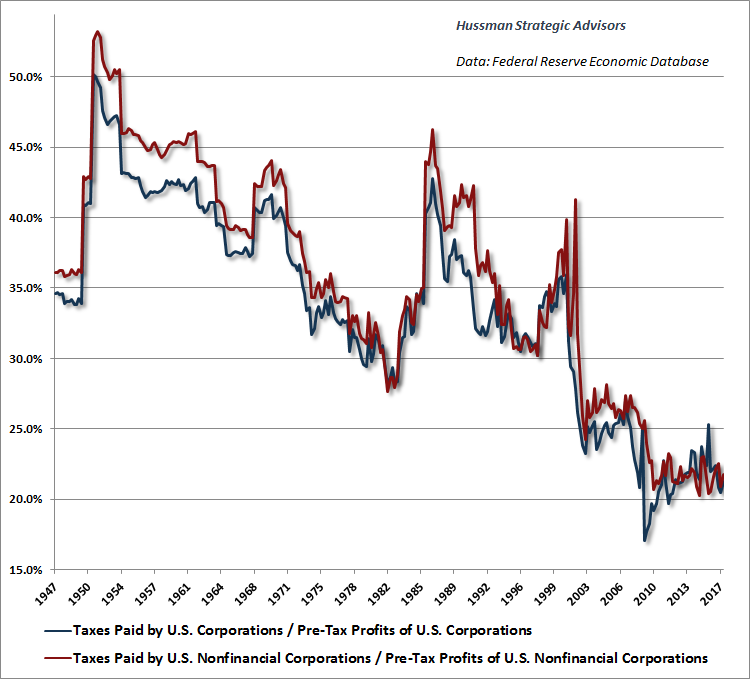
While we’re on the subject of corporate gross value-added (which essentially measures corporate revenues without double-counting intermediate inputs), I’ll add that another feature of Wall Street’s blissful delusion is the notion that “U.S. corporate taxes are the highest in the world.” It’s striking how disingenuous this claim is. The fact is that among all OECD countries, the U.S. is also the only country that does not levy any tax at all on corporate value-added in the production of goods and services.
Without getting deep into the relative merits and challenges of a value-added tax, suffice it to say that 1) the “incidence” of a value-added tax (whether it’s paid by consumers in the form of higher prices, or corporations in the form of lower profits) varies depending on the demand and supply characteristics of each sector, and 2) because a value-added tax tends to be “regressive” all by itself (hitting lower income individuals proportionally more since it functions much like a tax on sales), the appropriate way to introduce a value-added tax is to require additional features of the tax code such as low-income exclusions. Countries can also use policies such as tax credits for investment, R&D, job training, and other arrangements to strengthen incentives for productive investment and job creation. The main point is this. The argument that U.S. taxes on corporate profits are somehow oppressive relative to other countries is an apples-to-oranges comparison. It wholly ignores that the U.S. levies no value-added tax on corporations at all, whereas the value-added tax is the principal revenue source for most other countries. The rhetoric on corporate taxes here is unfiltered effluvium. The chart below presents a clearer picture of U.S. corporate profits taxation. Actual taxes paid by U.S. companies, as a share of pre-tax profits, have never been lower, outside of the depths of the global financial crisis.
As for the stock market, understand that total annual U.S. corporate taxes presently amount to only about 1.2% of current U.S. equity market capitalization, and even if a cut was to pass, it would be unlikely to endure for more than a few administrations. The potential effect of even a substantial percentage reduction in statutory rates for several years is quite small when the present value of the tax reduction is compared with existing equity market capitalization. The likely cumulative impact comes to just a few percent of stock market value. Against that, consider that the most reliable market valuation measures we identify (as measured by their correlation with actual subsequent S&P 500 total returns in market cycles across history) are currently between 2.5 and 2.7 times their historical norms (that is, 150% to 170% above those norms). Put simply, it seems misguided to imagine that “tax reform” will somehow make the most obscene speculative bubble in U.S. history something other than the most obscene speculative bubble in U.S. history. Corporations are already enjoying strikingly light tax burdens from a historical perspective, and investors are already paying extreme valuation multiples on elevated earnings. We are observing an episode that will make future investors wince. Just like the two closest analogs, the 1929 high and the tech bubble, I expect that future investors will shake their heads in wonder at the stark raving madness of it all, and ask what Wall Street could possibly have been thinking. In any event, I've shared what I see as my truth, and I experience no need to change anyone's mind. I remain content to abide our value-conscious, historically-informed, full-cycle discipline, and to follow our path. Others are free to continue along their own.--- The foregoing comments represent the general investment analysis and economic views of the Advisor, and are provided solely for the purpose of information, instruction and discourse. Prospectuses for the Hussman Strategic Growth Fund, the Hussman Strategic Total Return Fund, the Hussman Strategic International Fund, and the Hussman Strategic Dividend Value Fund, as well as Fund reports and other information, are available by clicking "The Funds" menu button from any page of this website. |
|||||||||||||||||||||||||
|
For more information about investing in the Hussman Funds, please call us at
1-800-HUSSMAN (1-800-487-7626) 513-326-3551 outside the United States Site and site contents © copyright Hussman Funds. Brief quotations including attribution and a direct link to this site (www.hussmanfunds.com) are authorized. All other rights reserved and actively enforced. Extensive or unattributed reproduction of text or research findings are violations of copyright law. Site design by 1WebsiteDesigners. |