
Up & Down Wall Street
Up & down Wall Street: Alan Abelson
Barron's Magazine, Chicopee MA
Volume 78, Issue 25, Page 3-4, ISSN: 10778039
Jun 22, 1998
----------------------------------------------------------------------
BESIDES SHOWERING RICHES ON THE AVERAGE man in the Street and fueling perhaps the most satisfying economic expansion in history-a boom without tears - this greatest of all bull markets has completely reformulated truisms that investors have lived - and sometimes died - by, ever since the Buttonwood Tree was a spindly sapling.
For example, remember the ancient maxim: Bulls make money, bears make money, but pigs never do? The new, improved version is: Bulls make money, bears make money, but pigs make more money than anyone.
Another old cautionary chestnut, "Where are the customers' yachts?" has been properly updated to "Where are the customers' yachts? Why, out there in the deep water, where the really big boats are moored."
And the hoary story about the customer, after frantically accumulating a stock until his buying pushes the price clear out of sight, triumphantly ordering his broker to sell, prompting the broker's famous reply: "To whom?" is hopelessly passe. Even the greenest rookie broker knows that no matter how improbably a stock has appreciated and what absurdly inflated levels it has reached, there's always a momentum investor out there cheerfully waiting to buy it.
The glorious bull move that began back in late '90, indeed has made a mockery of the very idea of an overvalued market. Relying on such venerable yardsticks as price-to-book and dividend yield has proved a surefire way to avoid making money. Even that old reliable price/earnings multiple - it pains us to admit, has been worse than useless as an investment guide.
Which doesn't surprise John Hussman. John is an adjunct assistant professor of economics and international finance at the University of Michigan - but don't be dismayed; his other job is running Hussman Econometrics Advisors, where he manages money for individuals and institutions (he's an equal-opportunity money manager).
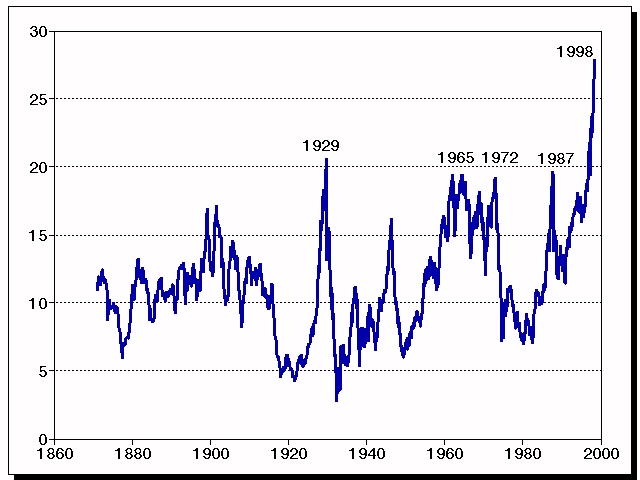
John is the creator of the unorthodox measure of valuation depicted in the accompanying chart. What it shows is the multiple of peak earnings at which the market is selling, from investment antiquity to the present. The vintage data, in case you wondered, are courtesy of the Cowles Commission, as preserved by the National Bureau of Economic Research, while the more recent years' prices and earnings are for the S&P 500.
Going to Extremes
Price / Peak Earnings
The reason John isn't surprised that the standard P/E multiple hasn't been much help in determining whether the market's too high is that he rightly espies some of the hazards inherent in the ratio, notably the volatile nature of earnings and that the ratio is often highest when profits are most depressed.
By way of illustration, he cites May 1992, when the P/E topped 25 on the S&P and a whopping 50 on the Dow. Yet, as he notes, since then stocks have returned nearly 20% a year, on average. Those sky-high multiples in the spring of '92 reflected not terribly elevated stock prices but the impact of the previous recession, which had slashed Dow earnings to a third, and S&P earnings to half, of their previous peaks.
Usually what happens, John relates, is that when earnings recover to new highs, multiples shrink accordingly. Historically, record profits have translated into an average P/E on the S&P of 12, while as long as anyone was keeping score, the market never sold at more than 20 times peak earnings. Until today, that is, when the S&P fetches 27 times earnings.
To filter out what he calls "short term noise in earnings," and get a measure that affords a better fix on what kind of prospective returns one can expect from stocks, John calculated the market's P/E using the highest earnings posted over the preceding decade. The chart on the previous page plots the market's price/record earnings going back to 1875, which, as you doubtless recall, was the last of the great years for stocks of buggy whip makers.
That not inconsiderable stretch, John observes, "includes many periods in which inflation was lower and earnings growth higher than now." And gazing at that line marching erratically across a century, he notes that the current price/record earnings is far above any of the extremes that have preceded major market plunges. Which he finds scary and so do we.
Those extremes include August 1929 and August 1987, when, in both instances, the market sold at 20 times record high earnings. In '29, what followed was an 85.9% drop, in '87, a fall of only 30% (but in less time than it takes to get through to your broker). In January 1962, April 1965 and December 1972, the market sold at 19 times peak earnings and the respective swoons were 23.4%, 14.1% and 46.2%. After reaching 18 times record earnings in November 1968, the S&P tumbled 32.9%.
In each case, John comments, those cloud-busting multiples were followed by extended periods in which stocks underperformed Treasury bills. After the '87 unpleasantness, to pick an epoch in which at least some of you may have been sentient, not until December 1991 did stocks begin to outstrip T-bills.
As a glance at the graphic informs, John's ratio has been through the ozone barrier for a couple of years now - and stock prices have continued to levitate merrily. To be precise, since the price/record earnings multiple on the S&P topped 20 in November 1996, the index has shot up by nearly 50%. Does that mean simply that any overvalued market can always get ever more overvalued?
Evidently not a man easily given to blinking, John readily concedes that "overvaluation" as measured by price/peak earnings hasn't kept the market from hurtling further into the wild blue yonder. But, he explains, there have been times when stocks have been extravagantly overvalued and still have performed well, if - and this is the proverbial big if - earnings have been good, inflation benign, interest rates subdued and the technical trends, especially breadth, favorable. And these "supporting trends," as he dubs them, have been just that in recent years. In the past, a seriously overvalued market took gas only after one or more of these props weakened.
What bothers him now is that in contrast to the past several years, some of the valuation offsets are getting more than a tad wobbly. Earnings growth is one, market breadth, another. Moreover, the combination of surging demand at home and collapsing demand in Asia, besides making the Fed sweat a little (it's about time those guys earned their money), has blurred the outlook somewhat for inflation as well as profits.
Given what his price/peak earnings tells him about the market's current valuation (stomach-churningly high) and his perception that several of the supporting investment elements that have so far made valuations irrelevant are starting to break down, what's he doing with the portfolios in his care?
Well, John replied, as of last Thursday, in those accounts that have the choice of being in stock or cash, he's only 40% invested. Which, he quickly added, was low. He might go even more heavily into cash, if interest rates rise. For those accounts that are, by mandate, always fully invested, he is soundly hedged with put options and the like.
In short, he has been battening down the hatches.
--------------------------------------------------------------------------------
Reproduced with permission of the copyright owner. Further reproduction or distribution is prohibited without permission.
---
The foregoing comments represent the general investment analysis and economic views of the Advisor, and are provided solely for the purpose of information, instruction and discourse.
Prospectuses for the Hussman Strategic Growth Fund, the Hussman Strategic Total Return Fund, the Hussman Strategic International Fund, and the Hussman Strategic Dividend Value Fund, as well as Fund reports and other information, are available by clicking "The Funds" menu button from any page of this website.
Estimates of prospective return and risk for equities, bonds, and other financial markets are forward-looking statements based the analysis and reasonable beliefs of Hussman Strategic Advisors. They are not a guarantee of future performance, and are not indicative of the prospective returns of any of the Hussman Funds. Actual returns may differ substantially from the estimates provided. Estimates of prospective long-term returns for the S&P 500 reflect our standard valuation methodology, focusing on the relationship between current market prices and earnings, dividends and other fundamentals, adjusted for variability over the economic cycle (see for example Investment, Speculation, Valuation, and Tinker Bell, The Likely Range of Market Returns in the Coming Decade and Valuing the S&P 500 Using Forward Operating Earnings ).


