|
|
||||||
|
|

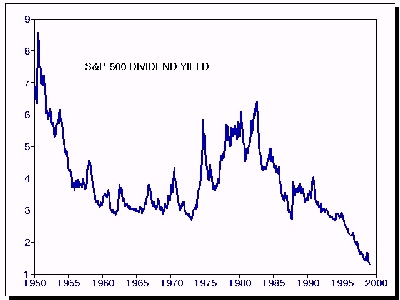
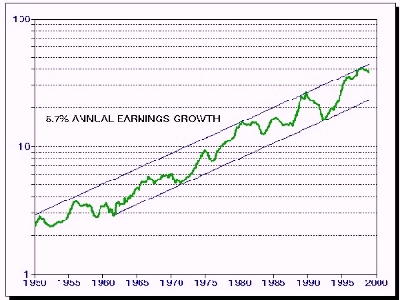
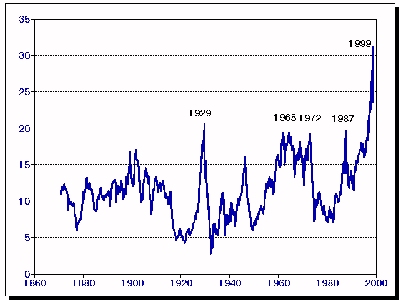
The Importance of Measuring Returns Peak-to-Peak One of the reasons that stocks appear so attractive at the peak of a bull market is that most investors fail to properly measure long-term growth. At the top of a bull market, the returns earned by the market since the previous trough are tempting to extrapolate into the indefinite future. At the bottom of a bear market decline, the amount lost from peak-to-trough appears so devastating that investors are often induced to sell at what is actually an extraordinary buying opportunity. Conversely, the returns from short-selling or option hedges appear misleadingly enticing when measured only from market peak-to-trough, and misleadingly bleak when measured only from market trough-to-peak. The most consistent and reliable estimate of long-term growth is obtained by measuring from peak- to-peak over several market cycles. While the average U.S. stock peaked in April 1998 and has failed to recover, the capitalization weighted indices such as the S&P 500 have reached marginal new highs in recent weeks, making the current bull market advance (late 1990-1999) the longest in history. The previous record was set by the 1921-1929 advance. Historically, bull market advances have averaged 3.75 years, during which time stocks rise at an average rate of 28% annualized. Bear market declines average 1.25 years in duration, during which time stocks fall at an average rate of about -28% annualized. If you combine the two, it happens that the average full market cycle is 5 years in duration, and generates an average total return of about 10.9% over the entire cycle. It is that rate of return, not the isolated trough-to-peak or peak-to- trough rates, that a buy-and-hold investor has typically achieved. The historical 10.9% stock market return breaks down into exactly three parts: Historically, stocks have offered an average dividend yield of about 3.8%. Earnings growth has been highly variable from year to year, but measured peak-to-peak or trough-to-trough, earnings have demonstrated remarkable long-term consistency at 5.7% annual growth since 1950 (slightly slower prior to WWII). This leaves roughly 1.4% of historical long-term returns which can be attributed to past expansion in the Price/Earnings multiple (i.e. over the past 50 years, prices have grown somewhat faster than the 5.7% average rate of earnings growth). From an analytical perspective, nothing affects the stock market except by affecting these three factors: dividend payouts, earnings growth, and P/E ratios. The primary effect of interest rates is on the P/E ratio. Falling interest rates encourage falling earnings yields (higher P/E ratios). Rising interest rates encourage rising earnings yields (lower P/E ratios). These effects are strongest when P/E ratios begin at extreme levels. If you understand this, you also understand why the market faces extreme danger now, and perhaps for several years into the future:
Add these factors together, and investors face a long term total return of 7% annually if P/E multiples remain fixed at record highs, and earnings grow along the peak of their long-term growth channel. If the P/E contracts toward normal levels instead, stocks may very well underperform Treasury bills for more than a decade (as they did from 1965 through 1986). Investors are often urged to "Think long term". Ironically, this has come to mean "Hold stocks regardless of their prices or prospective returns". It is precisely because we do think long-term that we find the prospective returns of the market insufficient to justify the risks here. An unhedged, fully invested position is no longer appropriate. Note: The foregoing article appeared in April 1999 and does not necessarily reflect the current investment position of the Hussman Funds. For weekly market commentary regarding our current investment stance and perspectives, please visit our home page.
--- The foregoing comments represent the general investment analysis and economic views of the Advisor, and are provided solely for the purpose of information, instruction and discourse. Prospectuses for the Hussman Strategic Growth Fund, the Hussman Strategic Total Return Fund, the Hussman Strategic International Fund, and the Hussman Strategic Dividend Value Fund, as well as Fund reports and other information, are available by clicking "The Funds" menu button from any page of this website. |
||||||||||||||||||||||||||||||||||
|
For more information about investing in the Hussman Funds, please call us at
1-800-HUSSMAN (1-800-487-7626) 513-326-3551 outside the United States Site and site contents © copyright Hussman Funds. Brief quotations including attribution and a direct link to this site (www.hussmanfunds.com) are authorized. All other rights reserved and actively enforced. Extensive or unattributed reproduction of text or research findings are violations of copyright law. Site design by 1WebsiteDesigners. |