|
|
||||||
|
|

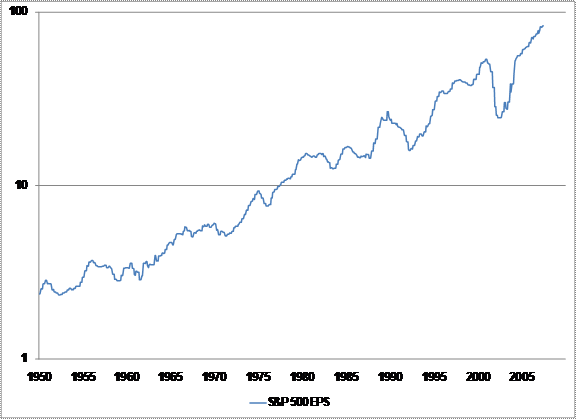
Adjusting P/E Ratios for the Profit Cycle The growing gap between traditional P/E ratios and P/Es adjusted for the profits cycle "In former times analysts and investors paid considerable attention to the average earnings over a fairly long period in the past - usually from seven to ten years. This average figure was useful for ironing out the frequent ups and downs of the business cycle, and it was thought to give a better idea of the company's earning power than the results of the latest year alone." Even though Ben Graham was writing about the analysis of individual companies, it seems logical that the same process should be applied to an index of companies. Are the index profits earned over the most recent 12 months a true measure of the earnings power of the index? Or are the average earnings - earned throughout the ups and downs of the business cycle - a better measure? Arriving at the true measure of earnings power is important, Graham counsels, because that's the figure to use when calculating a proper P/E ratio. The answers to these questions are more important today than at any time in at least 60 years. That's because the difference between the P/E ratio based on trailing earnings and the P/E ratio based on average earnings is wider than at any time during this period. There are two other reasons that make the question timely. The first is that this earnings cycle is one of the longest on record. If we count a profit cycle from the point that year-over-year earnings growth turns positive to when it first turns negative, this is the third-longest cycle since 1950. The longest cycle took place during the mid to late 90's, lasting 5 ½ years. A cycle of 4 ¾ years ended in 1981. The current cycle is just 3 months shy of that record. But that also makes the current cycle more than twice as long as the average cycle of just over 2 years. You can see the extent of this uninterrupted expansion in the chart below which graphs the S&P 500 earnings since 1950.
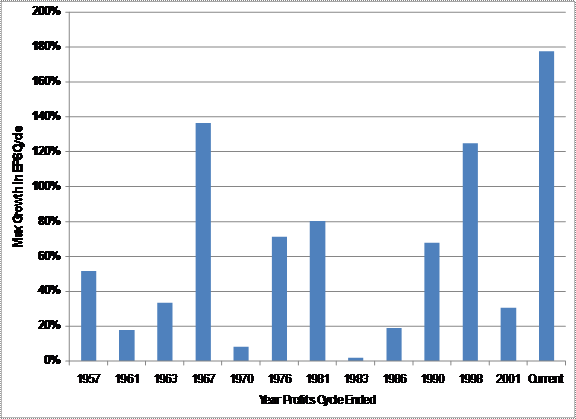
You can also see the steady rate at which earnings have grown at over the last few years. Following the rebound off the low, the variability in the growth rate has also moderated more recently. This trend has helped investors to forget an important characteristic of year-over-year earnings: they're volatile. Since 1950, year-over-year earnings growth has actually been more volatile than stock returns have been. It's likely that this volatility will return. While data is available to argue that swings in the economy have become more muted, it's difficult to say the same about earnings. Although the economy experienced one of the mildest recessions on record earlier this decade, S&P 500 profits fell by nearly half. It's not only the length of this earnings cycle that stands out, but the total growth in earnings from trough to peak. The chart below shows the average growth in earnings during profit cycles lasting at least a year. Per share earnings have grown by a larger amount in this cycle than in any other during the period since 1950. This can be partially explained by the depth of the 2002 profits recession. Much of the gain in profits was a snap-back from that trough. Another part can be attributed to the role that record profit margins are playing in the level of current earnings, fueling faster earnings growth.
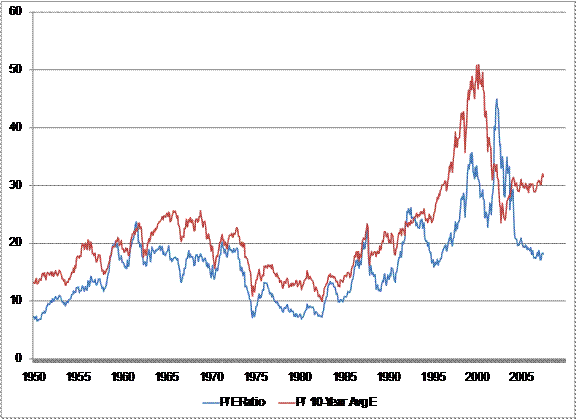
Adjusted P/E Ratios The length of the current earnings cycle and the extent to which earnings have grown above trend is now creating a major divergence between traditional P/E ratios and those that adjust for the profits cycle. These adjusted P/E ratios have also moved noticeably higher over the last few months, indicating additional risk over what the traditional P/E ratio already implies. One method of adjusting the P/E ratio is to take the current index price over the 10-year average of earnings per share, a method Robert Shiller made popular. This method smooths out shorter-term variability in earnings, and seems particularly appropriate now. That 10-year average would include the strong earnings growth seen during the late 90's, the profits recession of 2002, and the recent extended rebound. Considering the rapid earnings growth in 1999 and the beginning of 2000, and of the last few years, this is no conservative reading. This method is plotted in the graph below along with the P/E Ratio based on trailing 12-month reported earnings.
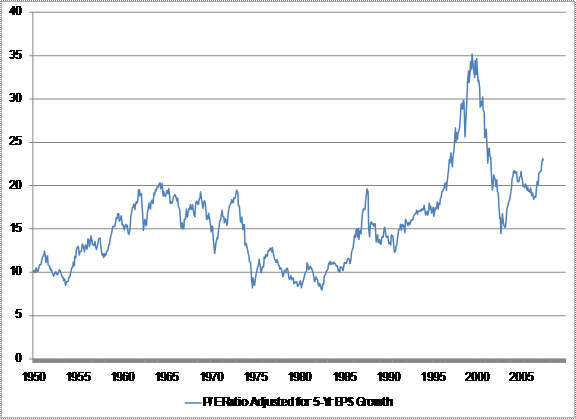
The P/E ratio based on average earnings has mostly traded at a higher level than the traditional P/E ratio because 10-year average earnings are usually lower than the most recent level of 12-month earnings. The chart also shows the growing difference between the two ratios, which is now at its largest spread for the period shown. The P/E ratio using average earnings has been rising steadily throughout the year. As the rate of earnings growth has slowed during the last couple of quarters, and as stock prices have moved higher, the ratio has become more extended. The current multiple is 31.5. Again, since 10-year average earnings are generally lower than trailing 12-month earnings, that P/E of 31.5 shouldn't be compared apples-to-apples with P/E ratios based on one-year trailing earnings. The P/E based on 10-year average earnings should instead be compared with its own history, and on that basis, it is at the highest level since the late 1990's market bubble. Another way to adjust P/E ratios is to factor in the extent earnings are either above or below their long-term trend. This is one component of a model Steven Leeb has previously written about. Leeb takes the cumulative earnings growth over the previous 5 years and divides it by 50, to scale it more appropriately to the P/E ratio. So if earnings have doubled over the past 5 years, he adds two points to the P/E ratio. The idea is that if earnings have grown quickly in recent years, the elevated earnings make the observed P/E ratio appear more attractive than it really is, since the elevated earnings aren't usually sustained. Adding points to the P/E ratio corrects for that illusion. Because these adjustments don't compensate enough for the uninformative spikes in the P/E ratio during profit recessions, we'll use Dr. Hussman's P/E ratio based on peak earnings prior to the adjustment. The calculation based on 5-year earnings growth then adjusts the P/E ratio during both the early part of the earnings cycle and its later portion. Points are subtracted from the P/E ratio during profits recessions, to correct for the fact that earnings are depressed relative to their trend, and the observed P/E is probably overstated. Points are added to the P/E ratio when earnings have grown substantially above trend - since the observed P/E at that point is probably misleadingly low.
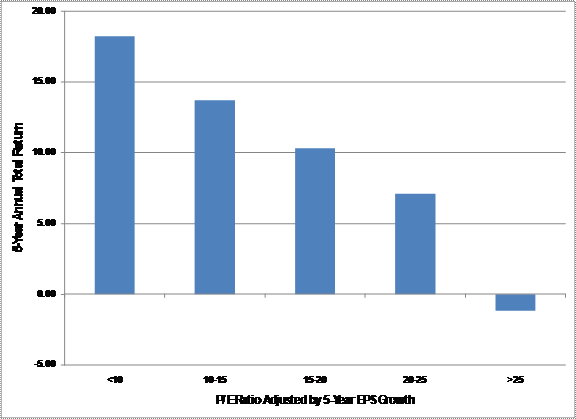
The P/E ratio adjusted for 5-year earnings growth is currently 24.5, which is also at its highest level outside of the late 90's bubble. This adjusted P/E takes into account both the duration of this current earnings cycle and its above-trend growth. Both have played a role in the recent spike in the adjusted P/E ratio. Of course, a model is of little use unless is has predictive power. As the chart below shows, this simple model has proved very effective. When the adjusted P/E ratio has been below 10, the total return on the S&P 500 has averaged 18.3% annually over the next five years. In contrast, ratios above 25 have led to negative 5-year returns.
The current profit cycle looks mature by two important standards, its age and its cumulative earnings growth. Both are at or near records. Both are causing important divergences between traditional P/E ratios and P/E ratios adjusted for the earnings cycle. It takes a number of aggressive assumptions to believe that current earnings represent true sustainable earnings, and that P/E multiples based on those earnings should be taken at face value. The most important of those assumptions is that the profit cycle no longer exists. --- The foregoing comments represent the general investment analysis and economic views of the Advisor, and are provided solely for the purpose of information, instruction and discourse. Prospectuses for the Hussman Strategic Growth Fund, the Hussman Strategic Total Return Fund, the Hussman Strategic International Fund, and the Hussman Strategic Dividend Value Fund, as well as Fund reports and other information, are available by clicking "The Funds" menu button from any page of this website. |
|||||||||||||||||||||||||
|
For more information about investing in the Hussman Funds, please call us at
1-800-HUSSMAN (1-800-487-7626) 513-326-3551 outside the United States Site and site contents © copyright Hussman Funds. Brief quotations including attribution and a direct link to this site (www.hussmanfunds.com) are authorized. All other rights reserved and actively enforced. Extensive or unattributed reproduction of text or research findings are violations of copyright law. Site design by 1WebsiteDesigners. |