|
|
||||||
|
|

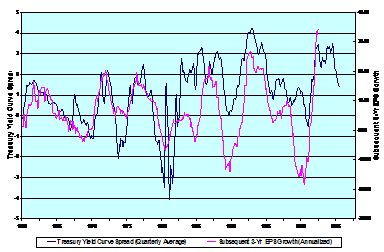
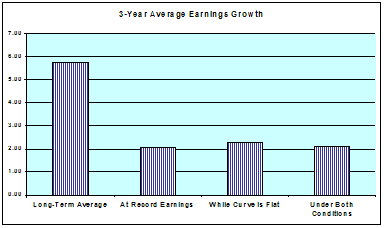
Earnings Growth and the Yield Curve William Hester, CFA June 2005 All rights reserved and actively enforced. Investors love to contemplate the unknown. Unfortunately, all this focus on the unknown can lead to a neglect of what is known, which is often good enough. One major unknown here is whether the yield on the 10-year Treasury bond will fall below the two-year note. Investors have good reason to wonder. An 'inverted curve' has an impressive record for leading recessions. And the 10-year bond is certainly keeping investors guessing. After topping out in March at 4.64%, yields on the 10-year bond have sunk to 4%. The yield now sits about 80 basis points lower than it was before the Fed first raised overnight rates almost a year ago, while the Fed Funds rate is 200 basis points higher. The known, in this case, is the current yield curve spread and the level of earnings. Both of these conditions, as they are now, have historically led to below-average earnings growth. Peak Earnings Profits may grow 5% from this year to next, and about 6% a year over the next five years, according to analysts polled by Zack's Investment Research. Earnings have enjoyed heady gains over the past two years, so this is a pronounced deceleration. Profits have boomed, but only measured from the low starting point in 2002. Even though the 2001 economic recession was mild, the hit to profits was substantial. That collapse set earnings up for a strong rebound. So earnings peaked in 2000, bottomed in 2002, and then moved to new highs in early 2004. Now at $60 a share, net profits sit comfortably in record territory. And there's the catch. Historically, record earnings have been followed by below-average profit growth. There's no need for profits to collapse if the economy continues to grow. There have been long stretches of time where record earnings were achieved year after year. But once earnings reach record levels, subsequent growth is slower, on average. Since 1950, when S&P 500 earnings have been at record levels, earnings have grown at just 1.6% a year over the following 3 years and 2.1% over 5-year periods, compared to a long-term average growth rate of about 6%. Economic Momentum Another concern for near-term earnings growth is the momentum of the economy. The Conference Board's Leading Economic Index peaked in May 2004 and has fallen for 4 straight months. The growth rate of Economic Cycle Research Institute's Weekly Leading Index recently fell to a 29-week low. The PMI, a measure of manufacturing growth, has slowed for its sixth straight month, to 51.4. And then there's the slope of the yield curve. The spread between the 10-year US Treasury and the 3-month bill is 105 basis points, its lowest point since 2001. Just 40 basis points separate the 2-year note from the 10-year bond. A 1996 Federal Reserve of New York research paper by economists Arturo Estrella and Frederic S. Mishkin found the yield curve was the best tool they examined for forecasting slowing economic growth. Considering this correlation with the economy, it is not surprising to see that the slope of the yield curve and subsequent earnings growth also move together.
Historically, a narrow spread has led to more moderate earnings growth. Since 1950, when the spread between the 10-year bond and the three-month bill has narrowed to less than 100 basis points, the 3-year average earnings per share of companies in the S&P 500 has been 2.3%. The 5-year average growth has been 3.8% a year. In contrast, when the difference between short rates and long rates has been greater than 100 basis points, average earnings growth has been 8.3% a year over a 3-year period and 6.5% a year over a 5-year period. The virtue of the yield curve, according to the New York Fed economists, is the lead time in its forecast of slowdowns. "In predicting recessions two or more quarters in the future, the yield curve dominates the other variables, and this dominance increases as the forecast horizon grows," they said. What about periods that feature both record profits and a narrow spread between short and long rates? During those periods, which represent only 15 percent of the time since 1950, the average 3-year growth rate was 2.1%, while the 5-year growth rate was 4.3%.
As the spread between the short and long rate narrows, the debate about whether the bond market is forecasting an economic slowdown grows more intense. Chairman Greenspan weighed in on the issue this week in response to a question he received about a possible yield curve inversion. "I suspect that we have changed the structure of the flow of funds" among countries so much " that I am not sure what such a configuration, should it occur, would mean," Greenspan said. "I'm reasonably certain we would not automatically assume that it would mean what it meant in the past." The debate is important to investors because over a longer stretch of time earnings growth plays an important role in the return one can expect from stocks. Most analysts who are forecasting stock market returns in line with historical averages are not arguing for higher multiples, but faster earnings growth. Under current conditions (record earnings and a narrow yield curve) profits have grown an average of just 2.1% annually over the next three years. With 2.1% earnings growth over the next three years, constant P/E multiples, and a 1.8% dividend yield, stocks would return roughly 3.9% a year. U.S. Treasury notes that mature in 3 years now yield 3.7%. --- The foregoing comments represent the general investment analysis and economic views of the Advisor, and are provided solely for the purpose of information, instruction and discourse. Prospectuses for the Hussman Strategic Growth Fund, the Hussman Strategic Total Return Fund, the Hussman Strategic International Fund, and the Hussman Strategic Dividend Value Fund, as well as Fund reports and other information, are available by clicking "The Funds" menu button from any page of this website. |
|||||||||||||||||||||||||
|
For more information about investing in the Hussman Funds, please call us at
1-800-HUSSMAN (1-800-487-7626) 513-326-3551 outside the United States Site and site contents © copyright Hussman Funds. Brief quotations including attribution and a direct link to this site (www.hussmanfunds.com) are authorized. All other rights reserved and actively enforced. Extensive or unattributed reproduction of text or research findings are violations of copyright law. Site design by 1WebsiteDesigners. |