|
|
||||||
|
|

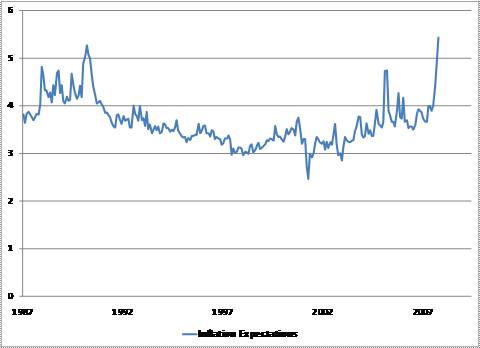
Anchored Inflation Expectations and the Expected Misery Index William Hester, CFA June 2008 All rights reserved and actively enforced. It was about as coordinated a message as we've heard from the Fed of late. Fed Chairman Bernanke began the campaign with his June 9th speech at the Boston Fed saying that policy makers will "strongly resist an erosion of longer-term inflation expectations". Fed Governor Frederic Mishkin followed up saying that it was "absolutely critical" to contain future price expectations. Fed Vice Chairman Don Kohn also added to the message saying, "It is very important to ensure that policy action anchor inflation expectations... This anchoring is critical." The speeches and the sound bites that followed moved the markets. The dollar strengthened, bonds sold off, and investors priced in with near certainty that the Fed would raise interest rate multiple times by the end of the year. Those moves have been mostly unwound in the past week. But it was clear that the Fed's renewed focus on inflation and inflation expectations caught the market off guard. Bernanke's speech was relatively brief. There were only a few paragraphs discussing the role of inflation expectations and their role in future inflation. But he and other Fed governors have discussed this topic in greater detail in previous speeches and research papers. A speech Bernanke gave last summer to fellow economists at the NBER - and a paper Frederick Mishkin published a month earlier - reveals how much emphasis Bernanke's Fed puts on inflation expectations. And since both sets of ideas were delivered prior to the credit crisis, the views offer a look into the Fed's thinking that is uncorrupted by the economic fires they are currently fighting. Both Bernanke and Mishkin argued last year that inflation expectations greatly influence actual inflation, and therefore the Fed's attempts at achieving price stability. And potential changes in inflation expectations are highly dependent on how well expectations are anchored. Bernanke writes, "I use the term 'anchored' to mean relatively insensitive to incoming data. So, for example, if the public experiences a spell of inflation higher than their long-run expectation, but their long-run expectation of inflation changes little as a result, then inflation expectations are well anchored. If, on the other hand, the public reacts to a short period of higher-than-expected inflation by marking up their long-run expectation considerably, then expectations are poorly anchored." Inflation expectations have continuously become better anchored over the last 25 years. Since Paul Volker stared down 14 percent inflation in 1980, inflation expectations have been generally falling, with lower volatility. Bernanke argues that this trend of better anchored inflation expectations has occurred at the same time that inflation has become less sensitive to changes in both aggregate demand and to supply shocks. "A lower sensitivity of long-run inflation to supply shocks would imply that such shocks are much less likely to generate economic instability today than they would have been several decades ago. Notably, the sharp increases in energy prices over the past few years have not led either to persistent inflation or to a recession, in contrast to the U.S. experience of the 1970's", Bernanke said in the speech last summer. The order of importance that Bernanke argues for is important. In his view, actual changes in demand and supply are less important than the role they play in setting expectations for future price levels. "A one-off change in energy prices can translate into persistent inflation only if it leads to higher expected inflation and a consequent 'wage-price spiral'. With inflation expectations well anchored, a one-time increase in energy prices should not lead to a permanent increase in inflation but only to a change in relative prices." It's easy to see what motivated the Fed to launch a verbal campaign to contain inflation expectations. The graph below shows the average of three surveys that track inflation expectations (the Conference Board's 12-month forward inflation expectation and the University of Michigan's short and long-term expectations index). The pop in expectations put this measure of inflation expectations at its highest level in more than 20 years. Separately, the Conference Board's measure of inflation expectations is at a 20-year high, while the University of Michigan's one-year ahead index is at a 25-year high.
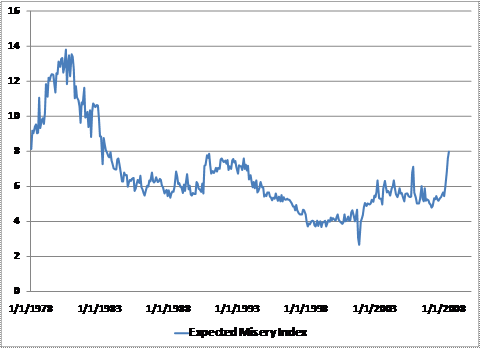
It looks like the swift and substantial change in inflation expectations was a catalyst for the shared message this month. The Fed's views on the role of inflation expectations also helps explain why the Fed has been mostly mum while the price of oil doubled and the dollar lost 13 percent in the year since last summer (outside of brief mentions in the Fed's FOMC minutes). Neither Bernanke nor Mishkin argue that inflation expectations are forever anchored. A loss by the general public in the perception that the Fed can control prices would quickly unhinge these expectations, much like what happened in the 1970's. Even though inflation expectations seem to play a major role in setting policy, the Fed has also admitted to having an incomplete understanding of the process. "We need a better understanding of how inflation expectations affect actual inflation and of the factors that determine inflation expectations," Bernanke says. Anchored inflation expectations have been a blessing that the Fed has welcomed, but which they don't fully understand. If inflation expectations have taken the prominent role in guiding future inflation, some difficult policy situations could arise. It is generally expected that more slack in the labor force should ease inflation. But Bernanke and Mishkin have argued that inflation has become less responsive to the unemployment gap, while inflation expectations have grown in importance. That means it may be more difficult to lower inflation and inflation expectations once they become elevated. If inflation is less responsive to labor slack, more slack - that is, higher unemployment - will be needed to lower inflation (the measure of this tradeoff is often referred to as the sacrifice ratio). This means that delaying convincing actions that would show that the Fed can contain price levels would require a more severe response further down the road. A credibly tough monetary policy would be a more manageable task if the economy was recovering from a recession, instead of what looks like the early stages of a contraction. Add in credit markets where counter-party fear still dominates, an unemployment rate still rising, and a presidential race looming, and the Fed seems to be left with few effective responses. The Expected Misery Index Inflation isn't the only concern when monitoring consumer expectations. Expectations about labor market prospects are also important. These expectations are partially formed by the current trends in the economy. The Misery Index is a metric that tries to capture those trends. It's an index that has a rich history in financial markets and U.S. politics. During the late 1970's and early 1980's politicians were voted into office by quoting the index, and then eventually voted out based on the same measure a few years later. That's when the inflation was at 14 percent and the unemployment rate was at 6 percent, leaving a Misery Index of 20 percent. Considering it's an election year it's not surprising to hear the measure talked about more frequently, including a recent Wall Street Journal article. The graph below is a twist on the concept, which we'll call The Expected Misery Index. (Although misery is not the word I'd choose to describe the overall current economy, we'll stick with the nomenclature). It's the sum of expected inflation and the Conference Board's survey of Jobs Hard to Get (scaled by 10 to roughly equate changes in the two). Expected inflation is probably a better measure for how consumers are feeling about the changes in price levels compared with reported inflation. Likewise, the Conference Board's survey question asking how difficult it is to find work is also a timely indicator of workers expectations about job security. It tracks well with the unemployment rate and sometimes leads it.
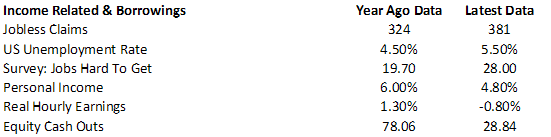
The Expected Misery Index sums different sub-indexes than the original measure, so the levels are not comparable. But the graph shows that the Expected Misery Index hasn't been this elevated since the late 1970's and early 1980's. What's also noteworthy is how quickly expectations have shifted. It seems that consumers had previously been treating rising food and energy prices and early signs of labor market weakness as temporary. That changed in matter of a month or two. There are other reasons outside of the unemployment rate and inflation expectations for consumers to be - if not miserable - more than a bit gloomy. When economic data trickles in through the month, some numbers look better than others and all the data is compared to what was expected. This process of data digestion can at times make it easy to miss underlying trends. But when you isolate the changes in the finances of consumers over the last year the pressures that consumers continue to face become clearer. We can think of the typical consumer or household of consumers as a small business. Money comes in by way of employment to purchase assets and cover expenses. Any money that drops down to the bottom line can be saved and invested. And the health of the business or household will be partially determined by the value of the assets they own and the burden of financing the purchase of those assets. When you look at the consumer though this lens, the news continues to be discouraging. The tables below show various indicators of income, borrowings, and assets and liabilities. In each table the latest data is shown along with its year ago level. The first table shows trends in jobs, income, and equity cash outs - money coming in. Here are some of the details: jobless claims have risen 18 percent over the past year, and are approaching the psychologically important level of 400 thousand; the unemployment rate has jumped a full percentage point, where half of that gain came last month; the percentage of workers finding it difficult to find jobs has risen by 40 percent; real hourly earnings changes are now negative; the change in personal income peaked and has now turned down noticeably; quarterly mortgage equity cash outs have fallen by more than 60 percent.
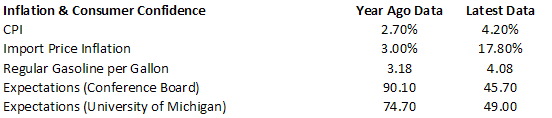
The second table shows the trends in consumer inflation and in confidence surveys: the CPI has jumped from 2.7 percent last year to 4.2 percent in the most recent report; import inflation is at its highest level in more than 25 years; AAA's index tracking the price of a gallon of regular gasoline has jumped 28 percent in a year to more than $4 a gallon; the Conference Board's measure of expectations has fallen 50 percent in the past 12 months while the University of Michigan's barometer has fallen by more than 30 percent.
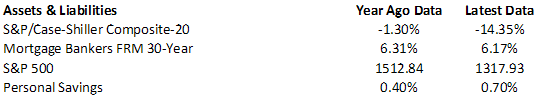
One of the trickiest calculations in creating scenarios for the direction of consumer spending and the economy may be how consumers react to lower assets prices. A boom in stock portfolios and home values has buttressed the confidence of consumers for almost two decades. Both are now falling in tandem. By Professor Robert Shiller's latest tally home prices have fallen 14 percent in the last year. April's data are scheduled to be announced this week and economists expect the trend of falling prices to continue. Mortgage rates - which help determine a household's liability burden - are only modestly lower from a year ago. In equity portfolios, the S&P 500 Index has fallen 13 percent over the last year and is down 15 percent from its peak.
Although the personal savings rate isn't the most exciting data series to track, it could become important. Eventually the angst consumers currently report feeling about future inflation and job prospects could flow into their concerns about the level of retirement savings. National savings continues to be less than 1 percent of the reported $12 trillion of personal income. A small change in the savings rate would have important ramifications for the trend in consumer spending. While there doesn't seem to be an immediate cause for a change in savings habits, there's an argument that trends will need to change over the next few years, especially among baby boomers. In its latest survey the Employee Benefit Research Institute found that, "forty-nine percent of workers report total savings and investments (not including the value of their primary residence of any defined benefit plans) of less than $50,000. Twenty-two percent of workers and 28 percent of retirees say they have no savings of any kind." Pressures on the finances of consumers show up in some spending data, but not all. The rate of overall consumption has dropped in half from 3 percent a year ago government reports show. The rate of growth in retail sales has also been halved in the last year. Sales of automobiles have fallen by 12 percent. Sales outside of these types of purchases are healthier. The market's focus on the various retail indexes may sharpen further over the next few months. The Fed is in a tough spot. There are early signs that inflation expectations - an indicator that Ben Bernanke has said has first-order implications for the performance of inflation and the economy - are becoming unanchored. Consumers are beginning to assume that many of the rising prices that they see about them will stick. At the same time the consumers mood is worsening, pushed down by weak labor market trends, economy-wide inflation, sinking asset prices, and rising nest-egg anxieties. With the Fed in a position where it is unable to raise rates materially from these levels, it leaves only the power of the pulpit. Fed officials must convince consumers and households that they will be tough on rising prices, even if they can't directly confront the problem today. --- The foregoing comments represent the general investment analysis and economic views of the Advisor, and are provided solely for the purpose of information, instruction and discourse. Prospectuses for the Hussman Strategic Growth Fund, the Hussman Strategic Total Return Fund, the Hussman Strategic International Fund, and the Hussman Strategic Dividend Value Fund, as well as Fund reports and other information, are available by clicking "The Funds" menu button from any page of this website. |
|||||||||||||||||||||||||
|
For more information about investing in the Hussman Funds, please call us at
1-800-HUSSMAN (1-800-487-7626) 513-326-3551 outside the United States Site and site contents © copyright Hussman Funds. Brief quotations including attribution and a direct link to this site (www.hussmanfunds.com) are authorized. All other rights reserved and actively enforced. Extensive or unattributed reproduction of text or research findings are violations of copyright law. Site design by 1WebsiteDesigners. |