|
|
||||||
|
|

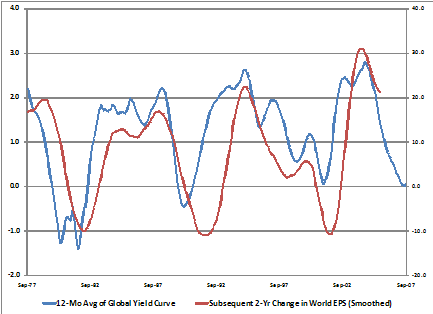
Global Yield Curves, Earnings Growth, and Sector Returns A reliable measure suggests slower global earnings growth ahead It's clear from this year's sector performance that investors are betting that most developed and emerging economies will continue to grow at a brisk pace over the next couple of years, even if the U.S. economy slows. U.S.-based energy, materials and industrial stocks - all which have above average global sales exposure - are some of the best performing groups this year. Some of the same groups of stocks that trade on global exchanges are also outperforming. The common theme seems to be that investors are adding stocks to their portfolios that are leveraged to this expected growth. There's plenty of data to support the idea that global growth may outpace U.S. growth in the coming years. The eurozone economies have grown faster than the U.S. economy in each of the last four quarters. And even though the Fed has cut its policy targets twice since the middle of August, the ECB and the Bank of England both left their policy targets unchanged this week. ECB president Jean-Claude Trichet commented that concerns about inflation pressures still carry sufficient weight, even as the Euro continues to strengthen against the Dollar. Emerging market economies continue to barrel along. China grew at 11.9 percent in the second quarter versus the year-earlier quarter while Brazil, Russia and India grew at an average of 7.5 percent. World GDP may grow at 5.2 percent this year versus just 2 percent growth in the U.S, according to IMF forecasts. Investors in U.S. stocks have been rewarding companies sensitive to this global growth. The MSCI U.S. Energy index is the top performing sector index this year. The indexes that track materials and industrial have also been strong. Many of the stocks that make up these indices have large non-domestic sales exposures. Stocks traded on global exchanges are seeing similar performances. The MSCI World indexes that track energy and industrial stocks are up more than 20 percent this year. But a strong counterpoint to this equity performance continues to be the narrow spread between short and long rates in the major bond markets around the world. The shape of a government's yield curve can reveal expectations for future output growth. When healthy output growth is expected, long rates usually sit well above short rates. A line drawn between the two rates would slope upward. When investors expect future short rates to be lower, possibly stirred on by a recession, long rates drop below short rates. The spread between 10-Year U.S. Treasuries and 3-month T-bills was negative for about 10 months ending in May. It was briefly negative again this summer, as was the spread in yields between Canada's benchmarks. The UK Gilts curve remains inverted. The spread between the bond benchmarks in France and Germany converged this summer, flattening their government curves. It is well know that inverted yield curves have also been a fairly reliable indicator of recessions. And not just in the U.S. A paper published in 1996 by economists at the Bank of International Settlements looked at the efficacy of inverted yield curves as a signal of a slowdown in 8 different countries, including Canada, UK, and Germany. They found that "the slope of the domestic yield curve provides information about the likelihood of future recessions in all eight countries studied." Global Yield Curves and Global Earnings Growth Aside from the risk of slowing economic growth in the U.S. and the G7 countries, there is a strong risk that global earnings may slow enough to spook equity investors, especially those who are overweighting highly cyclical industries. Historically, global yield curves have provided guidance about this risk. To see this, we can look at a composite of global yield curves and its relation to MSCI's World EPS data series. To measure the world's yield curve, we'll use the countries of the G7, excluding Japan, which has been out of step with other large economies for more than a decade. The graph below shows the global yield curve and the subsequent growth in World EPS. Both lines are smoothed to isolate the underlying trends. The global yield curve is a 12-month moving average of the yield curves of the 6 countries, each weighted by their GDP. The World EPS Growth rate is the subsequent two-year change in the two-year average of World EPS. So the last data point on that line represents the average earnings figure over the last two years versus the same calculation two years ago. That line ends in September 2005. The global yield curve is represented by the blue line, and is plotted on the left axis. The change in World EPS is in red, and is plotted on the right axis.
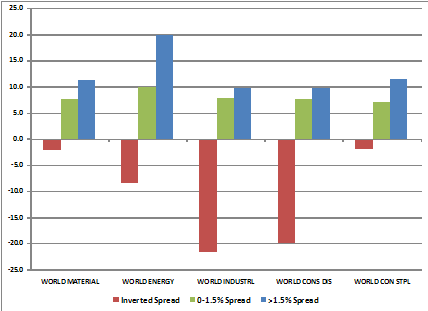
Changes in World EPS have tracked the shape of the global yield curve closely, usually with about a two-year lag. The global yield curve was inverted from 1979 until 1982. The smoothed World EPS eventually declined by 10 percent. The global yield curve inverted again in 1990, and World EPS declined by a similar amount. In 2001 when the smoothed yield curve flattened, but didn't invert, World EPS again declined by more than 10 percent. The 12-month moving average of the yield curve spread hit zero in July. It has since ticked up a fraction, as short rates have fallen in response to the world-wide credit crisis. Much like the pattern in U.S. data, year-over-year changes in World EPS have very little correlation with the short-term returns of the MSCI World price index. But the current flatness of the global yield curve may turn out to be important. That's because more extended declines in World earnings have correlated with important declines in MSCI's World price index. As the chart above shows there have been three meaningful declines in smoothed World earnings, bottoming in 1982, 1991, and 2001. Using monthly data, the smoothed Global Yield Curve bottomed in November 1981, May 1990, and April 2001. The corresponding declines in the MSCI World price index from those points were -17.3 percent, -19.4 percent, -35.0 percent, respectively (the peak-to-trough market losses were even worse). Global Yield Curves and Sector Performance Based on sector performance so far this year, it's apparent that equity investors are not expecting World EPS to slow. Many of the same types of stocks that have performed well this year have been the worst performers when earnings have turned down in the past. When the Global yield curve has been inverted in the past, industrial stocks have performed poorly. These stocks have been among the best performers this year. The chart below shows the average 12-month returns in some of the industries that make up the MSCI World Index - including Materials, Energy, Industrials, Consumer Discretionary, and Consumer Staples - subsequent to different shapes of the global yield curve. Though the data only reaches back to 1995, the patterns are similar to those of U.S. sector performance dating back further. The chart shows that indexes that track industrial stocks have fared worst following periods of an inverted curve. In contrast, consumer staple stocks have held up relatively well following yield curve inversions. This year, MSCI's World Consumer index is up about 10 percent, but still trails the broader World benchmark and most of the other cyclical benchmarks (except for consumer discretionary stocks, which are lagging both domestically and internationally).
If the global yield curve's forecast for slower earnings growth turns out to be correct, it will pose a particular challenge to cyclical indexes. U.S. companies that are viewed by investors as "global" generally obtain a large portion of their international sales from developed economies. The exact number is challenging to pin down because companies differ in the way they report geographic sales, if they report them at all. But for the companies in the S&P Materials index that report sales in easily comparable geographical segments (about half of the companies in the index), 24 percent of their sales come from the eurozone. Only about 10 percent come from the fast-growing Asia Pacific region. When you look at the normalized valuations of companies around the world, adjusting for elevated profit margins and the length and extent of the current earnings cycle, U.S. companies with global exposure not even the most overvalued. On a relative basis, small U.S. companies are more richly valued than large, global ones (see http://hussmanfunds.com/rsi/relativevalue.htm for more on this). If the U.S. dollar continues its steady decline, and the U.S. economy slows in isolation, U.S. companies with global sales would likely end up in better shape than smaller companies. In any case, it may be unwise to completely ignore the global yield curve. Two years ago, Arturo Estrella, a Fed economist who has done extensive research into the predictive ability of the yield curve, was asked whether he thought the term spread still had its forecasting ability. He said, "...there has been a persistent predictive relationship between term spreads and future real output, though the precise parameters may change over time". It is possible that U.S. and global yield curves need to invert to a greater extent, or for a longer period of time, to continue their ability to forecast officially-declared recessions. But by overweighting highly cyclical companies with the global yield curve already so flat, investors must believe that the yield curve has lost all of its ability to signal slower growth ahead. --- The foregoing comments represent the general investment analysis and economic views of the Advisor, and are provided solely for the purpose of information, instruction and discourse. Prospectuses for the Hussman Strategic Growth Fund, the Hussman Strategic Total Return Fund, the Hussman Strategic International Fund, and the Hussman Strategic Dividend Value Fund, as well as Fund reports and other information, are available by clicking "The Funds" menu button from any page of this website. |
|||||||||||||||||||||||||
|
For more information about investing in the Hussman Funds, please call us at
1-800-HUSSMAN (1-800-487-7626) 513-326-3551 outside the United States Site and site contents © copyright Hussman Funds. Brief quotations including attribution and a direct link to this site (www.hussmanfunds.com) are authorized. All other rights reserved and actively enforced. Extensive or unattributed reproduction of text or research findings are violations of copyright law. Site design by 1WebsiteDesigners. |