|
|
||||||
|
|

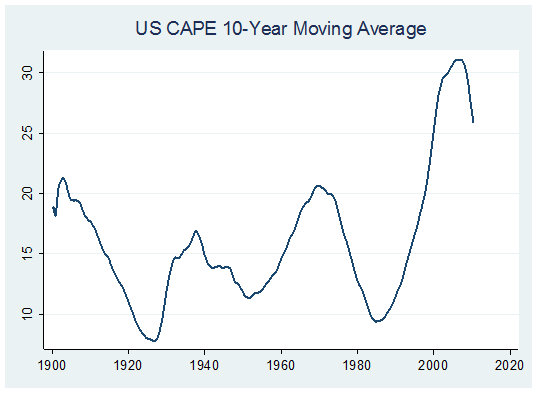
An Update on International Market Valuations Bill Hester, CFA May 2010 All rights reserved and actively enforced. Reprint Policy As the European debt crisis has unfolded the last few weeks, international markets have taken the hardest declines. The Euro STOXX, FTSE, and CAC 40 Index have all fallen by about 15 percent from their mid-April peak. In dollar terms, the Euro STOXX and CAC 40 are down more than 20 percent. On a year-to-date basis, in dollar terms, the two indexes are down more than 25 percent as the Euro has also come under assault due to the growing fears of a Euro-area banking crisis. Many of the indexes are now near or below their levels immediately prior to the Euro-area's May 10 th announcement that Euro-area countries, the ECB, and the IMF will help Greece meet its near-term debt obligations. Have the recent declines been enough to bring markets back to reasonable levels of valuation? There are hazards to be alert for in gauging the valuation of specific international markets. Data for the 23 developed countries that MSCI tracks mostly begins in 1970. Forty years of data can be easily influenced by an outlier like the market bubble of the late-1990's, which had a secondary peak in 2007. The graph below shows the 10-year moving average of the P/E Ratio for the S&P 500 Index. Using the moving average of the P/E ratio helps highlight the broad shifts in multiples over time. The ratio uses Robert Shiller's cyclically adjusted earnings concept, where earnings are averaged over the prior decade.
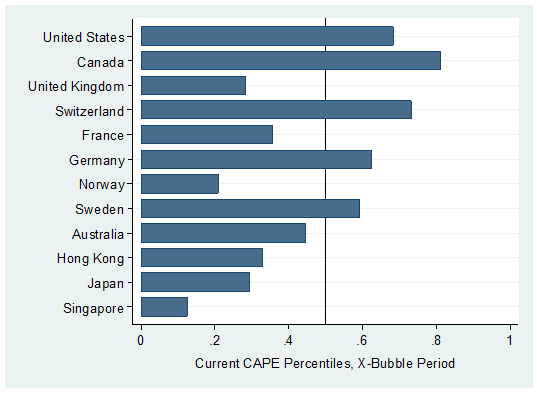
Prior to the late 1990's the moving average of the cyclically-adjusted P/E ratio predictably moved within a range of 7 or 8 to about 20. The end-of-the-century bull market took the ratio far outside of that range. With economic recessions and banking crises occurring more frequently this decade it's difficult to imagine that investors will push stock valuations back to the those early 2000 levels. The above graph also shows how large a role outlier valuation levels would play in the analysis if we were to use data beginning only in 1970. Only a sliver of data would be left with P/E's below 15, which is the longer-term average multiple in the US prior to the bubble. The record profit margins reached at the market's peak in 2007 can also distort valuation methods that include earnings from that period. In many countries outside of the US, profit margins rose as high as in the US, and often from lower average levels of historical margins. This was especially evident in resource-rich countries like Canada and Australia, but also in many European countries. As a result, it's important to allow for the possibility that P/E ratios based on 10-year average earnings are biased to the low side because of the unusual profit margins several years ago. It's also worthwhile to combine the analysis of P/E ratios along with other fundamentals such as dividend yields, book values, and cash flows. The level of valuation for broad indices like EAFE or regional indices can hide important differences in the levels of valuation of individual countries. At the country level, German shares haven't seen the compression in multiples that has taken place in countries like Italy and Ireland, for example. The chart below attempts to put valuation into perspective for a dozen countries that are in MSCI's developed market index. For each country a cyclically adjusted P/E ratio was calculated and then ranked within that country's historical range. The "normal" range for each country excludes the bubble period beginning in the late 1990's through 2007. The vertical line at .5 represents the average multiple for that country in the range of dates used.
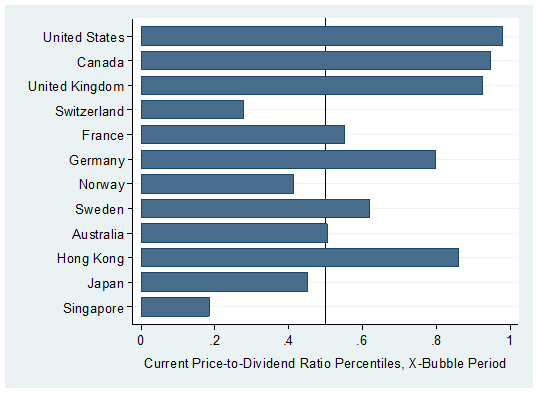
Using the cyclically adjusted P/E ratio, the results are mixed. The US, Canada, Switzerland, Germany and Sweden are trading at above-average multiples. Canada's current level of valuation, for example, is more expensive than 80 percent of its (ex-bubble) history. The US P/E multiple (using MSCI data since 1970) is more expensive than about 70 percent of its history. Cheaper markets, relative to their own histories, include the UK, Norway, Singapore and Japan. As an aside, Japan proves to be a difficult country to value at the index level because the Nikkei peaked 10 years earlier than most countries reached their bubble peaks, corporate earnings growth has been extremely volatile, and the country has been faced with persistent deflation and depressed earnings levels. So while Japan looks favorable valued based on trailing fundamentals, forecasting future expected cash flows at the index level can be a challenge because of the continuing uncertain economic backdrop. Other fundamental measures show stocks to be trading at mostly unfavorable levels when compared to longer-term country-by-country averages. The chart below is calculated in the same way as the one above, but uses the price-to-dividend ratio. Each country's price-to-dividend ratio is ranked within their own historical range of price-to-dividend ratios. By way of this ratio, markets are again mixed, but the ones that are overvalued are at uncomfortable levels of overvaluation. In the U.S. (outside of the bubble) only 3 percent of periods have had higher levels of valuation than current levels. Canada and the UK show the same stretched levels of overvaluation.
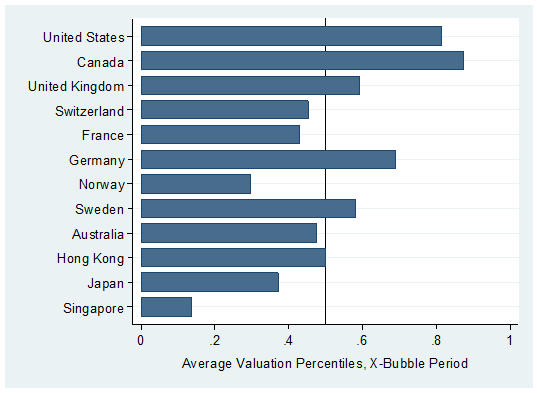
A compromise would be to average the two, which is what the next graph does. It simply averages the percentiles of both the cyclically adjusted P/E ratio and the Price-to-Dividend Ratio. This graph shows that the US and Canada are clearly overvalued relative to their historical ranges. Most of the remaining countries are trading near their historical average levels of valuation.
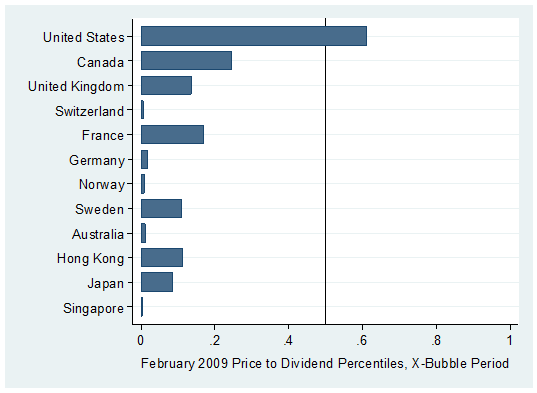
The current notion that international markets are broadly favorably valued may be a left-over argument from last year. There is evidence that international markets reached very favorable levels of valuation in 2009. Importantly, these levels of valuation were considerably more depressed than the levels reached in U.S. stock markets. The graph below shows the Price to Dividend Ratio percentile for each country in February 2009.
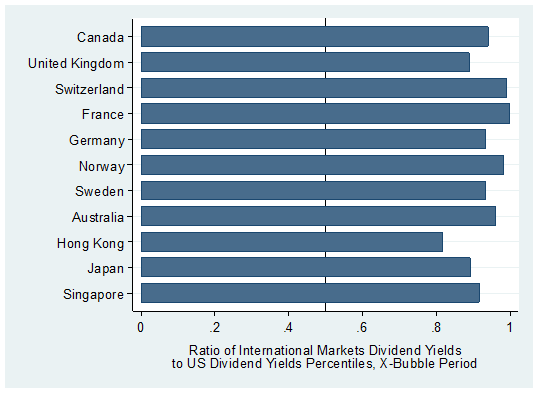
The graph shows that the levels of valuation reached in the US markets were still quite rich in early 2009, compared to the levels of valuation reached in international markets. On a price-to-dividend ratio basis, the US markets didn't even retreat to average valuations. Using the cyclically adjusted P/E ratio, the US markets did fall below average, again helped by prior above-average profit margins. Averaging the two percentiles (based on the CAPE and Price-to-Dividend Ratio) results in percentile of .4. That means that in February of last year the U.S. market reached a level of valuation that was still richer than 40 percent of its (ex-bubble) history since 1970. Most international markets, however, did fall to very depressed levels of valuation, especially European countries, like Switzerland and Germany. Although countries like Italy, Ireland, and Spain are not shown because MSCI's data doesn't reach back far enough, February 2009 valuations would have also have been depressed relative to their own histories. There's another trend in the valuation data this is worth highlighting, one that is more optimistic for investors in international stocks. Even after the advance since early 2009, international markets are uniformly better valued than the U.S. market. The chart below shows where the current ratio of dividend yields (foreign yield to U.S. yield) stands, in comparison to historical norms.
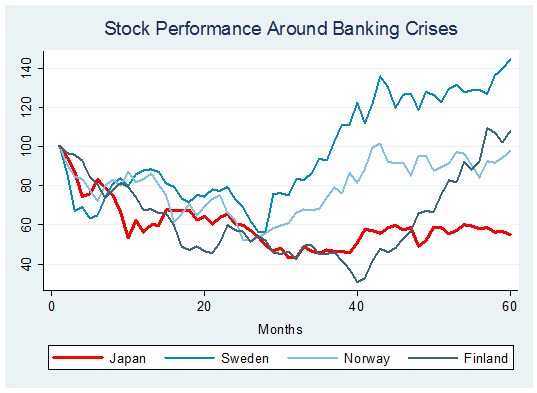
The graphs show that relative to the US, most international markets are as favorably valued as they have been in the last 40 years (alternatively, the U.S. is about as overvalued relative to international markets as it has ever been). This research might be summed up as indicating that international markets are currently trading mostly between average and slightly overvalued levels. The very favorable levels of valuation for international markets at the low in 2009 have mostly been erased by now. But compared to the US, international markets still show good relative value. Stock Performance Post Credit Crises Any discussion of the valuation - and return prospects - of European markets needs to include consideration of how banks may perform. Banks make up the largest portion of the Euro STOXX Index, a market-cap weighted index of 600 European stocks. HSBC, Banco Santander, BNP Paribas, Barclays, and UBS make up more than 40 percent of the bank portion of the index. Much like the S&P 500 Index in 2007 and 2008, European Indexes will be strongly affected by the performance of the banking sector going forward. Not surprisingly, as a group they trail the broader index this year. In the last two decades as the frequency of banking crises has risen, so has the frequency of discussions about how to fight them. In developed countries, the study material includes the Nordic countries, beginning in the late 1980's through the early 1990's, and the banking crisis of Japan which followed the peak of their stock and real estate markets in 1990. These mostly overlapping crises - in Sweden, Norway, Finland and Japan all beginning around 1990 - are part of the modern-day "Big Five", the term that Carmen Reinhart and Ken Rogoff use in their book This Time is Different, an exhaustive study of eight centuries of banking crises. While these crises weren't all identical, they shared similarities: stock and real-estate markets rose far above tangible intrinsic values, financial liberalization outpaced regulatory checks, and bank loan standards dropped below prudent levels. The shared outcome was a large number of non-performing loans left on bank balance sheets. From these crises came two broad approaches to solving credit crises. One is what is often referred to as the Nordic Way - where problems are exposed, standardized support is offered to all struggling banks, debt is restructured, and resolution agencies are created to wind down troubled loans over time. This response does not avoid harsh recessions, but by clearing the system of unserviceable debt, it can lay the groundwork for the economy to prosper only a few years after the credit strains surface. This was the way that the authorities of Norway, Finland, and Sweden responded. In contrast, following the bursting of the Japanese real-estate bubble, authorities supported accounting rules that made the identification of non-performing loans less transparent, while banks pursued a strategy of loaning more money to those customers with the highest probability of default. Both strategies kept troubled loans on the balance sheets of Japanese banks for many years and hobbled the economy. The European crisis is of a different stripe than those faced by the Nordic countries and Japan. The current crisis revolves around sovereign debt, where government debt levels rose to what now proves to be suffocating levels. But it aligns with previous crises in the possibility of future defaults (especially on Greece debt) and the possibility of contagion throughout other highly-indebted countries, like Italy, Ireland, and Portugal. The lessons learned from the disparate outcomes of the Big Five are that solutions to banking crises are usually more successful when they are confronted in terms of solvency, rather than treating them as if they reflect a simple lack of liquidity. The graph below shows the stock market performance of Sweden, Norway, Finland, and Japan beginning from their market peaks prior to credit strains. The Nordic stock markets fully recovered from their painful declines in less than 5 years' time. At the end of the same amount of time, Japanese stocks were still down by almost 50 percent.
International markets appear to be more comfortably valued than the U.S., but in absolute terms, are either modestly over or undervalued based on P/E ratios, are mostly overvalued based on dividend yields, and are near long-term average levels of valuation using combined metrics. Looking ahead over the next few months, European markets will likely track investor sentiment about the outcome of the European debt crisis. The lessons of the Big Five credit crises provide a way for investors to benchmark any progress. --- The foregoing comments represent the general investment analysis and economic views of the Advisor, and are provided solely for the purpose of information, instruction and discourse. Prospectuses for the Hussman Strategic Growth Fund, the Hussman Strategic Total Return Fund, the Hussman Strategic International Fund, and the Hussman Strategic Dividend Value Fund, as well as Fund reports and other information, are available by clicking "The Funds" menu button from any page of this website. |
|||||||||||||||||||||||||
|
For more information about investing in the Hussman Funds, please call us at
1-800-HUSSMAN (1-800-487-7626) 513-326-3551 outside the United States Site and site contents © copyright Hussman Funds. Brief quotations including attribution and a direct link to this site (www.hussmanfunds.com) are authorized. All other rights reserved and actively enforced. Extensive or unattributed reproduction of text or research findings are violations of copyright law. Site design by 1WebsiteDesigners. |