|
|
||||||
|
|

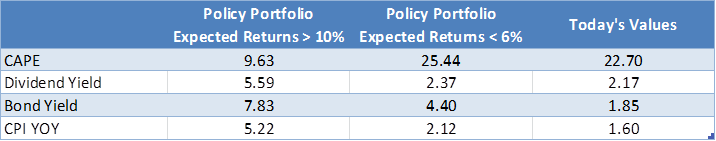
The Policy Portfolio and the Next Equity Bear Market A Scenario Analysis The Policy Portfolio – the framework used by institutional investors to allocate assets based on expected risks and returns in order to meet liabilities – has been under attack for some time. Peter Bernstein, the widely respected financial economist and historian, suggested more than a decade ago that the process of putting asset allocation decisions on autopilot would need to come to an end. He suggested that a more flexible and opportunistic investment strategy was going to be demanded until bond and stock valuations once again became attractive. Considering the tremendous amounts of volatility stock investors have had to deal with over the last decade and the returns from holding a mix of bonds and stocks that investors should expect to earn over the next decade, Mr. Bernstein, who passed away in 2009, would surely be making the same argument. Very likely, he’d be making it even more emphatically. This is an important topic not only for institutional investors, but for individual investors as well. Because either advisor-directed or by personal decision, many households hold a type of policy portfolio. A portfolio that is a mix of stocks and bonds – one that is initially allocated mostly toward equity positions, then as savers move toward retirement becomes increasingly weighted toward bond positions. For our purposes we’ll consider just a simple mix of US bonds (intermediate US Treasuries) and US stocks (the S&P 500). Two topics are interesting to discuss with regard to this basic mix. One is the long-term expected return of a balanced portfolio. The other, less discussed but potentially equally as important, is what investors should expect from bonds through the next equity bear market. We’ll take each topic in turn. Valuations and the Expected Return of the Policy Portfolio For those investors whose spending requirements are near and can’t afford to be over-exposed to the volatility of equities, these are bleak days. The 10-year expected return for a portfolio with the majority of its assets in bonds is at the lowest level in almost a century of data. Investors with a more traditional mix of 60 percent stocks and 40 percent bonds, face a likely expected return in the bottom 11 percent of history dating back to 1925. Lower levels of expected returns existed only at the peak of the stock market in 1929 and periodically during the last decade and a half. These prior occurrences mostly reflected extremely poor expected (and generally realized) equity returns. Currently investors face a combination of poor expected equity and bond returns. The explanation for the low expected 10-year returns of a balanced portfolio is straightforward. Price multiples on normalized earnings are high, while dividend yields and bond yields are low. As the table below suggests, strong balanced portfolio returns have historically followed characteristics much different than today. The strongest returns in a balanced portfolio have followed periods where the CAPE Ratio (the P/E Ratio using a rolling 10-year average of inflation-adjusted earnings) was below 10, dividend yields were above 5 percent, bond yields were near 8 percent, and the rate of inflation was high. Low returns have followed characteristics that are more similar to today – a CAPE ratio in the mid-20’s, where dividend yields, bond yields, and inflation were below average. The table shows the average stock, bond and inflation conditions that have historically been associated with expected policy portfolio returns of greater than 10% and less than 6%, along with today’s values for these conditions.
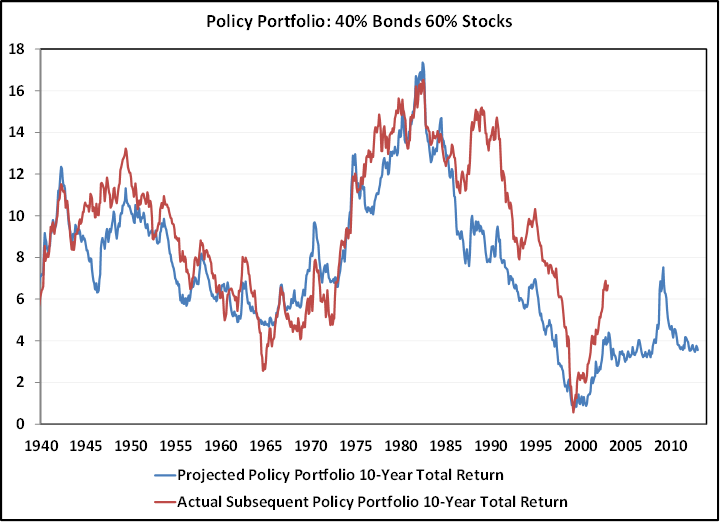
The graph below plots the rolling 10-year expected return (in blue) of a portfolio if 60 percent was held in stocks while the remaining 40 percent was invested in intermediate US Treasury bonds. The red line is the actual subsequent 10-year return earned by holding this particular policy portfolio. The expected return estimate is a simple weighting of the 10-year expected return of the S&P 500 and the expected return of intermediate-term Treasury bonds. I’ve used John Hussman’s method of estimating expected returns for stocks (using a simplified version the model that relies on just the CAPE ratio) and the beginning bond yield for the expected return for the bond portion of the portfolio. Even when using bond index total returns, the current starting bond yield has been highly accurate in predicting returns over the life of the bonds. According to Roger Ibbotson’s data, the coupon return has made up 90 percent of intermediate bonds total returns, and expected bond returns and starting yields have tracked well. The current expected total return of a balanced portfolio (60/40) is currently 3.5 percent, which is in the lowest 11 percent of data since 1925 (shown since 1940).
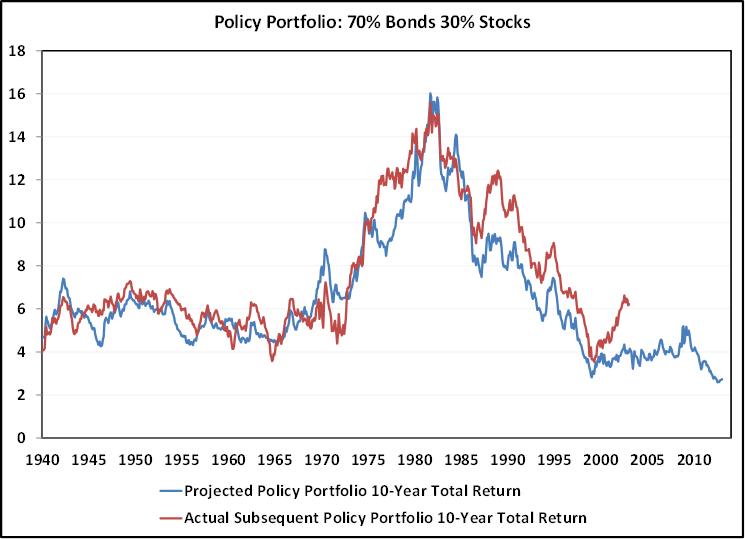
The outlook is considerably bleaker for those investors that are tied to a passive exposure in bonds. The graph below shows the expected 10-year return of a portfolio that’s weighted 70 percent in bonds and 30 percent in equity. Even including data back to 1925, there has never been a lower level of expected returns for a balanced portfolio heavily weighted toward bonds. Even during the 1940’s when bond yields were low, stocks were much better values than today, boosting long-term expected returns to about 6 percent. With both bonds and stocks offering such low expected returns, the current expected return on this portfolio is just 2.7 percent.
The Policy Portfolio and Equity Bear Markets The decision to question the near-term future performance of the Policy Portfolio shouldn’t be taken lightly. It’s entrenched into institutional investor thinking for good reason - it’s been a tremendously successful strategy. According to Roger Ibboston’s data that reaches back to 1926, a portfolio split evenly between stocks and bonds has the highest Sharpe Ratio of all of his indexes. The Sharpe Ratio measures return (in excess of risk-free interest rates) per unit of risk. By total returns, stocks have outperformed bonds by a wide measure, but those returns have come with much higher volatility. Since 1926, small company stocks have returned 11.90 percent annually. But those returns have occurred with a standard deviation of 32 percent. On a risk-adjusted basis, both small-company and large-company stocks sit in the bottom half in the table below.
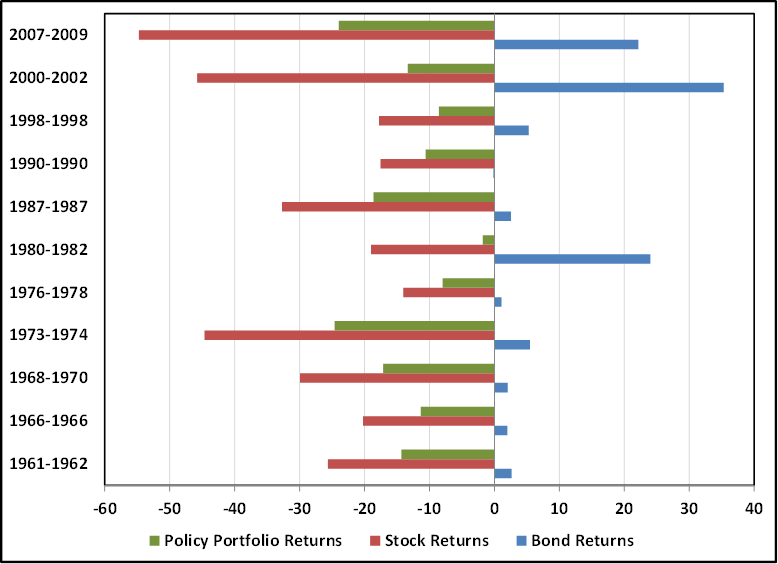
The benefit of diversifying across stocks and bonds is not simply due to the lower volatility of bonds. That characteristic wouldn’t be enough for a balanced portfolio to close the spread between historical bond and stock returns. It’s that bonds are less volatile and their prices tend to rise when stock prices fall, boosting the competitiveness of a balanced portfolio versus a stock-only portfolio. This has certainly been the case historically, at least. Bonds do their best work for a balanced portfolio during equity bear markets. The average annualized weekly return of stocks outside of equity bear markets since 1940 has been 21%. The average annualized weekly return of bonds outside of equity bear markets has been 5.51%. Now contrast these returns with performance during equity bear markets. The average annualized weekly return of stocks inside of equity bear markets since 1940 has been -24%. The average annualized weekly return of bonds inside of equity bear markets has been 7.89%. Clearly, bond holdings have been most beneficial when stocks are declining, and a drag on over-all performance when stocks are rising, on average. The graph below puts some of these ideas into perspective. It plots the returns of bonds, stocks and a balanced portfolio (60 percent stocks, 40 percent bonds) during each equity bear market since 1960. It shows that in each equity bear market, bond returns were flat or, in the majority of cases, positive. In each case holding bonds diminished the impact of the drawdown in equities during these bear markets. It’s interesting to note, though, that bonds had minor gains during the majority of equity bear markets – typically less than 5 percent. There are three equity bear market periods that stand out though because bonds delivered larger gains, including the 2007, 2000, and the 1980 bear market. The two most recent bear markets, strong bond returns helped offset deep declines in equities, helping the balanced portfolio incur less than half of the drawdown of an equity-only portfolio.
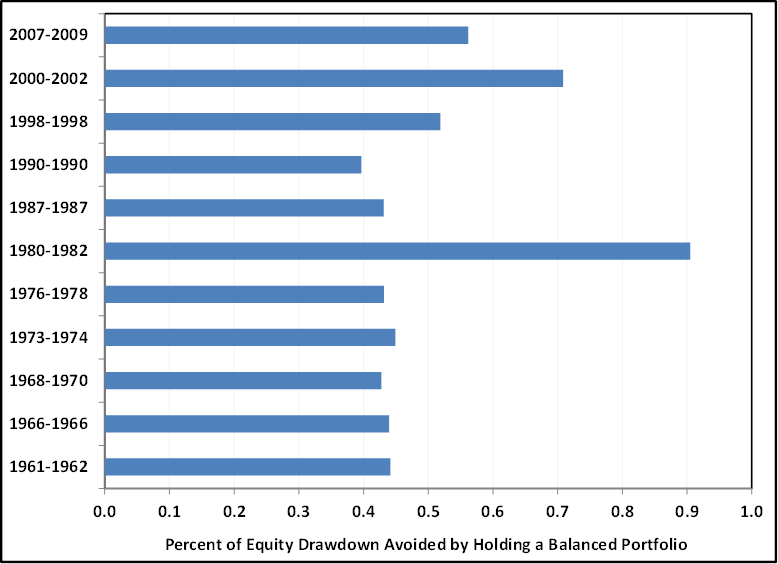
When looking at the above chart, it’s clear that investors that held bonds through the last two equity bear markets were especially fortunate. During the 2007-2009 bear market, intermediate Treasury bonds returned 22 percent. During the 2000-2002 bear market, these bonds return 35 percent. Outside of the 1980 bond performance (when yields dropped from nearly 14 percent to 9.5 percent), the two most recent equity bear market performances by bonds really stand out. The other equity bear market performances for bonds have been much more muted. But even those low but positive returns have been able to dramatically reduce the volatility of a balanced portfolio. The graph below highlights the percent of equity drawdown avoided by holding a balanced portfolio. So, a blue bar that reaches .5 means that the policy portfolio experienced only half of the drawdown that the equity portion of the portfolio experienced.
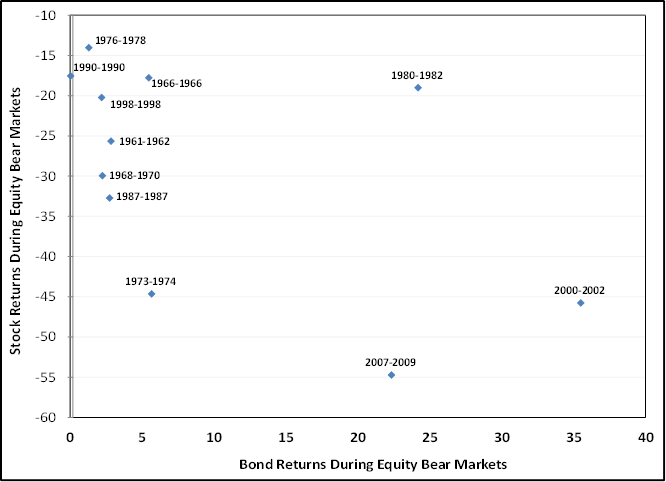
Putting aside the performance of bonds during the bear market beginning in 1980 (both because the starting yields on Treasuries were so high but also because the bear market was relatively mild as the decline began from relatively low levels of valuation), what’s interesting about the above chart is how dependably bonds protected a portfolio during equity bear markets. During all of the bear markets from 1960 to 1990, balanced portfolios avoided about 40-45 percent of the total equity drawdown (except for 1980, where 90 percent of the drawdown was avoided). Of course, this is what you would expect with 40 percent of the portfolio allocated toward an investment that was unchanged or had a small positive gain. But it is still surprisingly consistent considering these equity bear markets were of different durations, different depths, and all began with bond yields at different levels. Notice that during the last three bear markets, and especially during the last two major stock-market declines beginning in 2000 and 2007, bonds ramped up their defensive characteristics, helping a standard policy portfolio avoid between roughly 55 and 70 percent of the drawdown. And when those bear markets represent two of the three worst bear markets in the last 80 years, it highlights how especially fortunate investors who held balanced portfolios in these periods were. Why do Bonds Provide Protection in Equity Bear Markets? If much of the investment into bond mutual funds that has occurred the last couple of years is for purposes of dampening the volatility of a portfolio – and with the 10-Year Treasury yield at 1.8 percent it’s difficult to argue for a different motivation - then it’s important to think through the thesis that bonds will defend a balanced portfolio in an equity bear market in the same way they have, especially to the extent they have in the last two bear markets. Are bonds automatic portfolio stabalizers? Or in today’s parlance, are they full-time risk-off investments? If that’s the case then when stocks drop by a small amount, bonds would rally by a small amount. And if stocks drop a lot, bonds would rally a lot. Unfortunately, there’s not a lot of evidence to support this argument. The graph below is a scatter graph that compares the drawdown experienced during each equity bear market since 1960, and the corresponding performance of bonds during that period. You can see that there’s not much of a relationship. During relatively mild equity bear markets, like the one from 1980 through 1982, bonds rallied strongly. And during the 1973-1974 equity bear market – where stock indexes dropped by half – bonds returned just 5 percent, compared with gains of 36 percent during the 2000-2002 bear market, which experienced a simliarly-sized decline.
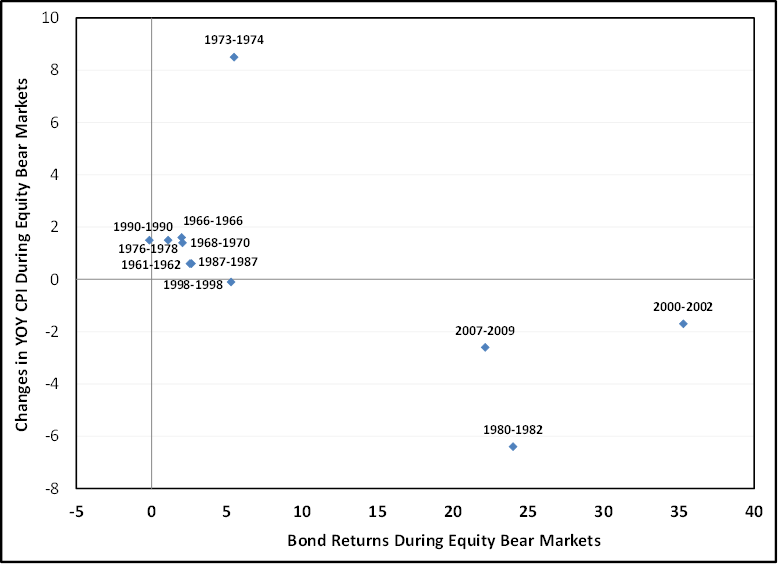
So when do bonds rally strongly during equity bear markets, and when do they post more modest gains? It turns out that when you compare the performance of bonds with the direction of inflation during bear markets, the relationship strengthens. As Japan’s JGB market has shown for a decade, you don’t need high yields to see impressive gains in bonds. You just need collapsing inflation and inflation expectations. The graph below compares changes in the year-over-year CPI index during each equity market with the performance of bonds during the same period.
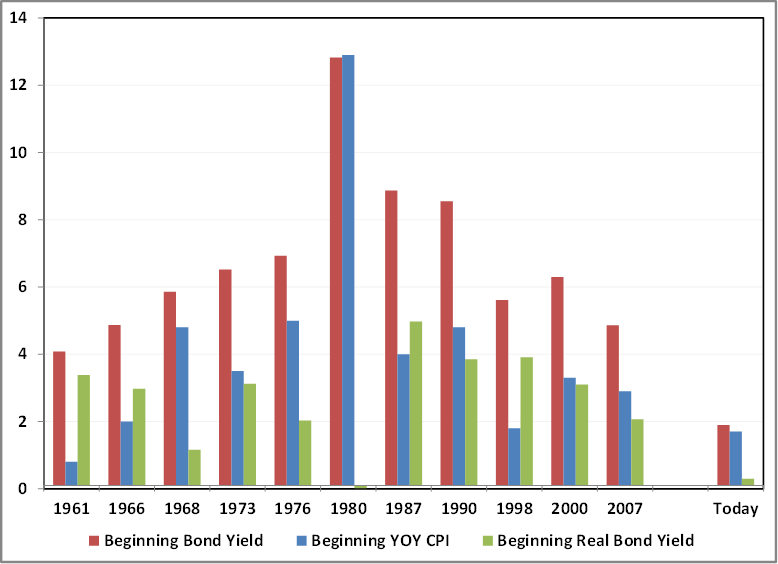
Let’s start with the clump of observations hugging the vertical axis. You can see that bond returns were modest during these equity bear markets, even though the depths of those bear markets varied. But during these periods inflation was mild, ranging from being unchanged to rising by less than 2 percentage points. Another interesting characteristic these bear markets share is that they didn’t coincide with deep recessions, and the majority weren’t even recession induced – including bear markets beginning in 1961, 1966, 1976, 1987, and 1998. The observations that sit outside of this clump, all coincide with important recessions, including bear markets beginning in 1973, 1980 (two recessions back to back), 2000, and 2007. But even though these periods shared deep recessions, the direction of inflation during these periods differed. During bear markets beginning in 1980, 2000, and 2007 – the ones in which bond exposure was most helpful – the rate of inflation declined. During the bear market beginning in 1973, the inflation rate increased by more than 9 percentage points – from 3.4 percent to 12.4 percent. Fortunately, with coupons of 7.5 percent, bond returns were still positive during this period, even if muted. Policy Portfolio Scenario Analysis The best framework for bonds protecting portfolio capital during equity bear markets is: average to above-average starting bond yields, with an average to above-average rate of inflation – which is set to decline in a recession-induced bear market. How do current characteristics match up to the typical favorable set-up for bonds? The graph below plots three characteristics that were present at the beginning of each bear market going back to 1960 – the rate of inflation, the prevailing bond yield, and the real after-inflation bond yield. The last set of three bars plots the current levels of these three metrics.
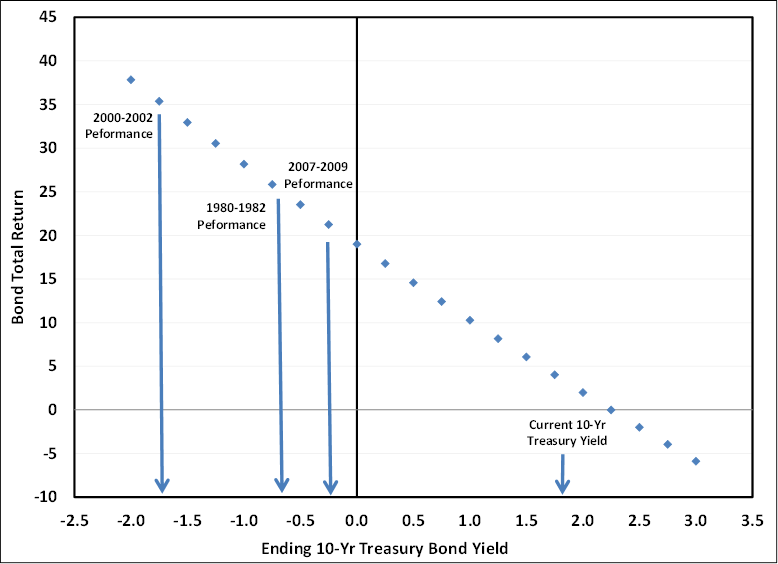
The graph above shows that investors will likely be entering the next equity bear market at the lowest level of yields in more than 50 years. The change in the rate of inflation is one of the determining factors in how well bonds protect balanced portfolios during equity bear markets. But the rate of inflation is beginning from a far lower level than is typical. Real yields – using the trailing CPI inflation rate – have little distance to travel before going negative. Based on yield on inflation-protected Treasury bonds, real yields are already negative. That doesn’t mean that an economic recession or a deflationary scare cannot drive bond yields still lower, but it is important to notice that investors are already starting from a very low base. We can use these characteristics and our dataset of bond performance during equity bear markets to run a what-if analysis on possible outcomes. For bonds to defend against declining equity values, where do bond yields need to fall? The graph below plots the ending bond yield that corresponds to different levels of bond return (assuming a one-year holding period). I’ve also marked on the graph the level that yields would need to fall to in order to match the total return earned during prior equity bear-market periods.
Notice that unless interest rates were to fall to negative levels, investors cannot expect bonds to provide the same portfolio benefit as they have during bear markets in recent memory. From this analysis, those investors who are relying on a policy portfolio framework to protect their capital during the next bear market are left with a limited range of favorable outcomes. The best outcome would be a mild equity correction or bear market that coincided with a stable or falling rate of inflation. In this scenario, bonds could rally their standard 3 to 5 percent as stocks fell 15 or 20 percent. In this outcome, the balanced portfolio would likely avoid a little more than 40 percent of the decline the equity portion would experience. If a larger decline in stock prices were to occur, and for bonds to still defend against losses to the extent they have during the last two bear markets, yields on US Treasury notes would need to go negative. In data reaching back to 1871, this has never happened. That would likely result from an expectation for deep deflation. With stocks at currently high multiples on normalized earnings, that type of scenario would probably increase the odds off a deep recession and induce a much larger decline in stock prices. Inflation expectations may also play an important role in the next equity bear market. Implied inflation (the difference between 10-year nominal and 10-year real yields) fell nearly 100 basis points during the 2000-2002 bear market. Implied inflation fell by more than 250 basis points in the 2007-2009 period, as investors piled into the safest, most liquid Treasury bonds, and began to contemplate long-term deflation. These declines in inflation expectations fueled bond rallies offsetting more of the equity declines experienced in these bear markets than was typical. With the Federal Reserve’s balance sheet at $3 trillion and rising, it’s worth considering that bond investors may not aggressively push inflation expectations lower in the next recession as they have in recent recessions. One unintended consequence of eternal QE may be that holders of balanced, passive portfolios don’t see the same defensive performance from bonds as they have historically. Considering the low yield bond investors are earning during sunnier days for equity-only investors, when the storm comes, that outcome would be particularly painful. It’s difficult to argue with nearly 90 years of data showing that a simple balanced portfolio of stocks and bonds has been an effective passive risk-adjusted strategy. But it’s equally as difficult to argue with basic arithmetic. Prospective returns for a balanced portfolio are at some of the lowest levels in history. Intermediate-term Treasury prices reflect a yield-to-maturity of about 2 percent over the next decade. Stocks will likely earn slightly more, but with much more volatility. Worse, without a collapse in an already low rate of inflation, bonds may not provide the same offset to declining equity values like they have in recent equity bear markets. As Peter Bernstein suggested, a more flexible and opportunistic investment strategy is going to be demanded until bond and stock valuations once again become attractive. --- The foregoing comments represent the general investment analysis and economic views of the Advisor, and are provided solely for the purpose of information, instruction and discourse. Prospectuses for the Hussman Strategic Growth Fund, the Hussman Strategic Total Return Fund, the Hussman Strategic International Fund, and the Hussman Strategic Dividend Value Fund, as well as Fund reports and other information, are available by clicking "The Funds" menu button from any page of this website. |
|||||||||||||||||||||||||
|
For more information about investing in the Hussman Funds, please call us at
1-800-HUSSMAN (1-800-487-7626) 513-326-3551 outside the United States Site and site contents © copyright Hussman Funds. Brief quotations including attribution and a direct link to this site (www.hussmanfunds.com) are authorized. All other rights reserved and actively enforced. Extensive or unattributed reproduction of text or research findings are violations of copyright law. Site design by 1WebsiteDesigners. |