|
|
||||||
|
|

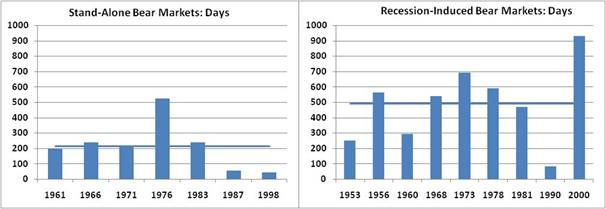
Recessions and Stock Prices Recession-induced bear markets are much different than "stand alone" declines In August of 2001 Ben Bernanke, then chair of the economics department at Princeton, was asked by the university's newspaper whether he believed the economy was heading for a recession. He said that outside of the technology industry, the economy was reasonably healthy and that tax cuts and the recent interest rate cuts by the Federal Reserve Board would be enough to give the economy a boost. "I think there's a good chance we'll dodge the bullet this time," he said. The NBER - with the help of Mr. Bernanke, who at that time was a member of the group's Business Cycle Dating Committee - would eventually declare that the 2001 recession began 6 months earlier in March. The economy would trough in November of that year. Mr. Bernanke was hardly alone in that forecast. More than 90 percent of economists polled a month earlier by Bloomberg had similar forecasts: slow growth with few expectations for a recession. The issue isn't the accuracy of a single forecast from the Fed Chairman. The point is that recessions are difficult to forecast, and they are even difficult to identify when the economy is already in a recession. Evidence comes in stages and data gets revised. Initial GDP data showed growth in the first 3 months of 1990's recession, but then was later revised to show that the economy had stalled. During those same three months in 1990, the S&P 500 declined by 20 percent. That is the crucial issue. An early recognition that the economy is heading into a recession, or has just entered one, is useful to stock investors because it's in these early stages where much of the damage to stock prices is often done. (Though the 2000-2002 bear market showed that stock prices can continue lower long after the economy begins to recover.) Bear Market Characteristics The chance of a recession has increased as new economic data has been released over the last two weeks. Nonfarm payrolls this month showed a contraction for the first time in four years, and both industrial production and retail sales came in lower than expected on Friday. With this higher chance of a recession, comes an increased risk of further weakness in stock prices. Although stock market declines have been a less than perfect indicator of an oncoming recession, the record of bear markets coinciding with recessions is impressive. In every case that the economy has gone into a recession since 1950, stocks have declined meaningfully. Rising expectations of a recession may shift the debate about expected stock returns. Most of the calls for higher prices have been based on what some have argued as attractive valuations or for continued growth in the level of index earnings. Even less optimistic investors assume any correction from these levels will be brief. But bear markets that coincide with recessions have very different characteristics than "stand alone" bear markets. It is important to understand those differences. Specifically, we can highlight the characteristics of recession-induced bear markets by comparing them to stand-alone bear markets, or those that have occurred outside of recessions. Since 1950 there have been 16 declines in the S&P 500 of at least 15 percent. Nine have coincided with recessions. The charts below show the duration of each bear market in days. Stand-alone bear markets have tended to be shorter in duration. The seven stand-alone bear markets have had an average duration of 215 days. They include the 1987 decline, which bottomed 55 days from the peak in the market, and the 45-day correction in 1998. The 1976 stand-alone bear market was the outlier here, lasting more than 500 days.
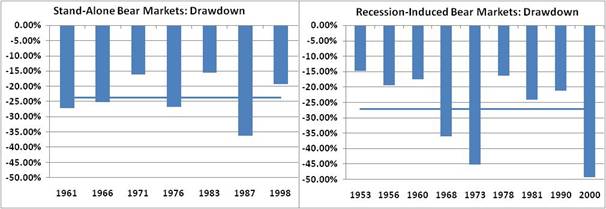
Recession-induced bear markets tend to be longer, more drawn-out affairs. Stocks head lower over time as bad news continues to trickle out. The average length of recession-induced bear markets is 491 days, more than twice the duration of stand-alone bear markets. The 1990 decline was the only brief recession-induced bear market, lasting less than 100 days. The next set of charts shows the decline in the S&P 500 from peak to trough during each bear market. Although the average decline is similar, there are important differences in the individual outcomes. Outside of 1987, stand-alone bear market declines have held in a relatively tight range. Half of these bear markets (1961, 1966, and 1976) resulted in roughly 25 percent declines while the other half (1971, 1983, and 1998) experienced between 15 percent and 20 percent declines.
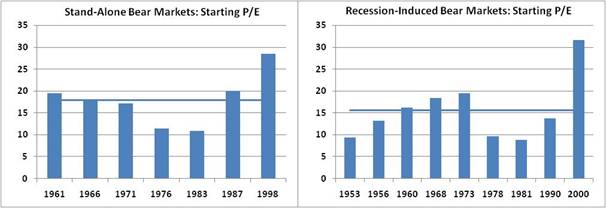
The depths reached during recession-induced bear markets have been more variable. In three cases the S&P 500 dropped by more than 35 percent, including the bear markets beginning in 1973 and in 2000. Stocks declined by 36 percent during the 1968 bear market as investors grappled with the first recession in almost 10 years, the longest recession-free stretch up to that point. The next set of graphs shows the Price-to-Peak-Earnings Ratio at the start of each bear market. Stand-alone bear markets have begun at higher valuations, on average. Except for the 1976 and 1983 declines that started at less than 12 times earnings, most began at or above current valuations. Two started at around 17.5 times earnings (1966 and 1971), and two more at around 20 times earnings (1961 and 1987). The 1998 bear market started from an even higher 28.5 times earnings.
Now look at the graph of P/E's at the start of recession-induced bear markets. One clear characteristic of recession-induced bear markets is that they are indifferent to the level of starting valuation. The 2000 bear market began at a record 32 times earnings. But five of the nine recession-induced bear markets began from a multiple of less than 15 times peak earnings. Three started from a price to earnings ratio of less than 10. Recession Indicators While it's too early to confidently say that the economy is heading for a recession, signs continue to grow. Of the four indicators in Dr. Hussman's recession risk composite, two have turned negative. Credit spreads continue to be elevated versus their levels earlier this year, and the slope of the Treasury yield curve remains flat. The two remaining indicators have held up. The six-month return of stocks remains positive and the latest reading on the ISM Manufacturing Index still shows expansion. The ISM Manufacturing Index is worth watching here, especially after this month's payroll number. The view of the economy from these reports has diverged. This usually doesn't continue for too long. Since 1950, when the 6-month growth rate in payrolls has fallen below 0.5 percent, the average level of the ISM index has dropped to 46.4. Another indicator of an oncoming recession was suggested by New York Times columnist Floyd Norris this past weekend. He showed that two recently observed conditions also existed prior to the last two recessions. The 6-month change in employment (using Household Survey data) had turned negative and the spread between 2-year Treasury yields and the Fed Funds rates fell to less than -1.3 percentage points. This yield spread fell to similar levels prior to both the 1990 and 2001 recession. The six-month change in employment data turned down in the same month the 1990 recession began, and a few months before the 2001 recession. Though simple in its construction, it's an intuitive combination of data. When the two-year Treasury yield falls steeply below the Fed Funds rate, the market is already anticipating weakness that the Fed tends to be slower to recognize. Weakening job growth data provides early evidence of that economic weakness. Curious about whether this indicator held up over data further back, I extended Mr. Norris's research. I substituted the Fed's Discount Rate for the Funds Rate, and used the one-year Treasury yield. Both decisions were based on data availability. This slightly different combination of indicators turns out to be effective in historical data as well. In the eight recessions since 1955 these two warnings emerged prior to or during seven of them, missing only the slowdown beginning in 1969. There were no false signals. This combination of indicators is also warning of potential weakness today. Recessions present multiple layers of risks to investors. They are difficult to forecast. They are often difficult to identify even after they've begun. The bear markets they spawn are longer in average duration, represent some of the deepest declines, and are indifferent to starting P/E multiples. And most maliciously, much of the damage to stock prices is often done in a recession's early stages, when the economic evidence is the foggiest. Even so, there are various sets of indicators that have a good record for identifying recession risk. With those indicators increasingly giving warning signals, investors should be vigilant. --- The foregoing comments represent the general investment analysis and economic views of the Advisor, and are provided solely for the purpose of information, instruction and discourse. Prospectuses for the Hussman Strategic Growth Fund, the Hussman Strategic Total Return Fund, the Hussman Strategic International Fund, and the Hussman Strategic Dividend Value Fund, as well as Fund reports and other information, are available by clicking "The Funds" menu button from any page of this website. |
|||||||||||||||||||||||||
|
For more information about investing in the Hussman Funds, please call us at
1-800-HUSSMAN (1-800-487-7626) 513-326-3551 outside the United States Site and site contents © copyright Hussman Funds. Brief quotations including attribution and a direct link to this site (www.hussmanfunds.com) are authorized. All other rights reserved and actively enforced. Extensive or unattributed reproduction of text or research findings are violations of copyright law. Site design by 1WebsiteDesigners. |