|
|
||||||
|
|

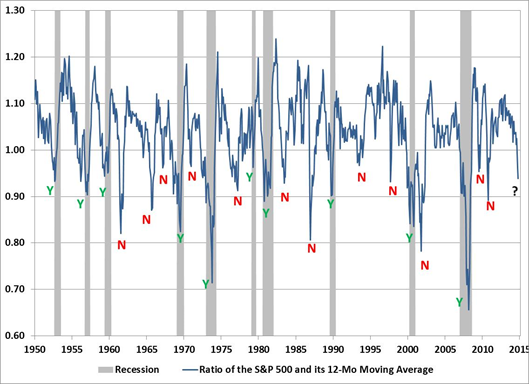
When Market Trends Break, Even Borderline Data Is Recessionary Recession risk is highly dependent on information from stock prices In his September 1966 Newsweek column the economist Paul Samuelson quipped that the stock market had predicted nine of the last five recessions. Although it was originally delivered as a joke, in the nearly five decades since the statement it has turned out to be an accurate description of stock movements and the economy. Since 1950, the market has fallen decidedly below its 12-month moving average 22 times while the economy has experienced 10 recessions, holding fairly close to Samuelson’s originally suggested ratio.
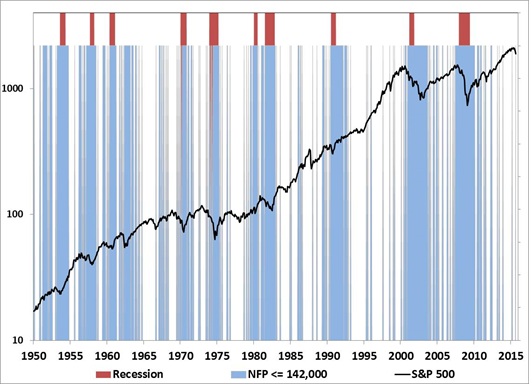
While Samuelson’s quote is often used in a dismissive way to suggest that stock market corrections have no role in forecasting the economy, it’s sometimes overlooked that over the past 65 years, a drop in stocks has occurred prior to or at the start of every recession, without missing a single contraction. Stock market declines clearly play a role in anticipating recessions, even if they don’t always signal recessions all by themselves. While it may be preferable to exit the market or hedge equity exposure prior to a decline, this is valuable information – even once a decline is underway – that can be used to gauge further stock market risks. And it turns out that a drop in the stock market, when combined with a set of capable leading economic indicators, better classifies economic and stock market risks than relying on economic indicators alone. Stock market corrections come in two forms, although the two often overlap one another. One is a pure contraction in valuation multiples, where prices plummet but fundamentals like revenue and earnings remain mostly unchanged. This typically occurs when there is an abrupt change in investor attitudes toward risk. The correction of 1962 and the crash of 1987 are examples of these kinds of corrections. The economy continued to expand for years after each market correction. The second type is coupled with broadly worsening fundamentals, where the economy slows, earnings get hit, and stocks fall. Of course, as the outlook dims for earnings, investors often drive down the valuation multiples paid for those earnings as well. That’s why stock market corrections within and around recessions tend to be the deepest. So once market action breaks from a long-term uptrend, watching measures of economic activity becomes that much more important. To demonstrate this, there are two sets of companion charts below. The first chart shades periods where a given economic indicator is at or below its current level. The second chart restricts the shading to periods where the economic data is at or below its current level and the stock market has broken its 12-month moving average. Also plotted on each chart is the S&P 500 on a log scale and US recessions, both since 1950. The first chart uses the latest employment data, which was released on Friday. Even though the change in total nonfarm payrolls came in weaker than expected at 142,000 net jobs added, this report was still stronger, on the spectrum of economic announcements, than other recent data on manufacturing and production. With 142,000 jobs added to the economy, this number alone would suggest that recession risks aren’t too high. The blue shading in the graph below shows instances when the monthly change in payrolls has been less than 142,000. That has occurred about half the time, and as a single indicator of oncoming economic weakness, it’s not very useful.
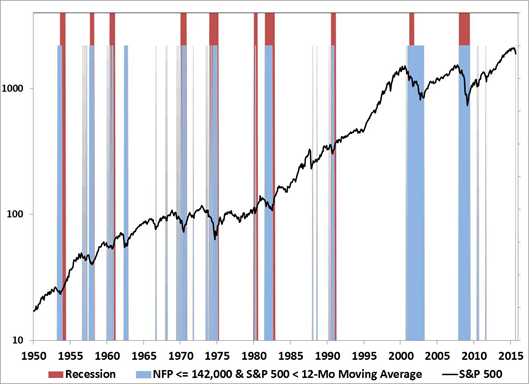
Currently, the S&P 500 is down about 8 percent from its May high, and has dropped below its 12-month moving average. When we combine these two characteristics – the economy adding 142,000 jobs or fewer and the S&P 500 below its 12-month moving average – the total number of occurrences drops by about half, and the remaining instances tend to group around recessions. There are periods where these characteristics are found outside of recessions – such as in 1987 and earlier in the recent expansion. But the majority of these instances tend to occur within or immediately surrounding recessions.
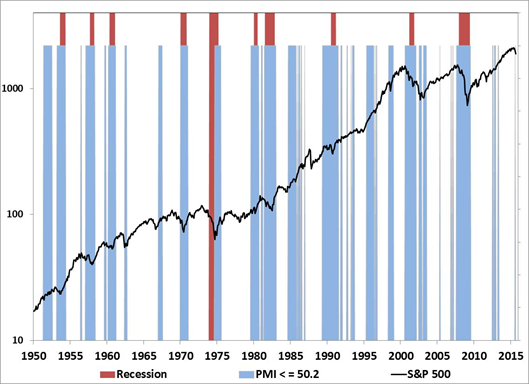
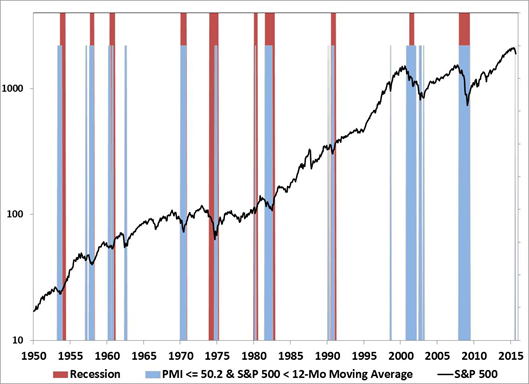
Let’s look at an economic series that has been slightly weaker than the payroll data, but not yet showing outright contraction. The PMI, which was released on Thursday, came in at 50.2, just above the level of 50 which divides the activity reported in the manufacturing sector between expansion and contraction. Based on the weakness of the other September regional surveys, this number could easily have come in a point or two below 50. So it’s a number worth watching. In the graph below, the blue shading highlights the periods where the PMI has been equal to or below 50.2. As you can see again, there’s not a lot of value gained by responding to a PMI of 50.2, in and of itself. There are too many periods where a recession does not follow.
But when you consider that the market is trading below its 12-month moving average, a PMI at the current level of 50.2 or lower overlaps recessions much more consistently.
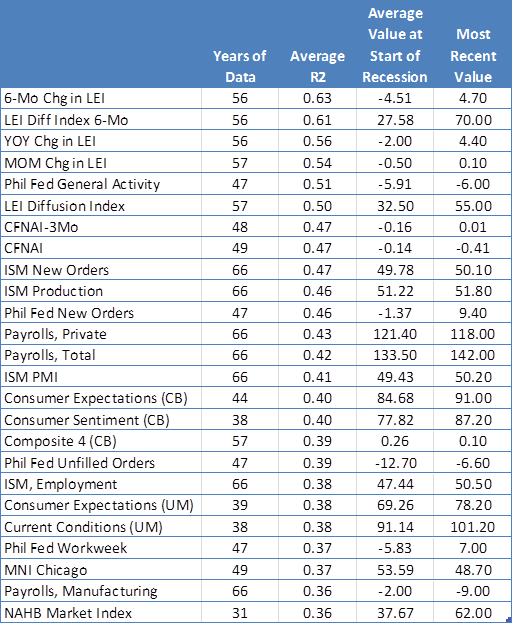
The Recession Overlap Percentage Both of these examples show the power of looking at stock market risks and opportunities through a prism of conditional probabilities. The idea of “conditional probability” is that the probability we estimate for some event (such as a recession) given only information “A,” is often different than the probability of that same event given information “A and B.” The second chart for each data series above is a basic example of conditional probability. We’ll use this idea now to compare recession risks for different economic data under two scenarios: when the S&P 500 is above its 12-month moving average, and when it’s below. In each case, we’ll compare the percent of time each classification overlaps with recessions. To simplify the discussion I’ll just refer to these as Recession Overlap Percentages. For example, When Nonfarm Payrolls have been at their current level or less and the S&P 500 has been above its 12-month moving average, the economy has been in recession 12 percent of the time. But when the S&P 500 has been below its 12-month moving average, the same payroll data has been accompanied by a recession 60 percent of the time. When the PMI has been at its current level or less and the S&P 500 has been above its 12-month moving average, the economy has been in recession 20 percent of the time. When the market’s trend has been broken, the same PMI data has been accompanied by a recession 75 percent of the time. Let’s give this method of analysis more data to see if a wide array of leading indices also suggests a spike in recession risks following the recent stock market decline. We begin with 180 economic indicators. They include well-known leading indexes, like the Conference Board’s Index of Leading Indicators, but also output and production data, inflation and price indexes, consumer and housing data, and more than 50 regional PMI surveys. We run multiple correlation calculations on each index versus a column of ones and zeros, indicating whether the economy is in recession or not. The first calculation is a coincident calculation, where each data set is compared with the same month for the recession indicator. Then we walk the recession data series forward one month, then two, repeating this process until the recession indicator is moved ahead by 6 months. Then we simply take an average of the correlations, for a single estimate of an indicator’s ability to anticipate recessions. A few words on this method of analysis: If the goal was to produce a recession indicator, there are better ways to go about it, including standardizing the data and taking the growth rate of any series that doesn’t oscillate within a steady range. But the research question we’re answering is much more focused and direct: Does knowing that the market has broken a sustained uptrend affect the odds of a recession, and by how much do those odds increase? The second point is that data that is mostly unrevised is always better than data that goes through multiple revisions. This doesn’t apply only to government data like payrolls. The Conference Board’s Leading Index has been re-worked multiple times. This has been for the better, as the overall Index and its components have done a good job of forecasting recessions (and financial indicators like the stock market are included in it, which helps). But if the goal was to produce a recession indicator, a broader set of indicators including those outside of heavily revised data sets would also be advisable. As it stands, some portion of the LEI’s apparent usefulness is likely related to revisions in the formulation of the index, producing data that would not have been available in real-time. The table below shows the results of this analysis. The indicators are ranked by the ability of each to predict recessions. The list is limited to the top 25 economic indicators. The first column shows the number of years of data available for each series. The second column shows the average recession forecasting accuracy of the data series. The third column shows the average value of each series at the beginning of recessions. The most recent value for each indicator is listed in the last column. Among series that are not highly revised, the ISM Purchasing Managers Index is among the most reliable, which is why it is among the reduced set of indicators in our early-warning Recession Warning Composite. The Chicago Fed National Activity Index (CFNAI) and Philadelphia Fed Index, though more subject to revision, are also worth watching closely.
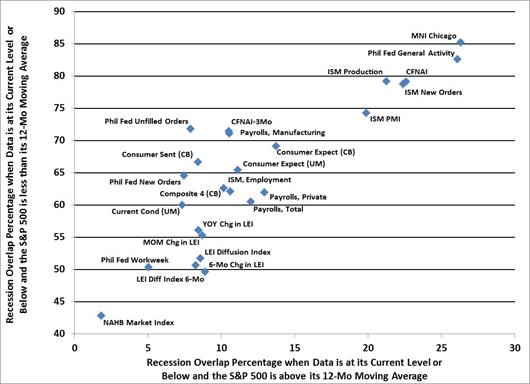
The last two columns offer insight into why the current view of economists (and the view likely embedded in stock prices) is that a recession is very unlikely. Very few leading economic indicators have come in below the level you would typically see at the beginning of a recession. The CFNAI Index, a very broad measure of economic growth and activity tracked by the Chicago Federal Reserve, is lower than what is typical at the beginning of a recession. A few others are also. But the vast majority of economic indicators – looked at in isolation - are not flashing a warning signal. The odds of a recession change measurably, however, if we also include the fact that the S&P 500 has broken its 12-month average. The chart below puts this into perspective. The data points show the Recession Overlap Percentage in two different conditions. The horizontal axis shows the probability of a recession given the current level of each indicator and assuming the S&P 500 is above its 12-month moving average. The vertical axis shows the probability of an oncoming recession given the current level of each indicator and assuming the S&P 500 is below its 12-month moving average.
The chart tells the story of the incoming data well. The housing market is a minor bright spot in the economy, and you can see that the NAHB Market Index is an indicator suggesting the lowest risk of recession. In contrast, the more reliable purchasing manager indices and regional surveys – like the ISM’s PMI survey and the overall Philadelphia Fed Index – are suggesting a higher risk of recession. Except for a few outliers, the most impressive characteristic of the scatter chart is the large clump of readings with a Recession Overlap Percentage (on the vertical scale) of between 50 and 70. Taken together, when the most reliable leading data series have been at or below their current levels, and the S&P 500 has been below its 12-month moving average, the economy has already been in recession 60 percent of the time. The position of this large group of indicators on the horizontal axis is also interesting. The bulk of the individual Recession Overlap Percentages sit between 8-12 percent. This aligns well with the Philadelphia Federal Reserve’s most recent Survey of Professional Forecasters. Economists forecast only a 10 percent chance of an economic contraction in the fourth quarter. This consensus is often called the Anxious Index. While the most recent survey took place prior to mid-August, expectations about a contraction have been trending lower, and because the consensus tends to move slowly, it’s unlikely to rise by much when the new survey is released next month. This expectation for a recession would line up with the historical odds only if the S&P 500 were still trading above its 12-month moving average. The recent deterioration in stock market behavior suggests that the actual odds are considerably higher. The purpose of the discussion is not to suggest that a recession has begun, or that an oncoming recession can be expected with confidence. What is clear, however, is that when stock market action deteriorates and broad economic data is weakening even moderately, the risks of a recession actually jump considerably. The conditional probability of a recession prior to the market falling below its 12-month moving average was just 5-10 percent. It has now jumped to between 60 and 75 percent. This is roughly 6 or 7 times the odds that economists are allowing for a recession. That risk may not yet be priced into the stock market. --- The foregoing comments represent the general investment analysis and economic views of the Advisor, and are provided solely for the purpose of information, instruction and discourse. Prospectuses for the Hussman Strategic Growth Fund, the Hussman Strategic Total Return Fund, the Hussman Strategic International Fund, and the Hussman Strategic Dividend Value Fund, as well as Fund reports and other information, are available by clicking "The Funds" menu button from any page of this website. |
|||||||||||||||||||||||||
|
For more information about investing in the Hussman Funds, please call us at
1-800-HUSSMAN (1-800-487-7626) 513-326-3551 outside the United States Site and site contents © copyright Hussman Funds. Brief quotations including attribution and a direct link to this site (www.hussmanfunds.com) are authorized. All other rights reserved and actively enforced. Extensive or unattributed reproduction of text or research findings are violations of copyright law. Site design by 1WebsiteDesigners. |