|
|
||||||
|
|

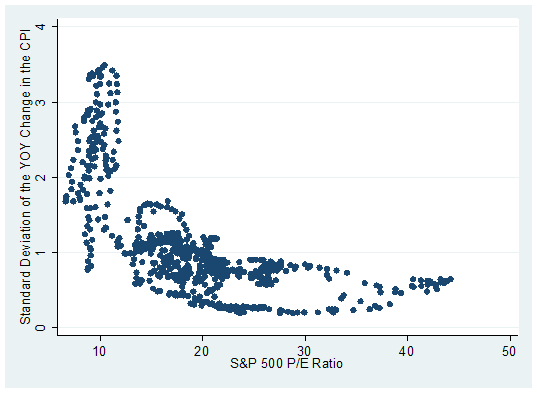
Secular Bear Markets and the Volatility of Inflation William Hester, CFA June 2009 All rights reserved and actively enforced. Reprint Policy The U.S. economy is unlikely to return to its tranquil days of the Great Moderation anytime soon. The 25-year period beginning in the early 1980's represented a uniquely smooth ride for the economy and for investors. The shocks to the economy during this period were smaller in scale and less global in nature. This allowed the growth pattern of the economy to be contained in a relatively tight range. It was also a period where the growth rate in government spending trended lower, which coincided with disinflation. These trends benefited investors greatly. As their confidence that the future would look much like the past grew, so did their willingness to pay higher multiples for stocks. But this almost 2-year old crisis has proved to be larger in nature, centered on the banks and their inability to provide credit, more global, and is mostly being met by a policy response that rests on inflating the Federal Reserve's balance sheet, notable deficit expansion, and issuing large amounts of Treasury securities to pay for the clean-up. Even when the economy begins to rebound, the cures administered to the disease are likely to create economic variability far above the levels of the last two decades, and headwinds for sustained economic growth. As John Hussman recently observed, "economic expansions are emphatically not driven by a 'consumer recovery.' They are invariably driven by swings in gross domestic investment - capital spending, autos, housing, factories, and other outlays that are heavily reliant on debt financing. It is a very hard sell to expect a sustained recovery in debt-financed gross investment in an economy under strong deleveraging pressure. We are in the midst of - and will continue to require - perhaps the largest adjustment in U.S. personal, corporate and government balance sheets that we will see in our lifetimes. This will be a very long slog. The outlook is not up, but very widely sideways." Pimco's Mohamed El-Erian has sounded a similar note, calling this the 'new normal', which may best be described as saying that the next few years will look quite a bit different than what investors are accustomed to. He suggests that stock investors should "recognize that the equity risk premium will now reflect a permanently higher threat of subordination." The abrupt changes to markets, households, institutions, and government policies that have occurred are unlikely to be reversed soon, which will lead to an investing climate of muted world growth, where central banks and treasuries will find it difficult to undo the emergency steps taken, and overall output will fall below longer-term trends. What will the subordination of the equity class mean for the range of valuations that can be expected over the next couple of years? And does the current economic backdrop yet have the characteristics that usually coincide with the end of secular bear markets? The variability of economic growth and inflation matters to investors. When stock investors have difficulty forecasting the cash flows they expect to receive, they raise the discount rate, and valuations fall. Otherwise, the longer the period of economic tranquility the more confident investors become that the future will look like the recent past, and the further they push multiples up. The graph below shows P/E multiples versus the level of volatility in the economy - which we proxy here with the volatility of inflation. (I used a similar graph in Stock Market Valuations Following the Great Moderation , and some of the research below can be thought of as a continuation of the ideas I presented in that article.)
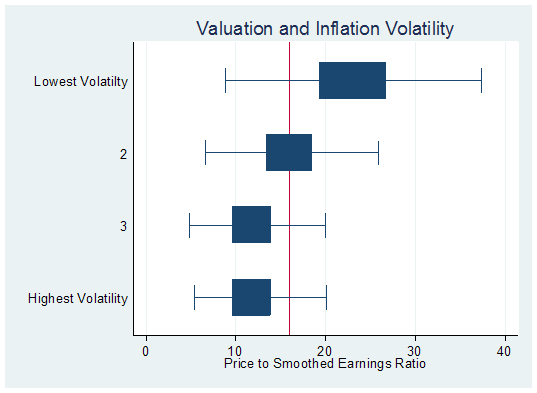
The graph shows that high multiples almost always coincide with low economic volatility, and bubble valuations coincide with very low volatility. On the other hand, high amounts of volatility in inflation nearly always coincide with rock-bottom valuations. (Although we use the volatility of inflation as a proxy for economic volatility in this analysis, we could have also used the volatility of economic output, because the two are highly correlated.) The previous graph gives a good indication of where multiples are given the full range of inflation volatility. But we can look at this association of the variability in inflation and multiples from another angle. We can ask what the typical range of valuation was given a range of inflation variability. We know that generally multiples are low when the variability of inflation is high. But it would be helpful to know what the typical range of valuations was during periods where the variability of inflation has been high or low. The next graph offers some perspective on this. It shows a set of box plots, which represents the range of P/E multiples during periods of differing amounts of inflation volatility. The dark blue section of each box plot represents the spread around each median, and contains half of the data in each period. The lines drawn outside of each of the boxes represent the roughly 25 percent of the data that sits furthest on each side of the median. Valuations are represented by Robert Shiller's P/E based on the 10-year average of real earnings. The red line running through all of the boxes represents the current ratio of price to averaged earnings.
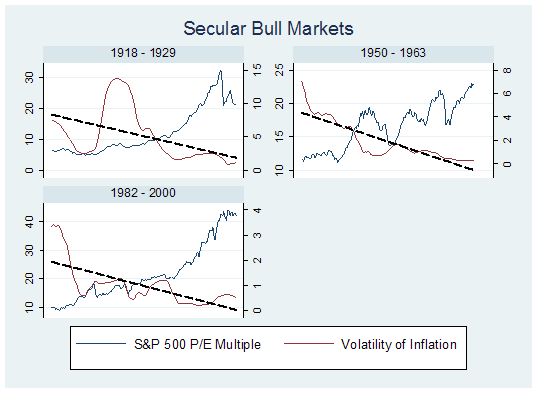
The top plot shows the range of valuations during the periods where inflation volatility was the lowest, like the mid 1950's and the first half of the 1960's. It also includes a large chunk of the 1990's. The bottom plot represents the 25 percent of periods where inflation was the most volatile. These periods are most often represented by high inflation like that of the 1970's, but they also include periods of slight deflation like the late 1940's. This is important to consider, because it's not just inflation that can send multiples lower, but also deflation. It's the uncertainty of future price level direction that has the most direct effect on multiples. The blue blocks show the typical range of multiples (between the 25 th and 75 th percentile), while the endpoints represent the extremes at the 99 th percentile. The data line up as you would expect, considering the relationship between inflation variability and valuation. Periods of low volatility often coincide with higher levels of valuation, and that sort of low economic variability can help to generate stock market bubbles. The plot that is second from the top shows the range of valuations when economic variability is slightly below the median. In this setting, the typical range of multiples is between 14 and 19; the 99 percentile is about 26. For above-average volatility (the two bottom plots) the typical valuation multiples are between about 10 times and 15 times the 10-year average of trailing real earnings. The highest multiple typically seen during these periods is about 20. For a reference point, the P/E on 10-year trailing earnings is currently about 16. Currently, the level of the volatility of inflation is still low compared with the historical range. Present conditions would fall into the 2 nd plot from the top in the graph above. At about 900, the S&P 500 is roughly at the midpoint of normal valuations for this level of inflation volatility. Using the current level of inflation variability as the only measure of investment conditions, S&P levels between 800 and 1100 would represent typical range of variation. A return to 2007 highs would represent bubble valuations in the 99 th percentile. Alternatively, if the next few years include both the effects and the reversal of the recent emergency fiscal and monetary stimulus - call it the Great Unwinding -inflation volatility could move above average, leading to more moderate valuations for the S&P. The 25 th and 75 th percentile for the two bottom plots in the graph above would then suggest a level for the S&P 500 of about 575 and 850. An extreme in the 99 th percentile would be about 1150 on the index. Investors may regain their exuberance and lack of risk aversion during the next couple of years, but it seems unlikely. The 2003-2007 cyclical bull market will very likely go down in the books as an outlier. It's extremely rare for investors to push stock prices back up to near bubble levels immediately following a prior bubble. The recent bull market, coming on the heels of the technology and dot-com crash, was a rare occurrence where leverage, easy credit, a housing market bubble, record profit margins, and inflated earnings (in hindsight), created an atmosphere where investors were once again willing to bid stock prices to (ultimately unrewarding) long-term levels. To illustrate, on the basis of Robert Shiller's P/E ratio, the S&P 500 has tended to peak at about 23 times trailing earnings before declining (although in 1929 they rose above 30 and in 2000 they rose above 40). We can use that level of about 23 times earnings as a benchmark for measuring the length of time between bubble periods where investors disregard risk aversion. The years where the smoothed P/E ratio, after climbing above about 23 times trailing earnings, then fell below that level are: 1900, 1929, 1965, 2002, and 2007. It usually takes about a generation between stock market bubbles for investors to forget the damage done to long-term returns by investing in overvalued markets - 5 years was the outlier. And with profitability, margins, and earnings in the dumps, and with a long climb out in front of them, it's difficult to imagine investors disregarding risk aversion completely again soon. As an aside, the Shiller P/E ratio will be fighting a headwind for at least the next year and half, and probably longer. That's because it's calculated using a 10-year moving average of real earnings. The earliest earnings in the calculation include those generated by companies in 1999 and most of 2000. Prior to profits turning down in September of 2000, earnings were regularly above $50 a share. Current trailing earnings are about $7 a share. Each month, the calculation drops an earnings number from the peak of 1999 and replaces it with the current figure. This creates persistent downward pressure on the trailing real earnings figure. Without an extreme rebound in earnings, this P/E ratio will creep higher over the next year even if the index price remains unchanged. As this ratio has gained in influence during this profits recession, this may not be inconsequential to investors' valuation assessments. Secular Bear Markets and the Volatility of Inflation It's not only the level of volatility and uncertainty in the economy that matters to investors, but also the trend and the persistence in this uncertainty. Shrinking amounts of volatility in the economy creates an environment where investors are willing to pay higher and higher multiples for stocks, while growing uncertainty brings lower and lower multiples. And while there are cyclical gyrations in the volatility of inflation and economic performance, there are also secular trends. These secular trends in the volatility of inflation closely overlap secular stock bull and bear markets. (Secular markets are often defined by their primary trend - up or down - even if over shorter periods they move counter to that trend.) These secular trends can be seen in the first set of graphs below, which show the three secular bull markets of last century which occurred from 1918 - 1929, 1950 - 1963, and from 1982 - 2000. The blue lines (scaled on the left axis) in each of the graphs denote the S&P 500 P/E Ratio. The red lines (scaled on the right axis) track the volatility of inflation during each period. The black dotted lines show the linear trend of the volatility of inflation.
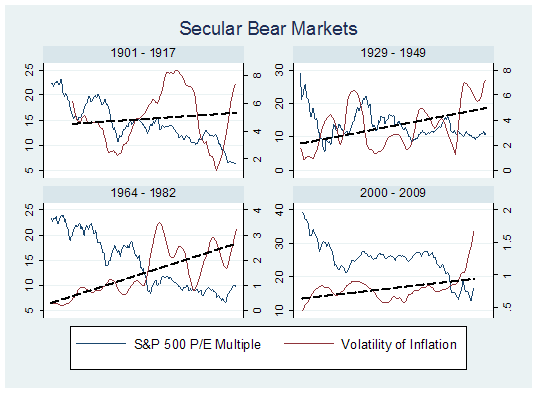
The graphs show that secular bull markets are fueled by economic volatility that trends persistently lower. While there are shorter term gyrations in the volatility of inflation during these periods, in all three, the longer-term trend was lower. The uncertainty faced by investors declined noticeably during each secular bull market, and the end of each bull market usually coincided with a few years of very low economic volatility which helped the markets move into steeply overvalued territory in each case. When that trend in economic volatility abruptly changed, the secular bull markets came to an end. You can see the aftermath in the next set of graphs, which show the same interaction of market valuation and the volatility of inflation, but in this case during the three secular bear markets of last century, and the secular bear market beginning in 2000.
The graphs show that secular bear markets have consistently coincided with rising levels of inflation volatility. In each case the level of economic volatility grinded higher throughout the secular bear market. Increasing economic volatility is what helps chaperone multiples from overvalued territory to deeply undervalued territory. It's the uncertainty of the stability in the growth rate of the economy and the uncertainty of the price trend that discourages investors. Piles of behavioral finance research show that investors overweight recent trends in their decisions. As uncertainty climbs, investors push multiples lower and lower assuming this uncertainty will be perpetual, eventually pricing stocks at generational lows. It's important to note that during the current secular bear market, the volatility of inflation has mostly been well contained. The cyclical bear market of 2000-2003 - although aggravated by the recession of 2001 - was mostly about valuation adjustment. Stocks moved from spectacular levels of overvaluation to moderate overvaluation, and at the recent lows, to slight undervaluation. Valuations going forward may show their typical sensitivity to economic uncertainty, and for this reason, the change in the slope of the volatility of inflation over the last two years is troublesome. The level of inflation volatility is still low, relative to the peaks reached during prior secular bear markets. If the level of inflation volatility continues to increase, it will become more difficult to argue that the secular bear market has come to an end. The graphs above show that the secular bear markets of last century shared three characteristics. They each lasted for more than 15 years, they each ended at extremely attractive levels of valuation (generally about 7-9 times trailing 10-year earnings), and , and they each endured many years of growing volatility in output and inflation, which eventually created the mindset for investors to price stocks at attractive levels of valuation. The current secular bear market can claim none of these characteristics yet. Any increase in economic volatility during Great Unwinding of the next few years will be crucial in determining the outcome for stocks. --- The foregoing comments represent the general investment analysis and economic views of the Advisor, and are provided solely for the purpose of information, instruction and discourse. Prospectuses for the Hussman Strategic Growth Fund, the Hussman Strategic Total Return Fund, the Hussman Strategic International Fund, and the Hussman Strategic Dividend Value Fund, as well as Fund reports and other information, are available by clicking "The Funds" menu button from any page of this website. |
|||||||||||||||||||||||||
|
For more information about investing in the Hussman Funds, please call us at
1-800-HUSSMAN (1-800-487-7626) 513-326-3551 outside the United States Site and site contents © copyright Hussman Funds. Brief quotations including attribution and a direct link to this site (www.hussmanfunds.com) are authorized. All other rights reserved and actively enforced. Extensive or unattributed reproduction of text or research findings are violations of copyright law. Site design by 1WebsiteDesigners. |