|
|
||||||
|
|

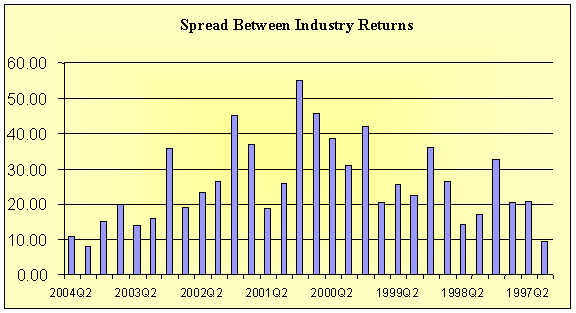
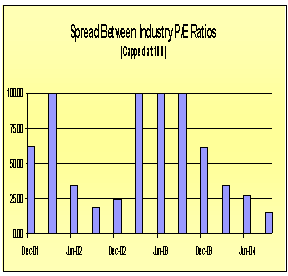
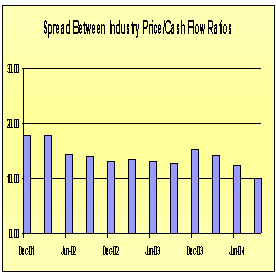
A Stock Market Without a View The spread between industry returns hits a multi-year low It is said that differences of opinion make markets. Well, they do most of the time. But this year the market seems to have very little opinion at all. Or, maybe it's better said that its opinions lack any conviction. Trading volume is one sign of the market's recent apathy. There have been only three days in August where the number of shares traded was greater than the 12-month average. Blame the beach. A more telling sign of the lack of investor conviction is the activity in sectors and industries. Where there is usually a wide divergence in the performance of industries, now there is very little. Standard & Poor's divvies up its indices four ways: by economic sectors, industry groups, industries, and sub-industries. At each level the indices become more specialized. There are 10 economic sectors. These are benchmarks that track broad groups such as health care, financials, and utilities. At the next level these sectors are segmented, leaving two dozen industry groups. Health Care, for example, is broken up into the Health-Care Equipment and Services Index and the Pharmaceuticals & Biotechnology Index. These group indices break down further into 62 industries and 132 sub-industries. By the time you get to the sub-industry level you can track an index of companies that have a catalog business on the internet. Though at that point it might be faster to look up the price of EBay, the only stock in that index. But to assess the broad outlook for industries, you needn't look any further than the 10 economic sectors. There's usually enough dispersion in these indices to tell a story. As The Great Bull Market wound down, the spread between the returns of the best and worst industries widened dramatically. In the fourth quarter of 1999, technology shares rallied 36 percent while utilities fell 6 percent, leaving a spread of 42 percentage points. In the last quarter of 2000, basic material stocks rose 22 percent while tech stocks slid 33 percent, parting ways by 55 percentage points. At times these spreads were created by an optimistic view of a particular industry, like the 1999 rally in tech stocks. At other times a negative view fueled the difference. Financial stocks fell 22 percent in the third quarter of 1998 as investors scrambled to figure out who was on the other side of Long-Term Capital Management's super-leveraged derivative trades. Sometimes investors were just looking for a place to hide. In the fourth quarter of 2000, as the market began to forecast the coming profits recession, consumer staple stocks - the shares of companies with stable revenues and earnings- rose 21 percent, the best performing group during that period. These performance spreads are driven by valuations, expectations, and often simply greed and fear being played out on an industry level. Which industry will gain the largest share of the economy? Which will lose the most? Which will perform best in the current economic environment? Without a ViewThat's why it's interesting to find the market currently without a view. In the first quarter of this year, consumer staple stocks, the best performing group, gained 5.6 percent while technology stocks shed 2.5 percent, leaving a spread of about 8 percent. This is the tightest spread between sector returns since at least 1997. During the second quarter, just 11 percentage points stood between industrial companies (up 8.5 percent) and financials (down 2.4 percent). There's not much dispersion in valuations either. The spread between highest and lowest industry P/E ratios has narrowed this year, too. Fifteen points of P/E separate energy stocks and technology stocks, the narrowest spread between low and high P/E groups in at least three years. Price to cash flow ratios show the same pattern.
There are at least three reasons for this lack of conviction. First, even though most analysts agree that the growth rate of the economy is slowing, they differ by how much it will slow. At the beginning of August, economists lowered their expectations for third-quarter growth from 4.2 percent to 3.9 percent, says Bloomberg News. But the most pessimistic forecast dropped by a full percentage point, from three percent to two percent. As a sign of how quickly the economy's prospects are changing (mainly as a result of the spike in oil prices) economists at Lehman Brothers lowered their growth expectations twice in the last three weeks. These foggy forecasts cause investors to be unsure of whether to over-weight companies that are sensitive to the economy, or those that are mainly immune to its moves. This can be seen in the performance of indexes that track economically sensitive stocks and those that have stable earnings. The ratio between Morgan Stanley's Cyclical index and its Consumer index has nearly flat-lined in the last few weeks and has been exhibiting a third of the volatility this year as in years past. Once investors firm up their forecast for the economy, you'll likely see the performance spread between these two groups widen. A potentially tight presidential race is another reason why investors aren't over-weighting sector allocations. The policies of each party could affect different industries in different ways. A good example is the performance of health care stocks at the beginning of Bill Clinton's first term. After enjoying a period of very strong performance, the shares of health care companies fell by more than 40 percent in value from the beginning of 1992 through the summer of 1993 (while the market was flat) as investors feared lower health care profits from proposals of broad nationalization and increased regulation. It's an impossible feat to calculate which party is "priced into the market" to win the November election, or how shares would react in the case of an upset to that view. But the outcome will matter at the industry level, so investors wait. The last reason - more secular than cyclical - is the lack of the next great industry waiting on the horizon. In the late 1980's and early 1990's, software and computer networking led the way. In the late 1990's, telecommunication equipment and internet infrastructure assumed the lead. These trends created huge spreads between the prospects for these fast growing industries compared to those deemed to be maturing. Without any obvious new industry leaders emerging, investors are less willing to alter their index weightings. There are early signs that more conviction is surfacing. So far this quarter, the S&P 500 energy index has climbed 9 percent, while technology stocks have fallen nearly 13 percent, creating a 22 percent spread between the performances of the two. Not quite the conviction of the late 90's, but it's a start.--- The foregoing comments represent the general investment analysis and economic views of the Advisor, and are provided solely for the purpose of information, instruction and discourse. Prospectuses for the Hussman Strategic Growth Fund, the Hussman Strategic Total Return Fund, the Hussman Strategic International Fund, and the Hussman Strategic Dividend Value Fund, as well as Fund reports and other information, are available by clicking "The Funds" menu button from any page of this website. |
|||||||||||||||||||||||||
|
For more information about investing in the Hussman Funds, please call us at
1-800-HUSSMAN (1-800-487-7626) 513-326-3551 outside the United States Site and site contents © copyright Hussman Funds. Brief quotations including attribution and a direct link to this site (www.hussmanfunds.com) are authorized. All other rights reserved and actively enforced. Extensive or unattributed reproduction of text or research findings are violations of copyright law. Site design by 1WebsiteDesigners. |