|
|
||||||
|
|

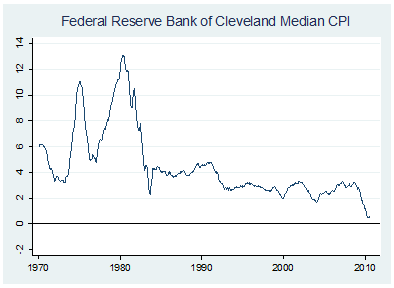
The Paradox of the Zero Bound Bill Hester, CFA August 2010 All rights reserved and actively enforced. Reprint Policy One group of investors was likely to give up its view. The divergence in the performance of stocks and bonds was clearly at odds during July and the beginning of August. In July, stocks had their best month in a year, while at the same time bond investors were piling into Treasuries sending their yields to near-historic lows. Last week, stock investors finally blinked and began to appreciate the concerns of bond investors, including weak trends in the leading indicators, in the jobs data, in components of the GDP data, and in the slowing rate of inflation among various price indexes. Inflation, or the lack of it, is one of the trends market participants are focused on. On Friday the BLS reported that overall inflation rose last month, the first increase in four months. On a year-over-year basis, the rate of inflation slowed its decent. But from the end of last year, inflation has still cooled to 1.2 percent from 2.7 percent. Another indicator of inflation is graphed below. It's the Federal Reserve Bank of Cleveland's tally of how quickly prices are rising. It improves on the BLS's Consumer Price Index - which can be noisy because of volatile components like food and energy - and the Core Consumer Price Index - which can be bullied around by a few of the components with large weightings, especially its imputed rent component. The researchers simply take the median price change of the components within the CPI Index. Not only is it less susceptible to outlier price changes, it's also done a better job at forecasting future inflation than have the two CPI indexes, according to the Fed's research. As the chart shows, the trend has been mostly down, and it's moved in that direction with a surprising amount of speed and consistency. This measure stabilized slightly in July, rising .1 percent.
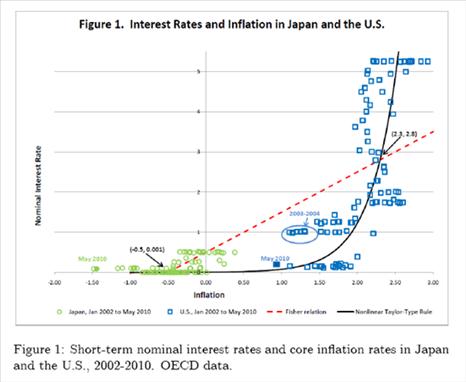
With fears of deflation spreading among market participants, it was an auspicious time for a member of the FOMC committee to deliver a paper arguing that the Federal Reserve's current policy was likely to increase the probability of deflation. This was the paper put out earlier this month by James Bullard, the President of the Federal Reserve Bank of St Louis. Much of the focus has been Bullard's comment that the US is closer to a Japanese-style outcome today than at any time in recent history. It's also been highlighted that his preference is for the Fed to buy longer-dated Treasury securities, restarting the type of quantitative easing that it pursued last year. Another part of Bullard's research paper ( Seven Faces of "The Peril") that received less attention but was equally interesting was his argument that the Fed's repeated expectation for "rates to stay low for an extended period of time" might actually be increasing the risk of deflation, the very outcome Bernanke is desperately trying to avoid. Bullard, a voting member of the FOMC, has said that he preferred to jumpstart a dialogue on this topic through the paper, rather than dissent through his vote. It is ironic though that a member of the Fed such as Bullard - one who recently described himself as "the north pole of inflation hawks" - would suggest that the Fed itself could end up being one of the culprits that helped launch a period of sustained deflation. While "The Peril" focuses mostly on the economy and the risks of deflation, there are also important insights for investors to take away from the discussion. Why does monetary policy become ineffective during periods of deflation? What are the risks to stock investors when the central bank can't adjust rates to incoming economic data? Are the signals from interest rates the same within periods of deflation as they are during periods of low inflation? Bullard's paper mostly outlines and then expands on a discussion that began in a research paper entitled "The Perils of Taylor Rules", written by Jess Benhabib, Stephanie Schmitt-Grohe, and Martin Uribe. The Taylor Rule has now gained fairly wide acceptance among economists, and was even acknowledged by Bernanke a few years ago. He said that "feed-back models" like the Taylor rule are helpful in setting policy rates. (Although, its message went unheeded from 2002-2004 when the Taylor Rule was suggesting higher rates as the economy was recovering and the seeds for the housing and credit bubbles were being planted.) The Taylor rule suggests a level of short term rates by taking into account inflation and GDP, relative to target levels. In the case of inflation, the Taylor Rule would suggest that policymakers should adjust nominal interest rates more than one-for-one when inflation deviates from a given target. (For an earlier discussion of this topic see: "Taylor" Your Fed Expectations .) In his paper, Bullard created the chart below to assist in his discussion of the risks that policymakers face when short rates fall toward zero. The green circles plot short-term rates against the rate of inflation in Japan over the last eight years. The blue squares represent the data in the US. They are clearly separate. Green circles on the left, blue squares on the right. The black line estimates the Taylor-suggested rate. The red dotted line is the level of interest rate suggested by the Fisher Equation, which suggests that interest rates consist of a real component and an expected inflation component. The real component in this example is fixed at 50 basis points.
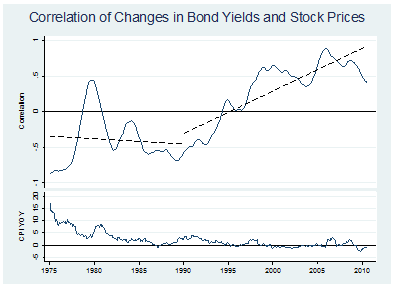
The two parts of the graph that are noteworthy are where the solid black line intersects with the red dotted line. The point where they intersect among the US data is an area where monetary policy can be reactive to data. Short-term rates can be shifted to lean against incoming data. Short-term rates can be pushed higher when inflation is above acceptable levels and lower when inflation slows. And where these lines intersect monetary policy should be just about right, suggests Bullard. The original researchers called this the "targeted" steady state. The intersection that occurs within the Japanese data suggests a more challenging situation for policymakers. Here their efforts become ineffective. This area of the graph is sometimes called the "unintended" steady state. As Bullard puts it, "in this unintended steady state, policy is no longer active: It has instead switched to being passive. When inflation decreases, the policy rate is not lowered more than one-for-one because of the zero lower bound. And when inflation increases, the policy rate is not increased more than one-for-one because inflation is well below its target." He concludes that in this state, "the private sector has come to expect the rate of deflation consistent with the Fisher relation accompanied by very little policy response, and so nothing changes with respect to nominal interest rates or inflation." In effect, Bullard is saying that a policy that makes a promise to investors that rates will stay low for long periods of time backfires. While the Fed may intend to fan inflation concerns in order to motivate aggregate demand, the private sector begins to assume a semi-permanent state of very little change in inflation, and a growing inability for the Federal Reserve to do anything about it. On Friday, Kansas City Fed President Thomas Hoenig expanded on the reasons why he has dissented from the current policy in place. "If an attempt to add further fuel to the recovery, a zero interest rate is continued, it is as likely to be a negative as a positive in that it brings its own unintended consequences and uncertainty", Hoenig said in a speech. "A zero rate after a year of recovery gives legitimacy to questions about the sustainability of the recovery." While Hoenig believes a deflationary outcome has low odds, his argument is the same. A Zero Bound strategy locks market participants into thinking inflation and growth are not likely near-term outcomes. Promising low rates for long periods of time is particularly pernicious following periods of credit crises, points our Arun Motianey, now with Roubini Global Economics, in his book SuperCycles. In a discussion of Japan's low policy rates over the last 15 years, Motianey points out that deflation became worse the longer Japan's equivalent Fed Funds rate stayed at zero. Motianey argues a slightly different transition mechanism that pushes the economy into deflation, mainly through lending markets. He argues that after a credit crisis, government-supported banks are borrowing at close to government rates and at the same time being coerced to lend at rates lower than they would otherwise demand for the risk of default. The result is that they demand higher credit standards (typically higher operating cash flow) of their borrowers. Borrowers, mostly companies, oblige by halting the growth in or cutting the nominal wages of workers. Generalized price deflation typically follows wage deflation. Motianey sums up his argument up this way, "Very low nominal rates cannot be used to fight deflation, since they are, in these conditions - the condition of banking system distress - the cause of deflation." He calls this the Paradox of the Zero Bound. This is an important topic because it's clear that investors still believe that the Fed is engaged in active monetary policy (whether that might be setting the Fed Funds Rate, quantitative easing, or adjusting the interest rate paid on reserves) and that active monetary policy will play an important role in the outcome of the recovery. And this faith in the Fed that investors have, although unquantifiable, has certainly played an important role in the performance of stock markets over the last few years. After more than a decade of Greenspan's Put, and Bernanke's do-what-ever-it-takes attitude in protecting investors from taking appropriate losses, investors have been conditioned to believe that the Fed has their back. This faith in the Fed also must be playing a role in the valuation of the stock market, considering that investors are pricing stocks nearly 40 percent above long-term valuation levels (using normalized earnings) during an economic recovery that is by almost any measure lagging far behind the typical post war recovery. That conditioned faith that investors have in the Fed is what makes Bullard's paper so interesting and timely. He is essentially suggesting that the Fed's promise to investors to keep rates low for a long period of time - something stock investors typically cheer over the near-term - will in the end increase the probability that the Fed at some point will find itself powerless to the expectations of the private sector and financial market participants. Investing within the Paradox Deflation and steep disinflation come in different forms. A lower price level that is brought about by a capital investment boom that improves productivity and efficiencies is generally considered good deflation. The build-out of the national railroad system in the US helped move goods around the country more efficiently, causing a drop in commodity prices, which helped create a period of wide-spread deflation during the second half of the 19 th century. Prices also fell in the 1950's, but the price declines were shallow and short lived, leaving the economy unaffected. A more damaging form of deflation comes about from a fall in aggregate demand, which pinches corporate profits, and then wages, which can create a feed-back loop, sending prices lower again. This was the deflation the US experienced during the 1930's. The modern-day example of this is the deflation that Japan has experienced since the mid 1990's. Because deflation's causes and effects differ, stock returns have also differed during periods of falling prices. Stock returns were positive but below average in the second half of the 19 th century during periods of deflation. The deflation of the 1930's coincided with losses on average for investors. Using Japan's experience with deflation, there are a couple of inter-market relationships that may change if the US economy were to fall into a period of sustained deflation. First, the signaling of interest rates would likely change. Typically, falling interest rates support stock prices. Falling rates typically highlight an easing of inflation concerns (especially if real yields remain unchanged), which can be supportive of stock prices. So, typically, bond yields and stock prices move in opposite direction (although this inverse correlation can break down during periods of heightened risk aversion). As the graph below shows, this was the typical pattern between stock prices in Japan and government bond yields prior to the bursting of the country's stock and real estate bubbles. But as deflation took hold, the correlation of the two has increased. Essentially the typical relationship between changes in bond yields and stock prices has reversed. In periods where the economy gets stuck in the "unintended" state, long rates become the primary signal for the expectations of growth and inflation. Lower rates imply an expectation of deflation and economic weakness, and become associated with weaker stock prices. For example, in Japan, prior to the onset of deflation when rates were falling (let's say, they were lower than 6 months earlier) the average annualized stock return was 23 percent (this period includes a stock-market bubble). When rates were rising, stocks fell on average 4 percent. But since 1995 during periods when rates were falling, stocks have fallen 12 percent on average. During periods of rising interest rates - that is, where investors were optimistic that both growth and inflation would materialize - stocks climbed 11 percent on average. When the economy falls into the Zero Bound area, investors become optimistic about the possibility that prices will rise because market participants have come to expect continued deflation.
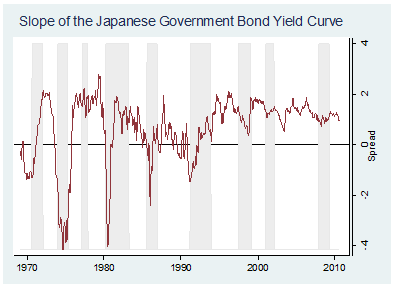
Another signaling mechanism that breaks down when policy rates are set low for an extended period of time is slope of the yield curve. Typically, investors will wait for the yield curve to become inverted - signaling an approaching recession - prior to becoming defensive in their stock portfolios. In the Zero Bound area, that signal might never come. I've noted that following the stock market crash of 1929, over the next twenty years, as short and long-term bond yields stayed at very low levels, the yield curve was unhelpful in forecasting recessions. Its record improved after the normalization of yields toward longer-term levels. The Japanese data show the same pattern. In the graph below I've plotted the spread between long-term bond yields and shorter-term bond yields in Japan. Prior to 1995 the yield curve had a strong record of forecasting recessions or that the economy had just entered into a recession. It missed signaling only a single a recession, the one beginning in 1976. Post 1995, when deflation began to look more persistent in Japan's price gauges, the yield curve's track record deteriorated. It hasn't forecasted any of the three recessions that have occurred since the mid 1990's.
The longer that Japan has kept its policy rate low, and continued to promise to keep rates low, the more persistent and intractable the pattern of deflation has become in Japan. In the US, the risk is not only the detrimental effect to the economy if we enter an "unintended" state, but also the effect that an erosion of the faith in the Fed would have in pricing stocks. The answer to Fed President Bullard's question to policymakers is as equally as important to Bernanke as it is to investors. Will the policy currently in place to protect the economy against slipping into deflation end up being the primary culprit for that same outcome? --- The foregoing comments represent the general investment analysis and economic views of the Advisor, and are provided solely for the purpose of information, instruction and discourse. Prospectuses for the Hussman Strategic Growth Fund, the Hussman Strategic Total Return Fund, the Hussman Strategic International Fund, and the Hussman Strategic Dividend Value Fund, as well as Fund reports and other information, are available by clicking "The Funds" menu button from any page of this website. |
|||||||||||||||||||||||||
|
For more information about investing in the Hussman Funds, please call us at
1-800-HUSSMAN (1-800-487-7626) 513-326-3551 outside the United States Site and site contents © copyright Hussman Funds. Brief quotations including attribution and a direct link to this site (www.hussmanfunds.com) are authorized. All other rights reserved and actively enforced. Extensive or unattributed reproduction of text or research findings are violations of copyright law. Site design by 1WebsiteDesigners. |