|
|
||||||
|
|

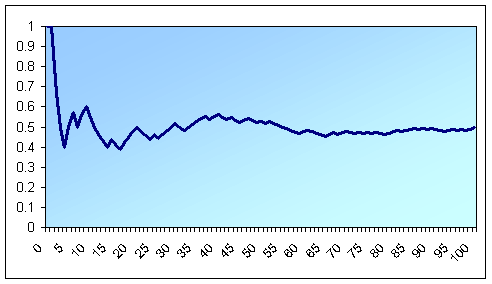
October 25, 2004 Law of Large Numbers If you want to understand the difference between good, disciplined investing and rank speculation (and also why I only play nickel slots in Vegas), start by understanding the law of large numbers. The law of large numbers basically says that if you make repeated, independent draws from a given "population," the average value of your sample will approach the true population average as the sample size becomes large. For example, imagine you have a hat with pieces of paper in it, 60% being dollar bills and 40% being blank. You take independent draws, replacing the paper into the hat each time so that the proportion of bills in the hat always remains the same. Sure, on your first 10 draws, you may very well draw 8 dollar bills and only 2 blanks. Or on a particularly unlucky streak, you might draw only 3 dollar bills and 7 blanks. But as the number of draws increases, the law of large numbers implies that your sample average will approach the population average of 60% bills and 40% blanks. You can illustrate the law of large numbers by flipping a coin 100 times. A sample is pictured below (thanks to my daughter for her cheerful research assistance). Notice that the average is very erratic when the sample size is small, but that the average number of heads becomes well-behaved and converges toward 50% as the sample size increases.
For geeks, there's more. If a bunch of people were to do the same experiment, we could collect each of their sample averages, and we would find that those individual sample averages would bunch around 50% in the pattern of a bell shaped curve (this is known as the "central limit theorem," which says that a sum of n random variables tends toward the normal distribution as n grows large, regardless of the distribution which describes the variable itself). So if we try the experiment and our proportion of heads isn't near 50%, we can conclude that it's a statistical outlier, and we can actually calculate the frequency that we'd observe that result. Discipline and patience have no substitutes The law of large numbers has everything to do with good investing. It tells us that as long as the markets have uncertainty, then regardless of our investment approach, small samples are not likely to be very representative of "truth." The shorter the investment horizon, the less likely it is for our experience over that period to reflect the "typical return" for that approach. For example, a typical market cycle has historically involved about 3.25 years of positive returns averaging close to 28% annually, and about 1.25 years of negative returns, on average, averaging about -24% annually, producing an overall full-cycle return averaging about 10.7% compounded annually. Unfortunately, neither bull markets, bear markets, nor full cycles have been smooth enough to rely on these averages except over repeated, long-term experience. Investors intent on following a buy-and-hold approach clearly have to trust the law of large numbers - their experience over short periods is unlikely to bear any resemblance to "truth." In general, short-term returns have very little information content. Think of "normal" returns from an investment approach as falling around their long-term average in something resembling a bell-shaped curve (clearly, that bell is very wide for a buy-and-hold strategy). Because returns are distributed widely around the average, and not tightly around it, it is impossible to confidently expect any particular short-term return to resemble the average. That said, the law of large numbers suggests that short-term returns should eventually begin to average out toward the long-term average if all is well. An investment approach that produces very large, repeated, and out-of-context deviations from expected behavior always deserves scrutiny. Notice that the law of large numbers requires the samples to be "independent." Following a particular investment approach over numerous time periods would qualify those samples as being reasonably independent, for example. In contrast, holding 100 stocks in a portfolio is not sufficient to ensure independence, because all of those stocks will be affected in common by whatever short-term market conditions emerge. For that reason, investors cannot expect short-term returns in even the most diversified portfolio to be particularly reflective of long-term market returns, or even the "average" returns of whatever stock selection approach they are following. Forecasting short-term returns is impossible In my view, a buy-and-hold strategy on the market isn't optimal, because I believe that the risk/return profile of the market varies, depending on conditions such as valuations and market action. Historically, markets having favorable valuation and favorable market action have enjoyed high average returns, with relatively low variation around that average (resulting in a very strong return/risk tradeoff). Markets having unfavorable valuation and unfavorable market action, have historically suffered low or negative average returns, but with wide variation around that average (resulting in a very poor return/risk tradeoff, though it also means that even a negative Market Climate can include some very strong periods). Despite the difference in the average return/risk profile of various Market Climates, I strongly believe that forecasting individual movements in the financial markets is impossible. Regardless of market conditions, each Market Climate includes both positive and negative returns, which means that even after we identify which Climate we're in, we don't have any ability to predict whether the next move will be up or down. For us, the law of large numbers also means that we can't expect the market's behavior in a particular Climate to resemble the "average" behavior in that Climate unless our sample size is large . In other words, the market's behavior over a period of say, 3-6 months, may have very little relationship with what we would consider "normal" returns for a particular Climate. It's only by following an investment approach in a disciplined way, across numerous short-terms, that an investor can expect returns to converge toward the long-term average for that approach. As I frequently note in our annual reports, I encourage investors to measure performance (both for the Hussman Funds and for other investments) over periods that are reasonably representative of the normal "long-term" market behavior. These periods might include, for example, a complete bull-bear market cycle, a segment of at least two years over which the S&P 500 has produced an average return of about 10%, or performance between two distinct peaks in the S&P 500 separated by at least two years and preferably longer. It's perfectly reasonable for investors to hold an investment manager accountable for performance over such representative periods. In contrast, I vigorously discourage investors with short horizons from investing in the Hussman Funds (or any equity fund for that matter), because the law of large numbers does not apply very well over short periods. Too much bullishness Turning to current conditions, last week, according to Investors Intelligence, the percentage of bullish investment advisors surged to 58.9% while bears declined to a very low 22.1% (19% are in the "correction" camp). Now, it's important to interpret advisory sentiment correctly. If you study this indicator closely, you'll find that the percentage of bullish investment advisors can be largely explained simply by past market performance over a variety of horizons. In general, strong markets have more bulls. Not surprising. Since we also know that there is no large or simple correlation between market movements in the recent past and market movements in the near future, it follows that the part of advisory sentiment explained by past movements is just plain uninformative as well. So before looking at advisory sentiment, we have to factor out the portion that is explained simply by past market movements. Once we've done this, we are left with a much more informative indicator. And that's a problem here. While 58.9% bulls is certainly not a figure that would be surprising if the market was enjoying substantial strength, it is completely out of line with the flatness of market action in recent months. On my own measures, I calculate that bullishness is currently about 17% higher than can be explained by past market performance. Here's the implication. Historically, when that "excess bullishness" has been greater than 15%, the S&P 500 has produced an average annualized return of just 4.51% (specifically, that's a quarterly return annualized. In nearly all cases, valuations were substantially better than they are today). When excess bullishness was between -15% and +15%, the S&P 500 produced an average annualized return of 11.53%. Finally, when excess bullishness was -15% or less, meaning that there were far too few bulls after correcting for past market performance, the S&P 500 produced an average annualized return of 22.99%. Properly interpreted, sentiment does matter, and there are too many bulls here. That said, the statistics above are averages, and they aren't reliable enough to form the basis of specific forecasts. With the Market Climate still modestly constructive (more below), sentiment is simply a factor that helps to determine the particular hedging strategies we use in order to align ourselves with that Market Climate. Excessive bullishness here is not sufficient to warrant an overly defensive investment position or an outright forecast of market weakness. Market Climate As of last week, the Market Climate for stocks remained characterized by unusually unfavorable valuations and still modestly favorable market action. Several features of the current market environment are notable. Among the most important is valuation. The price/peak earnings multiple for the S&P 500 is about 20, compared with a historical norm of about 14, while the price/revenue multiple is about 1.5 and nearly twice its historical norm. I realize that some analysts are crowing about the "enormous free cash flow" coming out of S&P 500 companies, but those statements are poorly informed. Capital investment over the past 8 quarters barely matches depreciation, so there is zero net investment going on. Of course free cash flow numbers are going to be larger in that event, but it's ridiculous to assume that these companies will grow with zero net investment. So either the capital expenditure figure should be normalized higher, resulting in smaller valuation numbers on the basis of free cash flow, or the growth rates should be reduced, resulting in smaller valuation numbers on the basis of free cash flow. Gee, does it matter? Still, overvaluation simply implies unsatisfactory long-term returns. It certainly doesn't necessarily inhibit short-term progress for the market provided investors are sufficiently willing to speculate (a willingness that we read out of the quality of market action). It is important to note that market action remains modestly favorable, so we continue to carry a modest positive exposure to market fluctuations. Let me repeat that. We're still constructively positioned. At present, we've got a net positive exposure (largely through one-sided hedging rather than matched put/call combinations) of about 15% of portfolio value in the Strategic Growth Fund, with a sufficient number of call options to establish as much as 65% exposure to market fluctuations in the event of a substantial near-term advance. That's certainly not a forecast of an advancing market here, but I don't rule it out, and neither should you. Bottom line - we've got poor valuations, insider selling picking up, excess bullishness from advisors (a contrary indicator) and a CBOE volatility index still reflecting unusual complacency (another factor in the decision to use directional hedges, since time premium is very cheap here), but still modestly favorable market action on our measures overall. This is an environment in which we want to defend against any sort of persistent decline that might occur, but in which we are still unwilling to completely hedge all market exposure away. Again, overall we remain modestly constructive in stocks - fully invested in a wide range of stocks, largely protected on the downside with put options, but only partially hedged with short call options so we retain our upside sensitivity to market movements, at fairly modest cost in terms of potential time decay. In bonds, the Market Climate remains characterized by modestly unfavorable valuations and tenuously favorable market action. The Strategic Total Return Fund continues to carry an overall duration of just under 2 years (meaning that a 100 basis point move in interest rates would be expected to impact the Fund by about 2% on account of bond price fluctuations). We also continue to carry about 14% of assets in precious metals shares. On a pure currency valuation basis using price/interest rate parities (see Valuing Foreign Currencies), I don't actually view the dollar as overvalued relative to most major currencies such as the euro, pound or Canadian dollar. The clear overvaluations are limited to the yen and of course the Chinese yuan. Still, at present, parity valuations aren't the only consideration. In order to even begin to adjust the current account deficit, the dollar will inevitably come under substantial pressure, and the dollar could easily push 15-20% through parity values regardless of the currency of reference. Suffice it to say, again, that aside from the yen and yuan, I don't view the dollar as materially overvalued on the basis of price/interest rate parities, but I'm as concerned as ever about a dollar crisis in the coming quarters. New from Bill Hester: The Declining Quality of Earnings--- The foregoing comments represent the general investment analysis and economic views of the Advisor, and are provided solely for the purpose of information, instruction and discourse. Prospectuses for the Hussman Strategic Growth Fund, the Hussman Strategic Total Return Fund, the Hussman Strategic International Fund, and the Hussman Strategic Dividend Value Fund, as well as Fund reports and other information, are available by clicking "The Funds" menu button from any page of this website. |
|||||||||||||||||||||||||
|
For more information about investing in the Hussman Funds, please call us at
1-800-HUSSMAN (1-800-487-7626) 513-326-3551 outside the United States Site and site contents © copyright Hussman Funds. Brief quotations including attribution and a direct link to this site (www.hussmanfunds.com) are authorized. All other rights reserved and actively enforced. Extensive or unattributed reproduction of text or research findings are violations of copyright law. Site design by 1WebsiteDesigners. |