|
|
||||||
|
|

December 26, 2006 Lopsided Sentiment and Unfounded Optimism Warren Buffett once said "we simply attempt to be fearful when others are greedy, and greedy when others are fearful." To put it another way, the best time to panic is before everyone else does. Given the favorable quality of market action, it may or may not be time to panic yet, but we do know that even while market action is generally favorable, we have overvalued, overbought, and overbullish conditions that have generally been associated both with poor short-term returns (as a result of the overbought, overbullish features), and disappointing long-term returns (as a result of overvaluation). That said, once the market minimally clears this overbought condition, intermediate-term returns could still be favorable for a while longer. In the Strategic Growth Fund, that puts us in the position of being fully hedged, but with a small speculative call option position that I would expect to increase toward 2% of assets if the market pulls back somewhat further without a significant deterioration in market internals. Presently, the Fund holds enough call options to mute about 50% of our hedges in the effect of a strong advance, though our local "delta" (our sensitivity to local fluctuations in the market) remains under 20% here. As a rough guide, if the stock market can sustain a pullback of say 3-4% without a notable reversal in the breadth of individual stocks, industry groups, and security types, I would expect to establish a more significant speculative exposure - again, through a couple of percent in call options, rather than actually removing downside protection. Longer-term, the market's rich valuations on a variety of internals is already enough to anticipate fairly unsatisfactory returns for buy-and-hold investors in the major indices over the coming 5-7 years. It's extremely important that in thinking about the full market cycle, investors keep the effects of compounding in mind. For example, suppose you earn 20%, 20%, 20% three years in a row, and then have one losing year of -20%. Suddenly, the compound annual return for the four-year period drops to just 8.43%. Of course, the market's performance over the past several years has already been fairly restrained, even counting the strong returns of 2003. Indeed, if the S&P 500 was to experience a one-year decline of 20%, minimally qualifying as a bear market, the resulting 5-year total return since December 2002 (close to the trough of that bear market) would be just 7% annually. Even if next year turns out to deliver a further bull market gain of 20%, followed only then by a minimal 20% bear market decline, the return since late-2002 would still be limited to 9% annually. This just isn't a market that's likely to deliver double-digit returns over the full cycle. The market's relatively high starting valuations virtually assured that from the outset. Unless investors believe that bear markets are a thing of the past, it's not sensible to worry about missed long-term returns in a mature, richly valued market. We're willing to accept a moderate amount of speculative call option exposure, but we're not about to lift our defenses outright under present conditions. Keep in mind that the typical bear market loss averages about 30%, but even moderate losses can do a lot of damage to long-term compound returns. Overbullish Returning to the current overbought, overbullish condition of the market, the Russell Investment Group just published their quarterly money managers poll, which shows a fairly stunning 86% of advisors bullish for the coming year. About 13% expect a flat market or a decline of less than 10%, and just 1% expect a decline of 10% or more. That's amazing given that this is already the second-longest span on record for which the market has not experienced even a 10% correction. In the latest poll of 80 analysts by Business Week, 89% of the analysts are bullish (18% of which expect positive returns but below the prevailing T-bill yield). 8% are slightly bearish - expecting a decline of less than 10%, and just 3 of the analysts expect a decline of 10% or greater. Evidently, there's not a lot of "buying power" available from converting that tiny pool of remaining bears, but there's a lot of room available in the bearish column in order to populate a more typical divergence of opinion. The last time we saw this much bullishness was at the start of 2001, which preceded an awful 2-year period for stocks. Meanwhile, the "smart money" shows a distinctly different pattern. The latest figures from Vickers show heavy insider selling at 8.4 shares sold for every 1 share purchased. The 8-week average is running at a ratio of 6.9 to 1. As Paul Macrae Montgomery asks, " We keep reading about how the share buy-backs, cash takeovers, and leveraged buyouts are proof positive that stock prices are a great 'value'. Well if stock prices are such great values, why is it that all this buying is being down with 'other peoples money,' and why are the savvy insiders simultaneously selling their own stock?" Still, it's important to evaluate the bullish arguments carefully. Numerous weekly comments have already detailed the weak evidence for the most popular bullish argument - the Fed Model (aka "capitalized earnings model," aka "stocks are still cheap relative to bonds", aka "multiples are attractive on a price-to-forward earnings basis"). Here are a few additional bullish cases, along with my impressions. Permanently high profit margins? GaveKal Research recently published a piece that was highly critical of the idea that profit margins revert to the mean over time. Though their bit wasn't directed at me personally, my eyebrows did pop up at their remark that the profit margin argument "annoys us to no end, for it smacks of either lazy thinking and lack of work, or worse, downright intellectual dishonesty." They continue, "Indeed, take a look at the graph below."
"Now, looking at this chart, can our reader identify any "mean-reverting" tendency? Neither can we." Well guys, take a look at the graph below (which looks pretty much the same as the one above):
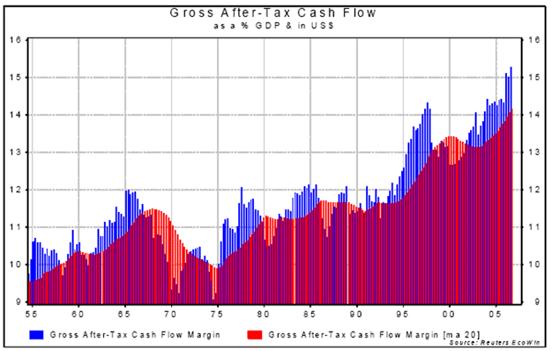
Now, looking at this chart, can our reader identify any "mean-reverting" tendency? Neither can we. Problem is, this graph is the S&P 500 price/peak earnings ratio from 1950 to 2000. Had you looked at that graph, the relentless uptrend of the prior decade might have convinced a casual observer that valuations don't revert to the mean over time, but instead can simply drift higher indefinitely. Yet notice that prior to the late-90's blowoff, valuations were well-contained below 20 times peak earnings. Neither high valuations nor low valuations were permanent. The same has been true throughout market history. Clearly, adding a small out-of-range segment to a normally mean-reverting chart can make it look (at least temporarily) as if the mean reversion doesn't exist. Oh, and in the two years following the end of this particular chart, the price/peak earnings multiple on the S&P 500 fell in half. Now go back to the first chart, which presents gross after-tax cash flows as a percentage of GDP. You can see the same pattern. Note that until about 1995, this chart also had a clear mean-reverting tendency. Cash flows as a share of GDP were actually very well contained by an upper bound of 12%. Over the past decade, however, the cash flow share has broken free of its prior 12% upper bound, pushing to a record high over 15% presently. According to GaveKal, a major reason for the "sustained rise in US after-tax margins" is that corporate taxes have dropped sharply since the 1960's and 1970's. While their claim about taxes is correct - corporate taxes as a share of pre-tax income have dropped from nearly 50% during the 70's to about 33% today - virtually all of that decline in corporate tax burdens occurred prior to 1990. Indeed, the tax share of corporate income was about 35% in 1989, as well as 1995, and again, is about 33% today. So while taxes have come down since the 60's, the recent surge in margins can hardly be attributed to that cause. Nor can it be attributed to a reduction in interest burdens, which experienced the majority of their decline well before the recent surge in margins. Most importantly, GaveKal suggests, the rise in margins is owed to a purported shift to a "knowledge based economy," where evidently, we all just hang around and consume each others' knowledge. Let's see. I finished my Christmas shopping on Friday. I got in my car, which had a full tank of gas, and having filled my tires earlier in the week at a gas station (where I bought some gum), I drove to the mall, bought some toys, clothes, music, and other gifts, had a cup of coffee, stopped at the food court for a bite to eat, then drove home, checked my answering machine, which had a message from the dentist about a checkup, which reminded me I should probably schedule a haircut in a week or two. At that point, I made some tea, took a vitamin, sat down at my desk, and turned on my computer to write this piece. While it's true that there's a good amount of knowledge and information embodied in various products, the fact is that most of the people and businesses I've come into contact with have been in the business of producing tangible goods or functional services. And of course that's what most people in the U.S. create for a living. They produce stuff or they do stuff. Sure, there are certainly great benefits from knowledge-based technologies, but as information economists have long noted, as soon as information is produced, one person can consume it without reducing others' consumption of it. The marginal cost of extra copies is zero, and market prices tend to move toward marginal cost. So it's possible to earn a profit on information for a while, but in a competitive economy, it's extraordinarily difficult to retain those profits. Instead, you move toward a "free disposal" equilibrium where people use and enjoy the information but there are no excess profits available from that use. Companies can use computers and the internet, but they still have to compete with other companies that do the same thing. Broadly speaking, the notion that some grand shift to a knowledge-based economy will afford everyone with permanently higher profit margins just strikes me as an unfounded platitude. So why have profit margins expanded in recent years? Very simply, because labor compensation - which is also mean-reverting - has stagnated (though that's started to change in recent months, both in the U.S. and internationally, thanks to relatively low unemployment). To see how closely profits and labor compensation are related, I've reprinted a chart that appeared in these comments a few months ago. The blue line (right scale) depicts U.S. corporate profits as a percentage of nominal GDP. The violet line (left scale, smoothed) depicts U.S. personal disposable income as a percentage of nominal GDP, using an inverted scale - a rising line means a falling disposable income share. Notice that increasing corporate profits as a share of GDP generally come at the expense of wage earners' share, and vice versa. The surge in corporate profits since 2003 reflects a corresponding drop in personal income as a share of GDP (a rising violet line) from 75% to 72% of GDP.
In short, the recent rise in profit margins is not the permanent dynamic of some brave new world, but rather a quite cyclical dynamic pushed to a temporary extreme. Moreover, our views about the cyclical nature of profit margins are based on the very dynamics of capitalism. When we say "margins will return to the mean," what we are saying is the same thing that economist Joseph Schumpeter said half a century ago: the emergence and elimination of excess profits through the competitive mechanism is not simply a passing phenomenon, but is the essential fact that drives the economy forward. If high profit margins are permanent, then the free enterprise system is a failure. (Note to the guys at GaveKal - I don't intend this piece as an offense. You write some good, thought-provoking stuff. It's just when you diminish concerns about profit margins by lobbing out phrases like "lazy thinking, lack of work, or worse, downright intellectual dishonesty," well Tucky, them's fightin' words in these here parts.) No place for unfounded optimism While we've got a chart of the price/peak earnings chart handy, it's a good opportunity to comment on a piece by Milton Ezrati ("No Place for Pessimism") that ran in Barron's a week ago. That piece asserted "If the S&P 500 index was to move sideways for the rest of the decade... such index behavior would give investors a real loss (after inflation) of between 2.5% and 3% a year, on average, for the decade as a whole." Noting that this would be a pretty awful inflation-adjusted return from a historical standpoint, Ezrati simply dismisses it as implausible: "Such an expectation is far from reasonable, not the least because today's fundamentals are far superior." That argument, however, completely ignores the impact of valuation, which has historically been the overwhelming determinant of long-term returns. Even at the 1929 peak, the price/peak earnings ratio on the S&P 500 index was just over 20. In contrast, the P/E hit nearly 34 as the market approached its peak in 2000. That created a big problem for prospective long-term returns. During the decade following the 1929 market peak, the S&P 500 registered a total return of -4.5% annually. Evidently, Ezrati believes that without awful economic conditions, such a return for the current 10-year period is out of the question. Let's calculate what drove returns during the Depression. During that decade from 1929-1939, S&P 500 earnings fell about -6.1% annually, so peak -earnings didn't change from the high registered in 1929. Meanwhile, the S&P 500 price/peak earnings multiple declined from 20 to 7, and the dividend yield on the S&P 500 averaged 5.5%. So do the math. The total return (capital gain plus income) was: [(7/20)^(1/10) + .055 - 1] = -4.5%, simple algebra. Given the far higher price-peak earnings multiple of 34 that we observed near the 2000 peak, we can enjoy quite good earnings growth but still get a decade of similarly unsatisfactory market returns. For example, let's assume that earnings over the decade from the 2000 peak to 2010 will continue to grow along the top of their historical 6% peak-to-peak trend. Assume also that by 2010, the price/peak earnings multiple simply touches its historical average of 14 (forget that the typical multiple has been less than 10 when earnings have been at the top of that peak-to-peak growth channel - let's just assume the multiple touches 14). Given those assumptions, and a starting dividend yield of 1.3%, the resulting annual return over this decade will work out to: [(1.06)(14/34)^.1 + .013(34/14+1)/2 - 1] = -0.77%. Now, because the U.S. experienced deflation during the Depression, Ezrati notes that the S&P 500 earned a real return of about 1% during the decade starting from the 1929 peak. He notes that real returns were even worse in the 1970's, due to a combination of tepid market returns and skyrocketing price inflation. Given any positive inflation at all during the next few years, the real return on the S&P 500 in this decade through 2010 will probably be worse than the post-depression period, and about as bad as the 1970's. Ezrati rules this out, not on the basis of any sort of calculation, but simply because it doesn't seem "reasonable" (and certainly not fair) that the market should perform worse in a good economy than in a bad one. Unfortunately, rich valuations are unforgiving, as is simple algebra. That's something to remember given current the market's current multiples to earnings, revenues, book values, and other fundamentals. To wit, suppose that despite elevated profit margins, earnings continue to grow along the peak of their long-term 6% growth channel over the coming 5 years, and the market's P/E multiple simply touches 14, even briefly. Given the current multiple of 18 and a starting dividend yield of 1.8, we get an implied 5-year total return of: [(1.06)(14/18)^(1/5) + .018(18/14+1)/2 - 1] = 2.86%. We can avoid tepid long-term returns from these levels only if we assume that both profit margins and valuation multiples remain elevated indefinitely - not just for a year or two, but for the foreseeable future. As usual, I'm not asserting that any of this necessarily implies poor short-term returns. But don't forget - rich valuations, ultimately, are unforgiving. Market Climate As of last week, the Market Climate for stocks remained characterized by unfavorable valuations, generally favorable market action, and overbought, overbullish conditions that in overvalued markets have typically been associated with returns below T-bill yields. As noted above, if we can clear that overbought condition without a measurable deterioration in market internals, we remain willing to accept a moderate speculative exposure to market fluctuations (in practice, roughly 2% of assets in call options). So we're willing to accept some amount of speculative exposure, provided we get market conditions that have historically been associated with reasonable return/risk characteristics. But prevailing valuations provide very little investment merit for stocks. As was true in the late 1990's, when investors evaluate recent market behavior, it's extremely important to get the story right. Stocks have done well and are at rich valuations not because they are appropriately priced, not because they deserve these valuations, but rather because investors have been in a speculative mood. Investors need to get that story right because once the speculative merit goes away, it will be essential to recognize that nothing else can be expected to "save" the market from the consequences of these rich valuations. In bonds, the Market Climate remains characterized by unfavorable valuations but moderately favorable market action. The Strategic Total Return Fund continues to trade around a duration of about 2 years, mostly in Treasury inflation protected securities, with about 20% of assets in precious metals shares. Wishing you a happy New Year! --- The foregoing comments represent the general investment analysis and economic views of the Advisor, and are provided solely for the purpose of information, instruction and discourse. Prospectuses for the Hussman Strategic Growth Fund, the Hussman Strategic Total Return Fund, the Hussman Strategic International Fund, and the Hussman Strategic Dividend Value Fund, as well as Fund reports and other information, are available by clicking "The Funds" menu button from any page of this website. |
|||||||||||||||||||||||||
|
For more information about investing in the Hussman Funds, please call us at
1-800-HUSSMAN (1-800-487-7626) 513-326-3551 outside the United States Site and site contents © copyright Hussman Funds. Brief quotations including attribution and a direct link to this site (www.hussmanfunds.com) are authorized. All other rights reserved and actively enforced. Extensive or unattributed reproduction of text or research findings are violations of copyright law. Site design by 1WebsiteDesigners. |