|
|
||||||
|
|

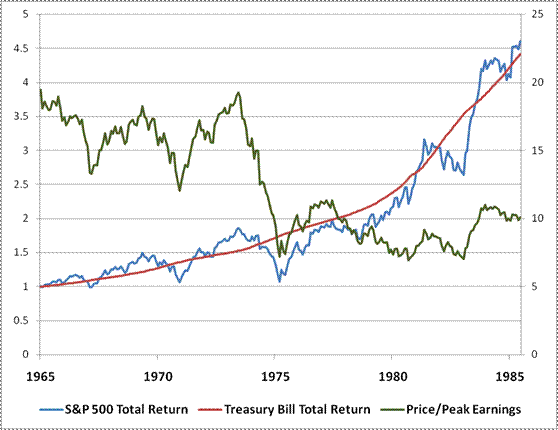
February 25, 2008 Secular Bears The total return of the S&P 500 is now a few weeks shy of having lagged riskless Treasury bills for a decade. Against this backdrop, I was asked by a journalist last week whether I believed that stocks were in a "secular bear market." Though I tend not to think in terms of "bull" or "bear" markets (being more concerned with conditions that can be identified using fully observable data rather than hindsight), my immediate response was that a secular bear is self-evident. It's difficult to imagine how the market could be characterized any other way when, despite recent bull market highs, the S&P 500 has lagged Treasury bills for a decade. Thinking about it more carefully, my impression is that investors are averse to the idea of a "secular bear market" because it implies something about the future. For stocks to be priced to deliver disappointing future returns, after already suffering a decade of disappointing returns, seems too extraordinary to consider. But that's exactly what we should expect. First, let's define our terms. From my perspective, a "secular bear market" comprises a series of two, three or more individual "cyclical" bear markets (with cyclical bulls in-between), where in general, each successive bear market achieves a lower level of valuation at its trough. Over the period from peak valuations and trough valuations, it has invariably been true that stocks have lagged Treasury bill returns. . This result is not particularly sensitive to the level of Treasury bills, but instead reflects the simple mathematics of total return. Holding the P/E multiple constant, the total return on stocks is equal to earnings growth plus the dividend yield. Since peak-to-peak earnings growth for the S&P 500 has historically been capped at only about 6% from cycle to cycle (as I've presented in numerous prior charts), it's hard to get significant long-term traction from one bull market peak to the next unless the second bull market reaches a higher P/E than the first one did. Worse, when each successive bear market registers a lower trough valuation, even rapid earnings growth is incapable of pulling total returns to satisfactory levels. Secular bears in the past century include 1901-1917, 1929-1949, and 1964-1982. To illustrate, consider the 18-year period from 1964 to 1982. From a valuation standpoint, the S&P 500 reached about 20 times record earnings in 1964 and 1965. Even though stock prices continued erratically higher until 1972, a buyer of stocks at the rich valuations of the mid-1960's would have been only slightly ahead of Treasury bills by the 1972 peak.
In price terms, the S&P 500 never broke below that 1974 trough even in 1982. But largely because valuation multiples were slightly lower in 1982 than they were in 1974, stocks continued to lag Treasury bills. Overall, an investor buying at the rich valuations of the mid-60's would have waited 20 years to reliably outperform Treasury bills. Although high T-bill yields in the late-1970's and early 1980's reinforced this effect, the primary cause of poor long-term returns was the extended decline in valuation levels from the rich levels of 1964 (about 20 times peak earnings) to the depressed trough of 1982 (less than 7 times peak earnings). Fast forward to early 1998, when the price/peak earnings multiple of the S&P 500 shot to 27. Even though multiples surged to an even more extreme level of 34 at the 2000 peak, I actually view early 1998 as the "point of no return," where an investor could reliably expect to lag Treasury bills over the next couple of decades, regardless of what happened over the shorter-term. Why "the next couple of decades?" Again, recall that even in the recent "productivity boom," S&P 500 earnings growth has hardly exceeded 6% annually (and has required a move to record profit margins to sustain those earnings). So we can do some simple algebra. Given an initial P/E multiple of 27, and an initial dividend yield of 1.5%, we can quickly calculate projected annual total returns over the next 20 years as: Projected total return = (1.06)(X/27)^(1/20) + .015(27/X + 1)/2 - 1.0 where X is the expected P/E multiple at the end of the 20-year period. I've detailed this method of projecting long-term stock returns in other weekly comments - the first term is simply a capital gain factor that takes into account both P/E changes and earnings growth, while the second term approximates the average dividend yield over the period. Had investors assumed in early 1998 that stocks would still be trading at a rich multiple of 20 times peak earnings (the same level as the 1929, 1972 and 1987 highs) two decades later, they would have projected annual total returns of (1.06)(20/27)^(1/20) + .015(27/20+1)/2 - 1.0 = 6.18% annually. Regardless of what might happen over shorter periods of a few years, that roughly 6.18% total return was their long-term upside. A more reasonable expectation would have been to allow the next two decades to take the market's P/E multiple somewhere toward its historical average of about 14 (even that average is influenced by high late-1990's multiples - excluding those values, the historical norm is less than 13). Assuming a terminal multiple of 14 would have produced a projected 20-year annual return of 4.77%. Allowing a reasonable margin for error would have required investors to recall that bear market troughs above about 11 times prior record earnings have rarely produced sustainable long-term returns. So a thoughtful long-term investor would allow for the possibility that the valuation multiple might at some point touch 11. Indeed, most historical bear markets have troughed at even lower multiples, and of course, the killer bears like 1974 and 1982 have taken multiples to about 7. But even assuming a future trough multiple of 11, investors would have had to allow for a projected 20-year annual return of 3.94%. In short, even by early 1998, an investor could reasonably expect that over the next two decades, the total return on the S&P 500 would most probably range between about 4-6% annually. We should not be surprised that the past decade has fulfilled that disappointing projection. And we should not be surprised if the next decade produces an identical outcome. Presently, the price/peak earnings multiple on the S&P 500 is about 16, but recall that this is based on top-of-channel earnings at record profit margins. On normalized margins, the P/E would still be above 20 here. If we "split the difference" and base our calculations on a current multiple of 18, at a 2% dividend yield, we can calculate the following 10-year annual total return projections for the S&P 500: Terminal multiple of 20: 9.02%, terminal multiple of 14: 5.65%, terminal multiple of 11: 3.54%, terminal multiple of 7: 0.02%. My impression is that "splitting the difference" is generous, but in any case the mid-range projections have historically been the most reliable. On that basis, expectations of 4-5% annual total returns for the S&P 500 over the coming decade would be reasonable. That said, it is important to recognize that prior "secular bear markets" have generally provided a wide range of investment conditions and many good opportunities to accept market risk. Though investors who carelessly ignore valuations are sometimes forced to endure years of disappointing returns, it is also generally true that excellent investment opportunities develop well before the end of a secular bear. In the 1965-1982 period, for example, the brutality of the 72-74 plunge made the water safe for investors for several years at a time beginning in 1974 (even though stock returns didn't durably outperform T-bills until the 1982 trough was set). Though the 2000-2002 decline was similarly brutal, it unfortunately originated from truly psychotic valuations of about 34 times record earnings. As a result, the 2002 bear market trough occurred at the highest valuation (15 times record earnings) of any prior bear market trough in history, and failed to clear the excesses of the prior bubble. Predictably, the recent bull market has been far less robust than typical bulls (which generally achieve total returns of about 27% annually during the bullish phase of the market cycle). We will be more comfortable if the next bear market, when it emerges, takes valuations below about 12 times record earnings. As I've noted before, the recent level of record earnings is based on record profit margins about 40-50% above historical norms, so even a multiple of 12 would not be particularly "cheap" on normalized earnings, but we would be more comfortable about the prospects for long-term equity returns at that point. As usual, we do not require valuations to move to "undervaluation" in order to remove some or all of our hedges, but better valuations would certainly increase the extent to which we respond to improvements in market action. For now, we have no basis to accept market risk from either valuations or market action. That will certainly change at some point ahead, and we will respond accordingly. Market Climate As of last week, the Market Climate for stocks remained characterized by unfavorable valuations and unfavorable market action, holding the Strategic Growth Fund to a fully hedged investment stance. I have no particular expectations regarding near term market prospects, given that stocks are neither overbought or oversold presently. Given the average amount of time that the market has historically spent to consolidate oversold conditions of the sort we observed in January, my impression is that downside risks could increase as we move into March, but such impressions don't influence our investment positions - we remain fully hedged on the basis of the evidence we presently observe, and no forecasts or scenarios are required. In bonds, the Market Climate remains characterized by unfavorable yield levels and relatively neutral market action. Though yields have moved higher in recent weeks, they are still considerably lower than they would be without a "flight to safety" effect. That's not to say that investors won't continue that flight to safety in the near term - only that they've priced bonds to deliver unsustainably low long-term returns. Since it's likely that we will continue to observe both relatively weak economic news combined with periodic upward inflation surprises, I would still anticipate a "sawtooth" trading range - gradual downward pressure on yields driven by continued economic deterioration, punctuated by upward spikes primarily on inflation data. The Strategic Total Return Fund has a particularly short duration of about one year at present, with a bit more than 20% of assets in precious metals shares, where the Market Climate remains very favorable on our measures. --- The foregoing comments represent the general investment analysis and economic views of the Advisor, and are provided solely for the purpose of information, instruction and discourse. Prospectuses for the Hussman Strategic Growth Fund, the Hussman Strategic Total Return Fund, the Hussman Strategic International Fund, and the Hussman Strategic Dividend Value Fund, as well as Fund reports and other information, are available by clicking "The Funds" menu button from any page of this website. |
|||||||||||||||||||||||||
|
For more information about investing in the Hussman Funds, please call us at
1-800-HUSSMAN (1-800-487-7626) 513-326-3551 outside the United States Site and site contents © copyright Hussman Funds. Brief quotations including attribution and a direct link to this site (www.hussmanfunds.com) are authorized. All other rights reserved and actively enforced. Extensive or unattributed reproduction of text or research findings are violations of copyright law. Site design by 1WebsiteDesigners. |