|
|
||||||
|
|

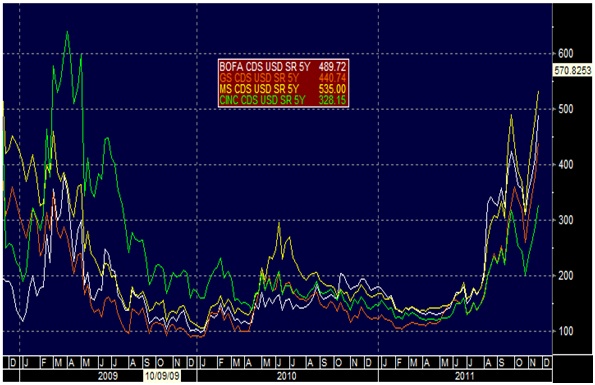
November 28, 2011 Are Corporate Balance Sheets Really the Strongest in History? Let's begin with a few notes on continuing credit strains in Europe and elsewhere. "Greece is demanding harsh conditions from its creditors as it starts talks with lenders about a proposed bond swap, a key part of Europe's plan to reduce its debt pile and save the euro... The Greeks are demanding that the new bonds' Net Present Value -- a measure of the current worth of their future cash flows -- be cut to 25 percent... a far harsher measure than a number in the high 40s the banks have in mind... It is increasingly likely that Greece will force bondholders who do not voluntarily take part in the bond swap to accept the same terms and conditions, something that is possible because most of the bonds are written under Greek law." Should we care? Given the extremely high leverage ratios of European banks, it appears doubtful that it will be possible to obtain adequate capital through new share issuance, as they would essentially have to duplicate the existing float. For that reason, I suspect that before this is all over, much of the European banking system will be nationalized, much of the existing debt of the European banking system will be restructured, and those banks will gradually be recapitalized, post-restructuring and at much smaller leverage ratios, through new IPOs to the market. That's how to properly manage a restructuring - you keep what is essential to the economy, but you don't reward the existing stock and bondholders - it's essentially what we did with General Motors. That outcome is not something to be feared (unless you're a bank stockholder or bondholder), but is actually something that we should hope for if the global economy is to be unchained from the bad debts that were enabled by financial institutions that took on imponderably high levels of leverage. Notably, credit default swaps are blowing out even in the U.S., despite leverage ratios that are substantially lower (in the 10-12 range, versus 30-40 in Europe). As of last week, CDS spreads on U.S. financials were approaching and in some cases exceeding 2009 levels. Bank stocks are also plumbing their 2009 depths, but with a striking degree of calm about it, and a definite tendency for scorching rallies on short-covering and "buy-the-dip" sentiment. There is a strong mood on Wall Street that we should take these developments in stride. I'm not convinced. Our own measures remain defensive about the prospective return/risk tradeoff in the stock market.
As for expectations of using the ECB to backstop the euro, as I noted last week ( Why the ECB Won't, and Shouldn't, Just Print ), we will not just all wake up one day to some surprise announcement that the ECB has started buying distressed European debt. If there is any potential at all to engage the ECB, the first thing to look for will be a concerted but unpopular change in EU treaties to subordinate the fiscal policies of each European country to one centralized fiscal body for all of Europe. In effect, the next step in the process will be an attempt to trade greater ECB flexibility in return for centralized fiscal control. We'll probably see the phrases "cede sovereignty" and "fiscal union" quite a bit in the coming weeks. Late last week, after a meeting between Merkel (Germany), Sarkozy (France) and Monti (Italy), the three leaders squashed market expectations that they would ask the ECB to intervene. Instead, they announced "propositions for the modification of treaties" that would have nothing to do with the ECB. The best chance to resolve the crisis, in Merkel's words, is to "make clear that we must take steps toward a fiscal union; to express the conviction that we know policies must be more closely coordinated if you have a common, stable currency." Exactly. So now the main questions are whether the attempt at modifying the EU treaties will garner unanimous support from all the European member countries, and whether a greater fiscal union will ease the euro crisis. The answers, I think, are yes, and partially. What I mean by "partially" is that provided an acceptable agreement for greater fiscal union, Germany is more likely to distinguish short-term fiscal instabilities from long-term ones, which may increase its willingness to provide direct backstops and allow greater flexibility for the ECB to (moderately) intervene in the markets. But there is one key issue remaining. The euro will not survive, in my view, unless the individual countries create an "out" over a period of perhaps 5-7 years by gradually rolling over their debt into new bonds that are convertible into their legacy currencies. If they solve their problems, no conversion would be necessary. But if greater fiscal coordination fails and various member countries continue to have intractable budget imbalances, they could exit the euro without causing a collapse in the entire system. As I noted last week, the average maturity of Euro-area debt is only about 6-7 years, so introducing convertibility features could provide Europe a significant release-valve over a fairly short period of time. Introducing a convertibility option to Euro-area debt would certainly introduce additional "conversion premiums" for various countries, but those would largely substitute for the rising default premiums that are currently being tacked onto yields. Better for market concerns to affect individual European states than to threaten one-third of the developed world, and by extension, the entire global economy. Are corporate balance sheets really the strongest in history? It is freely accepted by investors as fact that U.S. corporate balance sheets are the stronger than ever before in history. This view is largely driven by the significant amount of cash (checking deposits, savings deposits, money market funds, commercial paper holdings) on corporate balance sheets. Our difficulty with this view is that no single line item on a balance sheet is a sufficient indication of "strength." Most useful measures are derived from ratios at the very least, and ideally calculations across a variety of dimensions. The best line item on corporate balance sheets today is typically "Cash and Equivalents." But while the amount of cash and cash-equivalents on U.S. (nonfinancial) corporate balance sheets has increased significantly, particularly relative to the cash-strapped lows of 2009, corporate cash is certainly nowhere near historical highs relative to debt. As a side note, probably the dumbest use of balance sheet data that we hear from time-to-time is when analysts talk about the P/E multiple of a stock "after you back out the cash," as if the cash line item can meaningfully be subtracted from the market cap of the equity. Really? If a company issues a billion dollars of debt, and then holds the proceeds in cash, does that suddenly make the stock "cheaper" because we can now back out that cash from the company's market cap? Um, no. While cash holdings are relatively high compared with total assets and net worth, even those figures are in the range of 5-10%, only about 3 percentage points above historical norms. Cash levels are "high" in the sense of being a larger percentage of total assets than normal, but the "excess" cash amounts to roughly $700 billion, versus total assets of non-financial corporations of about $28.6 trillion. The excess is fairly second-order from the standpoint of overall balance sheet "health."
The best that can be said is that corporations are fairly liquid here, but this is a much different statement than saying that corporate balance sheets have "never been healthier in history." In evaluating overall balance-sheet health, it is important to consider the overall debt burden of corporations. As the following chart shows (based on Federal Reserve Flow of Funds data), the debt burden of U.S. corporations is near all-time highs, having retreated only modestly since 2009. Debt burdens are elevated regardless of whether they are measured against total assets or net worth. Certainly, corporations are presently benefiting from very low interest rates on corporate debt, which substantially reduces the servicing burden of these obligations. But the combination of high debt levels and low servicing burdens does create a potential risk to corporate health in the event that yields rise in future years. Overall, the picture is fairly stable at present thanks to low yields and high levels of cash-equivalents, but it is important for investors to keep in mind that cash can burn fairly quickly during economic downturns, and debt is not spread evenly across corporations. The bottom line is that at an aggregate level, corporate balance sheets look reasonable, but are certainly not "stronger than they have ever been in history." Cash levels are elevated, but this is at best a second-order factor (with excess cash representing only a few percent of total assets), while debt remains near record levels relative to total assets and net worth. In any event, balance sheet risks should be evaluated on a business-by-business level, rather than accepting the blanket notion that cash levels are so high that nobody needs to worry about corporate credit risk.
In going through the Flow of Funds data this week, I thought a few other features of the data were interesting. First, was the profound decline in tangible assets as a percentage of total corporate assets since 1980. This decline goes hand-in-hand with an increase in financial assets held by non-financial companies. At present, more than half of the total assets held by non-financial companies in the U.S. represent financial assets such as debt securities and equities. This is striking, in that we presently have a menu of prospective returns on financial assets that is among the most dismal in history. While the move toward zero interest rates has certainly been excellent for bonds when we look in the rear-view mirror, the fact that prospective rates of return are now so low suggests that a large portion of corporate assets are unlikely to achieve very much in the way of future returns, barring a decline in those asset prices. Something to think about.
Finally, the Flow of Funds data include two handy series, one representing the total net worth of nonfinancial companies, and the second representing the market value of the equities (stocks) of those companies. Intuitively, if those calculations are any good, one would expect that if we create a ratio of equity market value to total net worth, it might be a reasonable valuation indicator. In fact, that's just what we find. Though the Flow of Funds data isn't as useful as one would like in practice (since it is only reported quarterly with a lag), it turns out that a low ratio of equity market value to total net worth is a very good indicator of high subsequent total returns for the S&P 500 over the following 10-year period. In contrast, a high ratio of equity market value to total net worth is predictably followed by weak 10-year total returns for the S&P 500. Let's call this the price-to-net-worth ratio (note that this is not Tobin's Q, which is based on replacement cost of assets, nor is it price-to-book, which is based on historical book values). As of the latest data, the market value of the equities ($15.21 trillion) for non-financial companies was nearly equal to the total net worth of those companies ($15.05 trillion, reported at market value in the Flow of Funds data) for a price-to-net-worth ratio of about 1.01. Note that a ratio near 1.0 is not fair value - rather, the historical median and average of the price-to-net-worth ratio is just 0.75. The present level of about 1.0 has historically corresponded to a subsequent 10-year S&P 500 total return averaging only about 5% annually, which is fairly close to the estimate we get from a variety of other historically reliable methods, though the recent decline has improved our expectations a bit. Note that the right scale on the following chart is inverted, so higher levels of valuation on the left scale (blue line) correspond to weaker levels of subsequent return on the right scale (red line).
Market Climate As of last week, the Market Climate in stocks was characterized by a combination of rich valuations, unfavorable market action, continued negative economic pressures on forward-looking indicators, and additional indicators (sentiment, credit spreads, etc) associated with a poor average return/risk profile in stocks. Recent market weakness has modestly improved valuations (our 10-year projection for S&P 500 total returns has improved to 5.6% annually). From our standpoint, the overall condition of the market has improved from hard-negative to modestly negative. That still holds us to a defensive position, but allows us to make modest changes in our hedges (shifting index put option strikes, for example) in a way that maintains a strong defense but reduces our vulnerability to blazing short-squeezes and other bursts of "risk-on" enthusiasm. It's worth noting that financial stocks represent a portion of the indices we use to hedge (particularly the S&P 500), but not much of the portfolio of Strategic Growth. As the financials got crushed last week, we slightly reduced that under-weighting in financials, though our weighting remains far below market-weight. We would hold no exposure to the banking sector at all if not for the fact that banks represent a portion of our most efficient hedges, but as the market values come down, it is more reasonable to "anti-hedge" a bit, in order to reduce our discomfort during periodic bursts of short-covering. So the recent decline has given us a chance to "soften" our "hard-defensive" position somewhat, but we remain broadly defensive in both Strategic Growth and Strategic International. I expect that we'll still experience a bit of discomfort on days when investors take a lopsided "risk-on" stance (chasing financials and materials while abandoning less volatile sectors), but I don't expect as much sensitivity to speculative rampages as we've seen on some of the more exuberant days in recent memory. In Strategic Total Return, we continue to carry a moderate duration of about 3 years in Treasury notes, and about 20% of assets in precious metals, and small single-digit exposures in (non-euro) foreign currencies and utilities, which we have increased slightly in response to recent weakness. The best characterization of our recent investment activity is that we have made very modest portfolio shifts in response to what we view as a very modest improvement in market conditions (particularly valuations) from what were, and remain, negative levels. I expect that major changes in our investment stance will accompany major changes in market conditions, and we don't see that yet. I continue to be very concerned about global recession risks, and further deterioration in credit conditions. That said, we constantly attempt to align our investment positions in response to shifts in prevailing conditions as new data emerges. We remain defensive here (with the exception of precious metals shares where the expected return/risk profile remains favorable on our measures), but are open to accepting much more constructive investment positions as the evidence changes. --- The foregoing comments represent the general investment analysis and economic views of the Advisor, and are provided solely for the purpose of information, instruction and discourse. Prospectuses for the Hussman Strategic Growth Fund, the Hussman Strategic Total Return Fund, the Hussman Strategic International Fund, and the Hussman Strategic Dividend Value Fund, as well as Fund reports and other information, are available by clicking "The Funds" menu button from any page of this website. |
|||||||||||||||||||||||||
|
For more information about investing in the Hussman Funds, please call us at
1-800-HUSSMAN (1-800-487-7626) 513-326-3551 outside the United States Site and site contents © copyright Hussman Funds. Brief quotations including attribution and a direct link to this site (www.hussmanfunds.com) are authorized. All other rights reserved and actively enforced. Extensive or unattributed reproduction of text or research findings are violations of copyright law. Site design by 1WebsiteDesigners. |