|
|
||||||
|
|

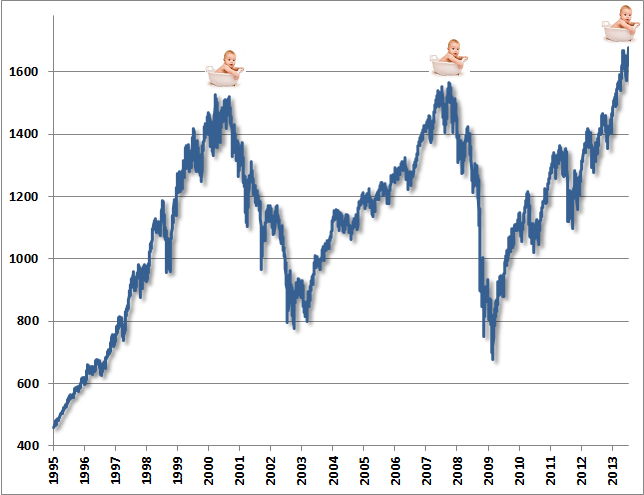
July 15, 2013 Rock-A-Bye Baby Rock-a-bye baby I’ve always thought that singing “Rock-a-bye baby” offers a bizarre lesson to our young, encouraging them to be lulled gently to sleep by describing a scene that should have them wide-eyed with terror. Let’s get this straight. You’ve got this baby, in a cradle, teetering on some fractured bough, at the top of a tree, complacently rocking with each breeze, with baby, cradle, and all facing an inevitable disaster that’s inherent in the situation itself. And everyone is OK with this. You can see why I chose this song for this week’s market comment. It’s important to start this discussion by emphasizing that we align our outlook with the prevailing evidence at each point in time. So for example, if a meaningful retreat in valuations was followed by a firming in our broad measures of market internals, our views would become at least moderately constructive even if stocks were still overvalued from a cyclical or secular standpoint. We remain flexible to new evidence. Given the present evidence, however, my real concern is that much like the rolling tops of 2000 and 2007, each pleasant breeze here lulls investors into complacency – but in the face of overvalued, overbought, overbullish conditions that, from a cyclical and secular standpoint, should probably have them wide-eyed with terror (see Closing Arguments for a broad review of our concerns here). We can’t rule out that the bough will sway for a while longer despite the weight, but we won’t embrace the situation by putting our own baby on the twigs. It’s quite crowded up there already.
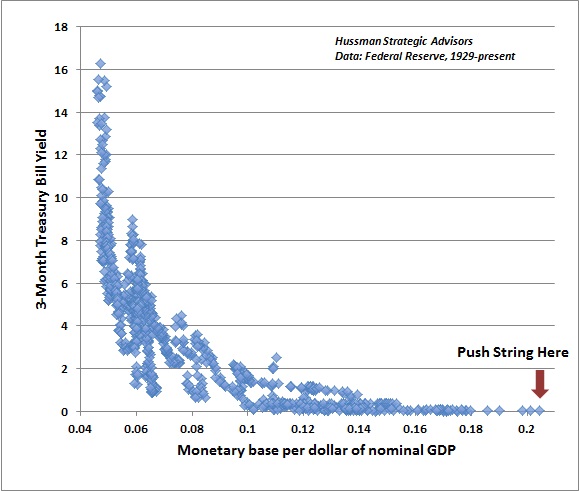
If you examine the 2000 and 2007 tops (and most market peaks outside of the “V-top” ones like 1987) you’ll notice the churn both before and after what turned out in hindsight to be the final peak. The S&P 500 experienced a correction of more than 10% in Jul-Oct 1999 that was then fully recovered, another 10% correction in Jan-Feb 2000 that was then fully recovered, another 10% correction in March-May 2000 that was fully recovered, and a final high in September after which the S&P 500 was cut in half. Likewise in 2007, a 10% correction in Jul-Aug was fully recovered by the October 9, 2007 peak, and the first 10% correction off the peak was followed by a 7% recovery into December before the market began to decline in earnest. Even then, once the market had lost 20% in March 2008, it mounted a nearly 12% advance by May 2008, as a further loss of more than 50% lay ahead. It was this sort of rolling top, with intermittent corrections being followed by recoveries to yet further marginal highs, that prompted this quote from Barron’s magazine just before the 1969-1970 bear market plunge: “The failure of the general market to decline during the past year despite its obvious vulnerability, as well as the emergence of new investment characteristics, has caused investors to believe that the U.S. has entered a new investment era to which the old guidelines no longer apply. Many have now come to believe that market risk is no longer a realistic consideration, while the risk of being underinvested or in cash and missing opportunities exceeds any other.” Investors lose a full-cycle perspective during these periods of enthusiasm. But remember the regularity, worse in the 2008-2009 bear, but consistent throughout history, for typical bear markets to wipe out more than half of the gains from the previous bull market advance (and closer to 85% of the prior gains during “secular” bear phases). Somehow this outcome will be just as great a surprise to investors when the present cycle completes as it has repeatedly been in market cycles throughout history. What helped investors to avoid terrible losses, despite the great discomfort of being out of the market during the exuberance, was attention to the emergence of overvalued, overbought, overbullish, rising-yield conditions. Monetary easing emphatically did not help. Recall that the Federal Reserve was actually easing quite aggressively throughout the 2001-2002 and 2008-2009 market plunges, and that market drawdowns have actually been deeper during periods of easing than during periods of monetary tightening (see Following the Fed to 50% Flops). It’s all well and good to believe that “QE makes stocks go up” and that no other consideration is necessary, as long as one also recognizes that the only way QE has exerted this effect is by encouraging investors to reach for yield and to accept inadequate risk premiums on securities that have always demanded greater risk premiums over time. As for economic impact, there is neither theoretical nor historical evidence of any material “wealth effect” from volatile assets like stocks to consumption or real economic activity. People consume from their conception of permanent income, not from transitory fluctuations in securities (the fact that housing wealth used to be viewed as stable and is increasingly considered unstable is one of the reasons why housing fluctuations have lost their impact on consumption in recent years). Milton Friedman’s work on consumption analysis earned him the Nobel Prize in 1976, and any economics graduate student knows that the elasticity of GDP to stock market fluctuations is minuscule. Outside of Bernanke’s counterfactual and economically illiterate “wealth effect” argument, even the members of the Federal Reserve have no idea what transmission mechanism would link further increases in the monetary base to any increase in economic activity or employment. There are already trillions of dollars of idle reserves in the banking system. Why keep pushing on a string when pushing it relieves no constraint that’s binding? You just have more string to tangle, trip on, and reel in later. In short, QE benefits stocks primarily because investors have come to believe that QE benefits stocks – a belief that is ultimately likely to be added to the long list of extraordinary popular delusions and the madness of crowds. Investing based on expectations of more QE is not an act of analysis or a response to investment merit, but is instead an act of blind faith that borders on superstition. Question: Do the members of the Federal Reserve have any idea how large a contraction in the monetary base would be required now, simply to normalize short-term interest rates by even a fraction of a percent at some point in the future? Based on the tight historical relationship between the monetary base (per dollar of nominal GDP) and short-term interest rates, we estimate that the Fed would have to contract its balance sheet by more than $500 billion simply to engineer the first quarter-point increase in the Federal funds rate. While Bernanke’s words last week were taken as a promise of virtually unlimited QE and the abandonment of “tapering” plans by the Fed, his point was actually much the same as the one expressed three separate times in the latest Fed minutes: “decisions concerning the pace of purchases are distinct from decisions concerning the federal funds rate.” No kidding. Meanwhile, with a monetary base of $3.27 trillion and an estimated duration of at least 7 years on present Fed holdings, the recent 100 basis point move in bond yields has created a loss of over $200 billion for the Fed. The Fed reports capital of only $55 billion on its consolidated balance sheet. but then, just like major banks, the Fed does not mark its assets to market. Most likely, the Fed is now technically insolvent. Moreover, the Fed is levered more than 59-to-1 even against its stated capital. The benefits of QE seem vastly overpriced and excessively trusted, particularly in an environment where the internal debate even within the Fed is becoming more pointed. Two members already want the Fed to taper in order “to prevent the potential negative consequences of the program from exceeding its anticipated benefits,” Not that any of this matters, provided that nobody cares that the Fed has very quietly strayed beyond monetary policy and into fiscal policy. See, the Fed calls the interest on the bonds it holds “profits”, which are returned to the Treasury, while the Fed calls its losses a “deferred asset.” In Bernanke’s words, the losses of the Fed are an “asset” in the sense that they result in a reduction in the amount of future payments of interest handed back to the Treasury (and the public) as that interest is received by the Fed. Put another way, the public will end up paying interest on Treasury bonds, to fill the hole in the Fed’s balance sheet, and without that interest being handed back to the Treasury for public benefit. All this, without the need for any Congressional budget item. The larger the loss, the larger the "deferred asset" on the Fed's books. This is as Orwellian as one can get.
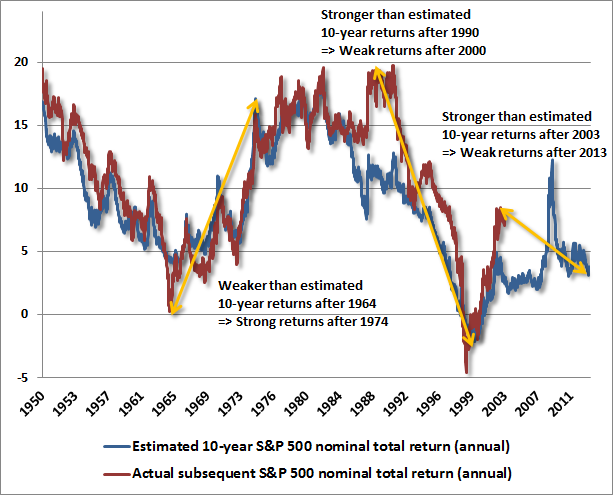
Valuation Notes Last week, our estimate of prospective 10-year S&P 500 nominal total returns dropped to 2.9% annually. Given that the dividend yield on the S&P 500 is just over 2%, this works out to a projection that the S&P 500 Index will at nearly the same level, a decade from today, as it is at present. Investors are welcome to revisit my similar concerns at the 2000 peak (when we actually projected a 10-year loss). There are certainly valuation methods with poor historical track records that suggest that stocks are reasonably priced or undervalued here. Those with a strong correlation with subsequent medium and long-term returns are uniformly bleak (see Investment, Speculation, Valuation and Tinker Bell for a review and historical comparison of various valuation methods). The chart below provides an overview of our 10-year S&P 500 total return projections and their relationship with actual subsequent market returns. Notably, our estimates of prospective returns are certainly not negative as they were in 2000, and are not quite as weak as they were in the housing-bubble period between 2005 and 2007. I would doubtless like a time-machine to return to 2009, when larger stress-testing concerns prevented us from embracing what by our own methods were reasonable valuations (the problem being that similar valuations during the Depression era were followed by a loss of yet another two-thirds of market value). But that 2009 improvement in prospective returns also vanished almost immediately. At present, our estimates of prospective market returns are worse than at any point in history except the periods surrounding the 2007, 2000, and 1929 market peaks.
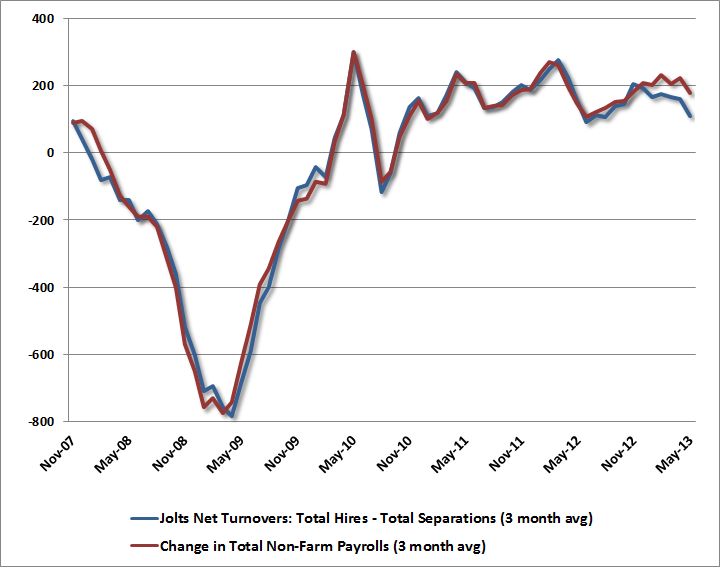
I’ve added a few annotations on the chart above. These identify notable differences between our projected returns and the actual subsequent returns of the S&P 500. Those differences were during the 10-year period following 1964, the 10-year period following 1990, and the most recent 10-year period since 2003. What’s going on here is this: the largest outliers are always periods where valuations reached extreme levels at the end of the 10-year horizon (either undervalued or overvalued). So for example, the weaker-than-estimated returns for the S&P 500 during the decade following 1964 were the result of the market plunge into 1974, which took stocks to deeply undervalued levels. By 1974, projected 10-year returns were about 17% annually, and those projections turned out to be accurate despite intermittent market troubles until 1982. Likewise, the much stronger-than-estimated returns for the S&P 500 during the decade following 1990 were the result of the late-1990’s market bubble, which took stocks to stunningly overvalued levels. By 2000, projected 10-year returns were negative, and those projections turned out to be perfectly accurate. Actual S&P 500 returns slightly undershot our negative projections for the period from 1999-2009, as the 2009 plunge brought market valuations somewhat under historical norms, but there’s certainly no historical basis to consider the 2009 low the start of a “secular” bull market, particularly considering the fact that present valuations are worse than the level at which most secular bear markets have started. Since 2003, actual 10-year returns have exceeded, by a few percent annually, the 10-year returns that we projected at the time (we still shifted to a very constructive view in 2003 based on early improvements in market action, having none of the Depression stress-testing concerns that prevented a similar response in 2009). The stronger-than-estimated returns for the S&P 500 reflect the extreme valuations at present. Again, we currently expect total nominal returns on the S&P 500 to average less than 3% annually over the coming decade, with most of that from dividends, implying an S&P 500 Index still near its present level in 2023 (though undoubtedly after an exciting roller-coaster to nowhere along the way). This may seem as preposterous as our projection of negative 10-year total returns for the S&P 500 in 2000, but I doubt that it will prove any less accurate. Unusual JOLTS In recent years, the rate of U.S. economic activity has hovered in a band that has historically marked the border between expansion and recession. We don’t observe any material economic impact from quantitative easing, and continue to believe that the key event in the recent credit crisis was the FASB move to abandon the requirement for mark-to-market accounting among financial institutions (the Fed’s zero interest policy has merely allowed banks to recapitalize themselves on the backs of savers and the elderly on fixed incomes). Still, there has been a clear tendency for fresh bouts of quantitative easing – in the U.S., Europe, and Japan – to provide transient boosts to economic activity for a few months at a time. It’s little more than a can-kicking exercise, but it has certainly made a mess of economic forecasting in the past few years, as public expectations move wave-like between expansion hopes and recession concerns. That difficulty hasn’t escaped our own work, where the normal lags between leading indicators and coincident economic activity have been at least temporarily distorted. With the understanding that kick-the-can policies add a layer of uncertainty in forming economic expectations, we remain convinced that recession risk remains palpable. Much of the enthusiasm to the contrary has been the result of employment reports in recent months, where non-farm payroll growth has appeared to be fairly resilient. What’s unusual about this is that the change in payroll employment typically correlates very tightly with the “net turnovers” (total hires minus total separations) reported several weeks later in the Job Openings and Labor Turnover Survey (JOLTS) report from the Bureau of Labor Statistics. The chart below shows the 3-month average of the two series since 2007. Notice that while the figures tend to be extremely close over time, we’ve observed a significant divergence in recent months. In contrast to the non-farm payroll report, where reported job growth has averaged 180,000 a month over the past quarter, the JOLTS figures come in at a much more tepid 110,000 average. Indeed, the 6-month disparity between the two series is the largest on record.
I doubt that there’s any intentional distortion in these numbers, but the JOLTS figures certainly line up more consistently with what we observe from other economic measures. Economic series don’t always behave in lock-step, which is why a broad range of evidence is essential to reduce “noise.” It isn’t helpful to have an added layer of noise from QE and seasonal adjustment (where I’m not at all convinced that standard ARIMA methods have fully attenuated the shocks from 2008-2009), but I also view those sources of noise as having gradually declining impact over time. For now, I think it’s sufficient to observe that the data are far more mixed on the economic front than investors may recognize. The continued risk of economic weakness may encourage the QE-bulls, as it will probably reduce (though not eliminate) the rate at which the Fed tapers its purchases. But it’s important to remember that once economic weakness became tangible in 2001 and 2008, no amount of Fed easing was able to prevent the stock market from falling in half. As I’ve noted several times in recent weeks, the worst case scenario for stocks is a sequence of overvalued, overbought, overbullish conditions, followed by internal deterioration, followed by economic weakness. The foregoing comments represent the general investment analysis and economic views of the Advisor, and are provided solely for the purpose of information, instruction and discourse. Only comments in the Fund Notes section relate specifically to the Hussman Funds and the investment positions of the Funds. Fund Notes Having reached overvalued, overbought, overbullish extremes in May on every measure we track, the recent advance has largely recapitulated those extremes, though various bullish percentages (e.g. from Investors Intelligence) are a few points below their highs. Our greatest concern about these extremes tends to be on a horizon of about 18 months. As I’ve noted before, these syndromes seem very precise when one looks at a 70-year chart, but the fact is that these charts compress months and months of churning into a very small area. When the market is forming a rolling top, as it did in 2000 and 2007, and I suspect is forming at present, it’s very easy to get lost in the day-to-day fluctuations, and to forget the big picture due to the apparent “resilience” of prices over the shorter term. Strategic Growth remains fully hedged here, with a “staggered strike” hedge that raises the index put option side of its hedge to a few percent below present market levels. The ability to vary our strike prices and expirations opportunistically has been helpful since the May high. We’ve implemented a variety of exclusions in recent years reduce the frequency of our most defensive positions (prompted by the need to adapt to QE, but in a way that also retains the historical benefit of these positions). With those exclusions in place, conditions similar to the present – warranting a staggered-strike hedge – emerge in only about 5% of historical periods, and just over 10% of the time since 2009. The corresponding historical periods are associated with losses averaging about -40% annualized for the S&P 500 (about -30% annualized taking all instances since 2007). Probably needless to say, these conditions have been associated with no average loss in the S&P 500 since 2009 – a fact attributable entirely to the period since about March 2012. I doubt that the recent resilience of the market reflects a durable change in market dynamics, or in the importance of a conservative stance in the face of overvalued, overbought, overbullish conditions. It clearly relates to monetary policy, and the resulting late-stage blowoff in an already mature and overvalued bull market. I expect that even run-of-the-mill (or worse) market losses over the completion of this unfinished half-cycle should clear up any uncertainty about the risks of extreme overvalued, overbought, overbullish syndromes. Meanwhile, Strategic International remains fully hedged, and Strategic Dividend Value remains hedged at about 50% of the value of its stock holdings. Strategic Total Return presently carries a duration of about 5.8 years (meaning that a 100 basis point move in interest rates would be expected to impact Fund value by about 5.8% on the basis of bond price fluctuations), with about 8% of assets in precious metals shares and about 4% in utilities. The equity positions here continue to balance relatively good valuations in these sectors, by our estimates, against the potential for general equity market losses. Gold prices are hovering closer to production costs, which may pressure shorter-term cash flows for gold producers, but based on historical evidence, we view marginal production costs as a support area for spot gold. Overall, I view a positive but restrained position as reasonable given present conditions. --- The foregoing comments represent the general investment analysis and economic views of the Advisor, and are provided solely for the purpose of information, instruction and discourse. Prospectuses for the Hussman Strategic Growth Fund, the Hussman Strategic Total Return Fund, the Hussman Strategic International Fund, and the Hussman Strategic Dividend Value Fund, as well as Fund reports and other information, are available by clicking "The Funds" menu button from any page of this website. |
|||||||||||||||||||||||||
|
For more information about investing in the Hussman Funds, please call us at
1-800-HUSSMAN (1-800-487-7626) 513-326-3551 outside the United States Site and site contents © copyright Hussman Funds. Brief quotations including attribution and a direct link to this site (www.hussmanfunds.com) are authorized. All other rights reserved and actively enforced. Extensive or unattributed reproduction of text or research findings are violations of copyright law. Site design by 1WebsiteDesigners. |