|
|
||||||
|
|

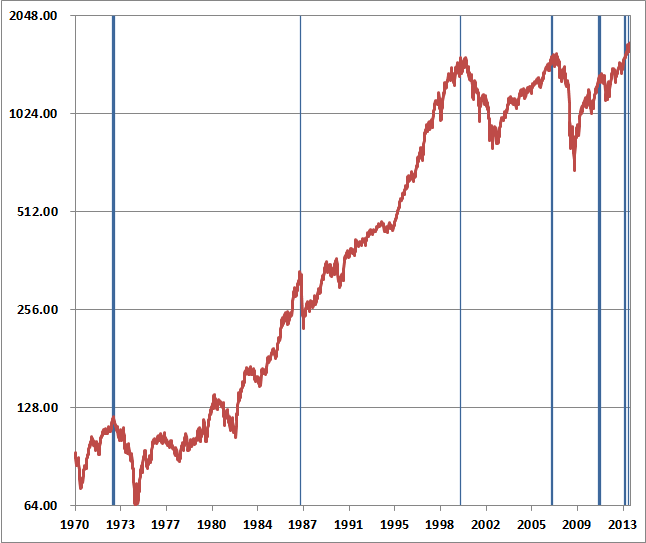
August 5, 2013 The Minsky Bubble “In the ruin of all collapsed booms is to be found the work of men who bought property at prices they knew perfectly well were fictitious, but who were willing to pay such prices simply because they knew that some still greater fool could be depended on to take the property off their hands and leave them with a profit.” In his classic treatise on speculation, Manias, Panics and Crashes (originally published in 1978), the late Charles Kindleberger laid out a pattern of events that has periodically occurred in financial markets throughout history. Drawing on the work of economist Hyman Minsky, the conditions he described are likely far more relevant at the present moment than investors may recognize. Laying the groundwork Kindleberger observed that “waves of bubbles” over a period of time are likely to be related events. Each bubble leads to a crisis, and these crises in turn lay the groundwork for the next bubble. This is really the dynamic that has been in place for more than a decade. The crisis response of the Federal Reserve following the recession and 50% market loss of 2000-2002 was to create credit conditions that then encouraged the housing bubble. The risks of this policy were evident even by mid-2003, but the Fed allowed those risks to fully expand into a housing boom and a second crash. The 2007-2009 market plunge wiped out every bit of total return that the S&P 500 had achieved, in excess of Treasury bills, all the way back to June 1995. In turn, the crisis response to the 2007-2009 collapse was two-fold: one through fiscal policy, and the other through monetary policy. Let’s briefly review the conditions that have set up the current speculative episode. First, as job losses accelerated and household savings collapsed in order to maintain consumption, U.S. fiscal policy responded with enormous government deficits approaching 10% of GDP. Since the deficits of one sector always emerge as the surplus of another, the record combined deficit of governments and households was reflected – as it has been historically – by a mirror image surplus in corporate profit margins, which have surged to record levels in recent years. Essentially, government and household deficits have allowed consumer spending and corporate revenues to remain stable – without any material need for price competition – even though wages and salaries have plunged to a record low share of GDP and labor force participation has dropped to the lowest level in three decades. This mirror-image behavior of profit margins can be demonstrated in decades of historical data, but investors presently seem to believe that these profit margins are a permanent fixture, and have been willing to price stocks at elevated multiples of earnings that are themselves elevated over 70%, relative to historically normal profit margins. Second, the monetary policy of quantitative easing has gradually become the nearly exclusive focus of investors. What’s fascinating about QE is that it has no transmission mechanism to the real economy except as a weak can-kicking exercise - and even then only by creating enormous distortions in pursuit of minute "wealth effects." The risk premiums of risky securities have become unsustainably compressed in the process, and the Fed's balance sheet has metastasized to $3.5 trillion - a level that would currently require a nearly $800 billion contraction just to normalize short-term interest rates by a quarter of one percent (see The Price of Distortion). Economists have known for decades (and Milton Friedman won a Nobel Prize partly by demonstrating) that people don’t consume based on fluctuations in the value of volatile assets like stocks, but instead on the basis of their perceived lifetime “permanent income.” Meanwhile, while lowering long-term interest rates might have a positive effect on the demand for credit (though a negative effect on its supply), the fact is that long-term interest rates are virtually unchanged since August 2010, when Bernanke first hinted at shifting to quantitative easing as the Fed’s main policy tool. The central effect of QE is not on the real economy, but on financial speculation. The Fed purchases Treasury and mortgage securities, and creates new base money (currency and bank reserves) as payment. This results in a huge pool of zero-interest assets that someone in the economy has to hold at any given point in time. This zero-interest money is a “hot potato” that creates discomfort and encourages a tendency to “reach for yield” in more speculative assets. Undoubtedly, the universal attention to Fed actions has already created a mob psychology where, to use Kindleberger’s words, “virtually each of the participants in the market changes his or her views at the same time and moves as a herd.” It’s worth observing that the 10-year Treasury yield is also well above the weighted average interest rate since 2010 (weighting by the quantity of Fed purchases), which means that the Fed is underwater on its holdings. Bernanke himself noted at his recent Humphrey-Hawkins testimony that the recent rise in interest rates had wiped out all of the Fed’s unrealized gains, though he feigned ignorance about how much the Fed would lose if interest rates increased by 100 basis points. The math is easy enough, so let’s do it for him. At $3.5 trillion in assets having an estimated duration of about 8 years, against only $55 billion in capital, a 100 point increase in interest rates would wipe out the Fed’s capital five times over. The Fed would probably show an insolvent balance sheet today if its holdings were actually marked-to-market. While there is a very tight historical relationship between the quantity of monetary base (per dollar of nominal GDP) and short-term interest rates, and a strong but weaker relationship between base/GDP and long-term interest rates, there is virtually no long-term relationship at all between base/GDP and equity yields or prospective equity returns (see Aspirin for a Broken Femur). This is a fact that is likely to hit home over the completion of the present cycle, but at least to-date, QE has encouraged speculation on the view that somehow the creation of new monetary base provides an impenetrable safety net for stocks and a permanent ceiling for risk premiums. Meanwhile, margin debt on the NYSE now stands well above 2% of GDP – a level also (and only) reached at the 2000 and 2007 peaks. Aside from noting our concerns for the sake of investors who share our respect for data, validation, evidence, and historical precedent, we don't stand in the way of investors or critics who embrace the view that the Fed has suddenly invented the wheel and that no other consideration is relevant. We just encourage them to take their chances on their own. This is easy enough to do. Just buy the market (Hussman says buy!) In the absence of evidence supporting the expectation of positive return/risk, we will not, and cannot abandon our discipline and do it for them. Nor do I think it’s a good idea. It’s worth remembering that aggressive Fed easing proved wholly ineffective in avoiding the market collapses of 2000-2002 and 2007-2009 (see Following the Fed to 50% Flops). The Minsky bubble Describing the two crisis responses since 2009 – fiscal and monetary – as favorable “shocks” or “displacements” to the financial markets, the setup for a Minsky bubble and crash is complete. As Kindleberger observed (slightly abridged for readability): “Minsky suggested that the events that lead to a crisis start with a ‘displacement’ or innovation, some exogenous shock to the macroeconomic system. If the shock was sufficiently large and pervasive, the anticipated profit opportunities improve in at least one important sector of the economy: the profit share of GDP increases. The boom of the Minsky model is fueled by the expansion of credit. Minsky noted that ‘euphoria’ might develop at this stage. Investors buy goods and securities to profit from the capital gains associated with the anticipated increases in their prices. The authorities recognize that something exceptional is happening and while they are mindful of earlier manias, ‘this time it’s different,’ and they have extensive explanations for the difference. “The continuation of the process leads to what Adam Smith and his contemporaries called ‘overtrading.’ This term is not precise and includes speculation about increase in the prices of assets or commodities, an overestimate of prospective returns, and ‘excessive leverage.’ Speculation involves buying assets for resale at higher prices rather than for their investment income. The euphoria leads to an increase in optimism about economic growth and about the increase in corporate profits. “A follow-the-leader process develops as firms and households see that speculators are making a lot of money. ‘There is nothing as disturbing to one’s well-being and judgment as to see a friend get rich.’ Unless it is to see a non-friend get rich. “Investors rush to get on the train even as it accelerates. As long as the outsiders are more eager to buy than the insiders are to sell the prices of the assets or securities increase. As the buyers become less eager and the sellers become more eager, an uneasy period of ‘financial distress’ follows. Other words used to describe the interval between the end of euphoria and the onset of what classic writers called revulsion and discredit (or crash and panic) are uneasiness, apprehension, tension, stringency, pressure, uncertainty, ominous conditions, fragility. “Distress is not an easily measured condition for an economy. Investors may have become apprehensive when the values of certain variables diverged significantly from average values. Causes of distress and the symptoms of distress are observed at the same time and include sharply rising interest rates in some or all segments of the capital market. The end of a period of rising asset prices leads to distress whenever a significant number of investors have based their purchases of these assets on the anticipation that these prices will continue to increase. Some investors continue to hold the assets because they believe that the price decline is temporary, a hiccup. The prices of the securities may increase again, at least for a while. More and more investors realize that prices are unlikely to increase and that they should sell before prices decline further; in some cases this realization occurs gradually and in others suddenly. The race into money may turn into a stampede. The rush is on. Liquidation sometimes is orderly but may escalate into a panic as investors realize that only a relatively few can sell while prices remain not far below their peak values.” In short, as Kindleberger noted decades ago, the response to one bubble and crash often sows the seeds of the next bubble and crash. In the present instance, those seeds have taken the form of record government deficits with a resulting mirror-image surplus in the form of temporarily elevated profit margins, and distortionary monetary policy that has encouraged increasingly speculative yield-seeking. We remain convinced that equities no longer provide a meaningful risk-premium. Investors have always required one over time. Investors following other well-tested disciplines, with a full recognition of their historical returns and risks, and a commitment to follow those disciplines through the full course of the market cycle, are encouraged to ignore my views and adhere to those disciplines. This includes a buy-and-hold approach. It will be very difficult and uncomfortable at times, but you know that already, and that alone is strength. Investors who believe that they can enter the market here, capture some unspecified amount of further market gains, and remain immune to deep losses over the completion of this market cycle, can easily run that experiment on their own. My own view is that far stronger opportunities to take a constructive or aggressive market stance will emerge over the course of the coming market cycle, and I have no concern that Fed policy has made market cycles obsolete. Short-term gain, long-term pain In late-January, I observed: “We can now restrict market extremes matching the present instance to seven instances in history: 1929 (at least on the basis of imputed sentiment data), 1972, 1987, 2000, 2007, 2011, and today. “The blue lines on the chart below identify each point in history where the following overvalued, overbought, overbullish, rising yields syndrome would have been observed: S&P 500 overvalued with the Shiller P/E (the ratio of the S&P 500 to the 10-year average of inflation-adjusted earnings) greater than 18; overbought within 3% of its upper Bollinger band (2 standard deviations above the 20-period average) at daily, weekly, and monthly resolutions, more than 7% above its 52-week smoothing, and more than 50% above its 4-year low; overbullish with the 2-week average of advisory bullishness (Investors Intelligence) greater than 52% and bearishness below 28%; and yields rising with the 10-year Treasury bond yield higher than 6-months earlier. August 1929 can also be included, given that we can impute bullish/bearish sentiment with reasonable accuracy based on the size and volatility of prior market movements. “The market lost 85% between 1929-1932, lost over 50% between 1972-1974, crashed abruptly in 1987, lost over 50% in 2000-2002 and again between 2007-2009, and even lost nearly 20% in the less-memorable 2011 instance.” I’ve updated January’s chart below. Note that the foregoing negative conditions were repeated in May, and just missed another repeat last week (the 2-week average of bullish sentiment reached 51.8 – the difference being insignificant in that using a 51.8 threshold would not have added or removed any of the prior historical instances). As I’ve noted before, these syndromes look fairly precise on a long-term chart, but these charts actually compress months and months of market churning into a very small area, making it very easy to get lost in smaller fluctuations and apparent “resilience” of the market when you actually live through these periods day-to-day.
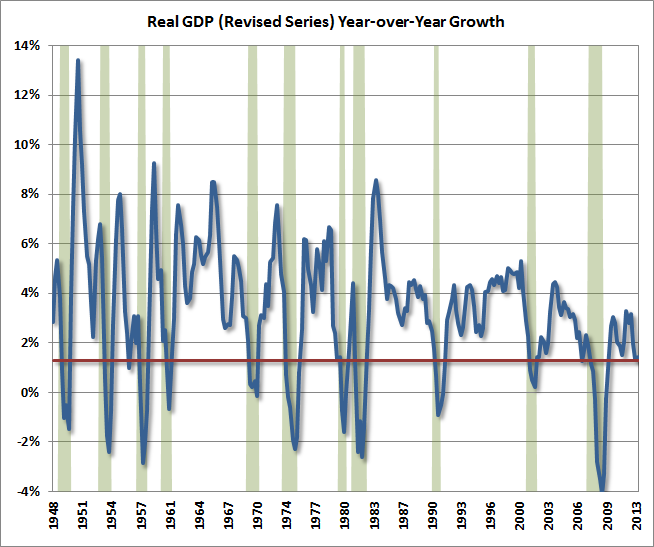
From a long-term and full-cycle perspective, this outcome simply means that investors will suffer even weaker returns over time. Meanwhile, remember that Mr. Market simply calls out the prices. It’s up to investors to decide whether or not to act on them at any point in time. In our view, this should not depend solely on some vague faith in monetary policy, but on careful and reliable measures of valuation, trend-following factors, pressures on risk premiums, and the presence or absence of particularly hostile or favorable syndromes of market conditions. A moderate retreat in valuations, coupled with an early improvement in market internals and an absence of a clearly overvalued, overbought, overbullish syndrome would likely shift our view to a decidedly more constructive outlook. Keep in mind how valuations work. For a given set of expected cash flows, higher prices in the present are associated with lower prospective returns in the future. For example, another 10% market advance would drive our estimates of 10-year prospective long-term returns for the S&P 500 to about 1.8%. We can’t rule this out, and prospective returns were even worse in 2000. Still, we know that the same strenuously overvalued, overbought, overbullish syndrome observed in 1972, 1987, 2000, 2007 and even 1929 (on imputed sentiment data) is already in place here, and that the losses from such extremes have been spectacular. We invest on objective evidence that we can test over a century of market cycles. In recent years, we’ve incorporated a number of useful considerations into our approach – particularly related to trend-sensitive measures – that can be validated over history. But history leaves us with little faith that even aggressive Fed action can prevent steep market losses in the absence of supports that have presently dropped away. Investors who wish to try their luck and rest their security on the Fed can certainly do so without our permission or agreement. Notably, based on Z.1 flow of funds data, and even incorporating the recent GDP benchmark revisions, we estimate that the market value of nonfinancial stocks to nominal GDP is now higher than it was in 2007, and higher than at any point in history outside the bubble extremes of 1999 and 2000 (which were followed by a decade of negative market returns). Jim Chanos notes that more stocks are trading above 3-times book value today than in 2000, which largely reflects the fact that small- and mid-cap stocks were far more appropriately valued at that point than at present. Fortunately, a 20% market decline would boost our estimates of 10-year prospective S&P 500 returns to roughly 5.5%, a 30% decline to about 7.2%, and a 40% decline to about 9.1%. We remain confident that far better opportunities to accept risk and seek returns will emerge over the completion of the present market cycle. As a side note, these estimates reflect valuation methods that have correlation of nearly 90% with actual subsequent returns. These same methods projected 10-year returns above 11% in 2009 (the imperative to stress-test against Depression-era outcomes, not valuation, was our concern then. Similar concerns will not emerge in any future cycle, as I doubt that data from the Dutch Tulip mania or the South Sea Bubble will ever become relevant). We have been riding a dangerously overextended set of conditions for quite a while now, and the retreat from similar extensions has always been unpleasant. Just like 1929, and 1972, and 1987, and 2000, and 2007, and even the truncated 2011 instance (which was followed by a decline of only about 19%), it’s unlikely that investors who enjoy the thrill of owning stocks at the market’s highs will actually realize the gains by selling at those levels. As Galbraith observed decades ago, speculative episodes create a vested interest – “as long as they are in, they have a strong pecuniary commitment to the belief that there will be yet more; those who express doubt are said to be unable, because of defective imagination or other inadequacy, to grasp the new and rewarding circumstances that sustain and secure the increase in values.” None of this removes the frustration of missing that elusive thrill, but a full-cycle perspective remains essential in our view. Economic Notes A few quick economic observations. Since May, the number of individuals classified as “Employed, usually work part time” has increased by 534,000. The number of individuals classified as “Employed, usually work full time” has declined by 148,000. So employment (a lagging indicator) has increased in recent months, but its composition is deteriorating notably. The new GDP benchmark data was also released last week, showing year-over-year growth in real GDP and real consumer spending that has generally only been seen in recessionary contexts. Maybe this time is different, but our view continues to be that the economy continues to struggle at what has historically been the threshold between expansion and recession.
We’ve learned all too well that each round of QE has at least enough impact to kick the can down the road for a couple of quarters at a time, at the cost of greater distortions. As thoughtful economists like Lakshman Achuthan and value investors like Jeremy Grantham and Seth Klarman know, this has temporarily made fools out of geniuses and geniuses out of fools. So refraining from any forecast of what will happen in the near term, it’s sufficient to observe that the economic data is not nearly as strong as widely perceived, and the impact of QE on stock prices does nothing to improve the underlying cash flows. The advance of recent months has only made the prospect for dismal long-term equity returns even worse. QE has no ability to improve that situation. At this point, it can only elevate the distortion and thereby worsen the outcome. It’s doubtful that investors who are enjoying the thrill of recent highs will actually realize the benefit of these prices. The foregoing comments represent the general investment analysis and economic views of the Advisor, and are provided solely for the purpose of information, instruction and discourse. Only comments in the Fund Notes section relate specifically to the Hussman Funds and the investment positions of the Funds. Fund Notes Though we began the upward portion of the present cycle in 2009 with glowing short-term and long-term performance relative to our benchmarks, the advancing half of this unfinished market cycle has been challenging. That’s partly as a result of my insistence on stress-testing in 2009-early 2010 to guard against Depression-era outcomes, and partly because quantitative easing has deferred economic and financial consequences that historically emerged more quickly in response to weakening economic factors and overextended market conditions. Even so, I expect the coming market cycle to provide a broad set of typical opportunities – as were more than sufficient even in the 2000-2007 market cycle (or 2002-2009 measuring from trough-to-trough). It’s worth remembering that even the recent cycle included a point where our estimates of 10-year prospective S&P 500 total returns exceeded 10% annually, and I doubt that investors are cursed to see the present 2.8% estimate move ever-lower without reprieve. None of our present concerns prevent the market from moving yet higher over the near term, and investors who believe that the Fed has eliminated market cycles can act on that belief easily enough, without my involvement or obstruction. My hope is that I’ve dissuaded such beliefs, and that the adherence to our discipline will not tax our patience much longer, as it undoubtedly has in recent years. That patience and discipline rest on research that has been validated over a century of market evidence, including research that we’ve introduced in recent years. Regardless of near-term market direction, we continue to adhere to that discipline. Importantly, we haven’t abandoned historical evidence in the belief that it is obsolete. Despite new wrinkles from monetary policy, I don’t believe this is a new era, and I don’t believe that “this time is different.” Financial markets always have, and always will, experience periods of euphoria and panic. A century of evidence leaves me convinced that market returns are best pursued by following a well-informed investment discipline that is sensitive to valuation, sensitive to risk, and trades in ways that ultimately provide a service to the economy by leaning against and reducing market distortions rather than amplifying them. Much of our trouble in the recent cycle stems from Federal Reserve policies that have intentionally had the effect of distorting the financial markets and directing scarce savings toward speculation rather than productive investment. But these policies have only made the need for risk-managed discipline more pressing, because stocks have always been priced to reflect significant risk-premiums over time. Movements from negligible risk premiums (as we presently estimate) to significant ones are the stuff from which deep cyclical market losses are made. Strategic Growth Fund remains fully hedged, with a “staggered strike” hedge that places the strike prices of its index put options within a few percent of present market levels. Strategic International remains fully hedged. Strategic Dividend Value is hedged at about 50% of the value of its stock holdings. Strategic Total Return carries a duration of about 5.8 years (meaning that a 100 basis point move in interest rates would be expected to impact Fund value by about 5.8% on the basis of bond price fluctuations), with about 6% of assets in precious metals shares and about 4% of assets in utilities.--- The foregoing comments represent the general investment analysis and economic views of the Advisor, and are provided solely for the purpose of information, instruction and discourse. Prospectuses for the Hussman Strategic Growth Fund, the Hussman Strategic Total Return Fund, the Hussman Strategic International Fund, and the Hussman Strategic Dividend Value Fund, as well as Fund reports and other information, are available by clicking "The Funds" menu button from any page of this website. |
|||||||||||||||||||||||||
|
For more information about investing in the Hussman Funds, please call us at
1-800-HUSSMAN (1-800-487-7626) 513-326-3551 outside the United States Site and site contents © copyright Hussman Funds. Brief quotations including attribution and a direct link to this site (www.hussmanfunds.com) are authorized. All other rights reserved and actively enforced. Extensive or unattributed reproduction of text or research findings are violations of copyright law. Site design by 1WebsiteDesigners. |