|
|
||||||
|
|

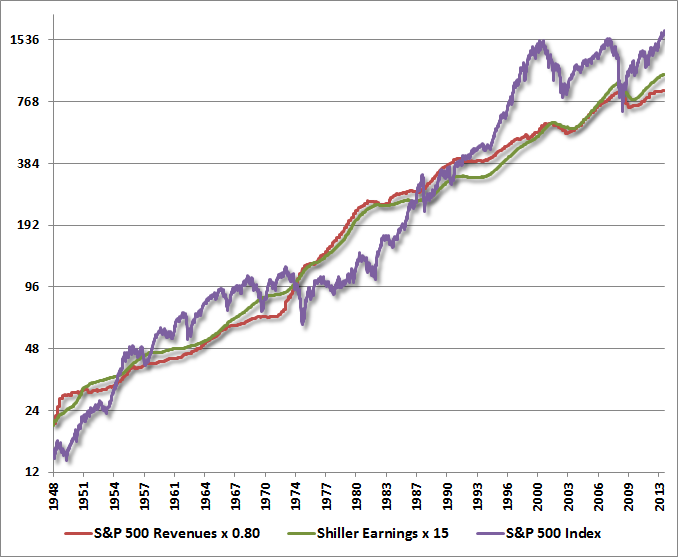
August 12, 2013 Extreme Brevity of the Financial Memory Two weeks ago, the blue-chip S&P 500 index advanced to a Shiller P/E of 24.6 (S&P 500 divided by the 10-year average of inflation-adjusted earnings). Notably, even using 10-year averaging, the implied profit margin embedded into Shiller earnings is about 18% above the historical norm. On normal profit margins, the Shiller P/E would now be at an even more extreme 29. Jim Chanos notes that more stocks are trading above three times book value today than at the 2000 market peak, which is largely because of a speculative runup in secondary issues. Indeed, small cap stocks and over-the-counter Nasdaq stocks have outpaced even the S&P 500 in recent months. Last week, Barron’s magazine bubbled “this is a golden era for initial public offerings,” describing the IPO market as “white hot,” featuring a flood of new offerings – mainly small cap growth ventures. All of this enthusiasm seems rather encouraging, unless one is familiar with market history, in which case one has to wince at the almost creepy re-emergence of these speculative hallmarks, in sequence. A couple of weeks ago, I quoted the words of former NYSE Chairman Bernard Lasker just before the 1969-1970 market plunge, but I slightly abridged the quote. Here’s a longer version: “I can feel it coming.... a whole new round of disastrous speculation, with all the familiar stages in order – a blue-chip boom, then a fad for secondary issues, then an OTC play, then another garbage market in new issues and finally the inevitable crash. I don’t know when it will come but I can feel it coming and, damn it, I don’t know what to do about it.” Decades ago, in his narrative A Short History of Financial Euphoria economic historian J.K. Galbraith lamented the “extreme brevity of the financial memory.” He wrote, “In consequence, financial disaster is quickly forgotten. In further consequence, when the same or closely similar circumstances occur again, sometimes in only a few years, they are hailed by an always supremely self-confident generation as a brilliantly innovative discovery in the financial and larger economic world. There can be few fields of human endeavor in which history counts for so little as in the world of finance. Past experience, to the extent that it is part of memory at all, is dismissed as the primitive refuge of those who do not have the insight to appreciate the incredible wonders of the present.” “There is protection only in a clear perception of the characteristics common to these flights into what must conservatively be described as mass insanity. Only then is the investor warned and saved. In the short run, it will be said to be an attack, motivated by either deficient understanding or uncontrolled envy, of the wonderful process of enrichment.” Consider Galbraith’s analysis in the context of the tech bubble, the housing bubble, and the present QE-induced bubble: “Speculation building on itself provides its own momentum. This process, once it is recognized, is clearly evident, and especially so after the fact. So also, if more subjectively, are the basic attitudes of the participants. These take two forms. There are those who are persuaded that some new price-enhancing circumstance is in control, and they expect the market to stay up and go up, perhaps indefinitely. It is adjusting to a new situation, a new world of greatly, even infinitely increasing returns and resulting values. Then there are those, superficially more astute and generally fewer in number, who perceive or believe themselves to perceive the speculative mood of the moment. They are in to ride the upward wave; their particular genius, they are convinced, will allow them to get out before the speculation runs its course. They will get the maximum reward from the increase as it continues; they will be out before the eventual fall. “For built into this situation is the eventual and inevitable fall. Built in also is the circumstance that it cannot come gently or gradually. When it comes, it bears the grim face of disaster. That is because both of the groups of participants in the speculative situation are programmed for sudden efforts at escape. Something, it matters little what – although it will always be much debated – triggers the ultimate reversal.” In my view, deep losses await investors who are so willing to abandon the lessons of history, in the belief that the Fed has discovered some new economic principle and permanent safety net in quantitative easing. There is no question that our grounding in market history, my insistence on stress-testing our methods against Depression-era outcomes, our reliance on historically reliable valuation methods, all of these have been handicaps to one degree or another during the advancing portion of this unfinished half-cycle. That’s given us a few bruises, but they’re smaller than the markets experience over a typical cycle, and nothing is broken. Though I would have liked to choose a different time and different circumstances to learn certain things that we’ve learned, the past few years have not encouraged us to abandon the evidence from a century of market history. To the contrary, we’re encouraged to run to it – not only for its promise but for its shelter. When I examine our present methods over market cycles across history, and even over the course of the most recent cycle, I’m convinced that they’re capable of navigating what is likely to be a volatile future. I expect that to be true regardless of whether the coming years will bring bubbles, crashes, growth, or recession; whether QE remains a fixture of monetary policy, or whether it turns out to be as specious as the Emperor’s New Clothes. It is only an unending advance in prices, with no material retreat, that I think would be challenging. Of course, that’s exactly what investors have experienced since late-2011, and as Galbraith noted, that’s exactly the scenario that speculators believe will continue indefinitely, until the moment they discover otherwise. Valuation Notes Our present estimate of 10-year S&P 500 nominal annual total returns over the coming decade is only 2.8%. See Investment, Speculation, Valuation, and Tinker Bell for an overview of our general estimation approach, and a number of “shorthand” models that themselves have an over 90% correlation with subsequent 10-year S&P 500 total returns. That article also reviews the relative uselessness of several popular alternatives. It remains perplexing to me that the predominant “valuation” approach on Wall Street continues to be “forward operating earnings times arbitrary multiple.” To give a bit more perspective on present valuations, the chart below shows the S&P 500 Index, along with two simple fundamental measures. The red line shows S&P 500 revenues times 0.80, which is the historical norm for the price/revenue ratio prior to the late-1990’s bubble. The green line shows Shiller earnings times 15, again reflecting the pre-bubble norm. The first thing that one might notice is that the S&P 500 has deviated markedly from these lines over time – we’ll review the implications of that below. The second thing one might notice is that even the green and red lines depart periodically. This is because the implied “profit margin” embedded in Shiller earnings varies over time. Using the two fundamentals below, it’s actually more accurate to take the average than to use one in preference to the other.
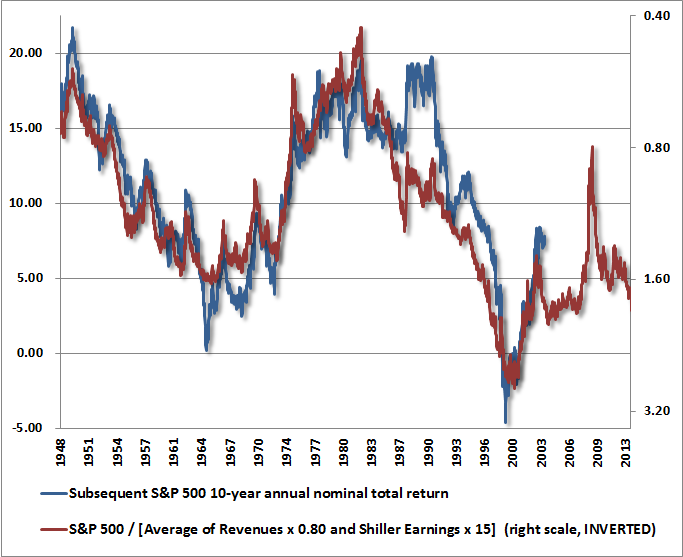
The chart below provides the answer. The red line shows the ratio of the S&P 500 to the average of the two fundamental norms: 80% of S&P 500 revenues, and 15 times Shiller earnings. That line is plotted on the right scale, inverted, properly using a log scale (which is appropriate when one compares ratios to percentages). The blue line shows the actual subsequent annual nominal total return of the S&P 500 over the following 10-year period. The correlation here is close to 90%, and as I’ve noted before, even deviations between actual returns and estimated returns are informative (see The Siren’s Song of the Unfinished Half Cycle). Over the years, we’ve presented similar charts based on a wide range of alternative fundamentals – the results are not at all unique to revenues or Shiller earnings.
As unpleasant as these numbers may be, S&P 500 revenues are presently at 1105, and Shiller earnings are presently about 69. On the basis of historical norms, deviations from which are highly related to subsequent market returns, a level of about 960 on the S&P 500 – nearly 45% below present levels – would be associated with historically average total returns. By contrast, the present level of about 1700 is associated with expected 10-year total returns for the S&P 500 that are among the lowest in history. Given a 2.6% 10-year Treasury bond yield, investors may be comfortable accepting weak prospective long-term returns for the S&P 500 – we estimate about 2.8% annually over the coming decade. From our perspective, the expected “equity risk premium” here is non-existent, and the intervening downside risks are extraordinary. That said, could we – a year from now – be looking at a higher S&P 500 and even worse prospective long-term returns? Yes, we could. This is where factors like market internals, overbought conditions, sentiment, yield pressures, and other considerations are relevant. If present valuations were joined by favorable market action and the absence of an overvalued, overbought, overbullish syndrome of conditions, the historical record suggests that some amount of speculative exposure could be reasonable and even advisable. In contrast, the market has rarely been more overextended than it is at present, and market internals remain quite messy (see Market Internals Suggest a Shift to Risk Aversion), with interest-sensitive securities generally weak and four confirmed “Hindenburg” signals in the past 5 sessions, which are much less frequent and far more troublesome than the raw signals (see 2009 vs 2013). While quantitative easing has certainly postponed the consequences of strenuously overvalued, overbought, overbullish conditions – particularly since late 2011 – the handful of similar instances (1929, 1972, 1987, 2000, 2007 and a less severe instance before the 2011 swoon) have always ended badly. In recent years, we’ve incorporated criteria into our own process – validated across historical market cycles – that encourage constructive investment positions even in overvalued markets, provided that market action is favorable and a syndrome of overvalued, overbought, overbullish conditions is still absent. That’s another way of saying that we certainly don’t require undervaluation, or even what we view as “reasonable” valuation, in order to encourage risk-taking. But where conditions have been strenuously overvalued, overbought, and overbullish on a historical basis, neither trend-following considerations nor a friendly Federal Reserve have been helpful, with the one exception of the period since late-2011 (see The Road to Easy Street). I suspect that’s mainly because the anvil hasn’t dropped, and not because it has been removed. For those who are convinced that QEternity – taper, no taper, Yellen, no Yellen – is sufficient to mitigate all other concerns, and who feel they can outrun others to the exit at the correct instant, this experiment can be easily run without our participation. I hope that the narrative of our 2009-early 2010 stress testing is well-understood, and that it’s also understood that we’ve implemented a number of changes to increase our reliance on trend-following factors in the absence of overvalued, overbought, overbullish syndromes, which reduces the set of conditions that we view defensively to only about one-third of market history, while the most strongly defensive conditions (as we observe at present) are associated with just 5% of periods in the past century. The period of generally rich valuations since the late-1990’s (associated with overall market returns hardly better than Treasury bill returns since then) has created a tolerance for valuations that, in fact, have led to awful declines, and have required fresh recoveries to elevated valuations simply to provide meager peak-to-peak returns. At the same time, the intervening recoveries to the 2007 highs and again to the recent market highs, coupled with what Galbraith called “extreme brevity of the financial memory” have periodically convinced investors that the market will advance diagonally forever. History teaches a different and very coherent set of lessons:
Monetary conditions can be a modifier, but have not prevented these basic tendencies from dominating over time (see Following the Fed to 50% Flops). At the end of the day, our approach is straightforward – to align our investment outlook with the expected return/risk that we estimate, based on prevailing conditions, at each point in time (see Aligning Market Exposure with the Expected Return/Risk Profile for a broad review of how we approach the markets). Investors adhering to a buy-and-hold strategy, diversified across asset classes, fully recognizing the potential depth of intervening declines, and committed to remaining passive over the course of the market cycle, are encouraged to adhere to that discipline. If you question your commitment to stay with a buy-and-hold through a difficult period, remember that the best point to shift from one studied long-term discipline to another is when the existing discipline has performed well relative to the alternative. Too many investors abandon studied disciplines when they encounter a period of difficulty, chasing ones that have recently performed well. Unless one also studies that switching strategy and demonstrates that the switching rule is effective over the long-term (which we doubt because it's a recipe for buying high and selling low), the habit of switching between disciplines is evidence of having no discipline at all. Finally, investors whose strategy is simply “chase QE until you shouldn’t” are certainly free to pursue that undisciplined experiment, but I expect it to end poorly. The foregoing comments represent the general investment analysis and economic views of the Advisor, and are provided solely for the purpose of information, instruction and discourse. Only comments in the Fund Notes section relate specifically to the Hussman Funds and the investment positions of the Funds. Fund Notes Market conditions continue to be characterized by a strenuously overvalued, overbought, overbullish syndrome of conditions, with speculation following all of the familiar stages, from an advance in large-capitalization “blue chip” stocks, to speculation in secondary and over-the-counter issues, to a boom in new issues. I continue to believe that the lessons of market cycles across history have not been made obsolete by a policy of quantitative easing that has largely run its course, and that has no mechanical link to stock prices in the first place, except the confidence that the "hot potato" of zero-interest money created by the Fed will force investors to continue to accept lower and lower prospective long-term returns on risky securities. Historically, there is a strong inverse relationship between the amount of monetary base (per dollar of nominal GDP) and short-term interest rates, a significant but weaker relationship between the monetary base and long-term interest rates, and virtually no historical relationship at all between the monetary base and equity yields or returns. Investors appear to be relying on a dramatic overestimate of the correlation between the level of the monetary base and the S&P 500, where no meaningful cyclical correlation exists historically. Indeed, even including data since 2009, the correlation between changes (absolute or percent) in the monetary base and changes in the S&P 500 is slightly negative for every horizon of 6 years or less. It seems ridiculous to restrict the analysis of this relationship to two diagonal lines (one in the S&P 500, one in the monetary base) measured precisely from the 2009 market bottom – ignoring all prior data as irrelevant. Of course, the habit of abandoning traditional measures in favor of spurious relationships and bad statistics is part and parcel of speculative episodes (remember the “price to eyeballs” ratio invented to justify speculation during the dot-com bubble?) Strategic Growth Fund remains fully hedged, with a “staggered strike” position that raises the strike price of its index put options somewhat closer to present market levels. Strategic International remains fully hedged. Strategic Dividend Value is hedged at about 50% of the value of its stock holdings. Strategic Total Return continues to carry a duration of about 5.8 years (meaning that a 100 basis point move in bond yields would be expected to impact Fund value by about 5.8% on the basis of bond price fluctuations), and also holds about 6% of assets in precious metals shares, with about 4% of assets in utility shares.--- The foregoing comments represent the general investment analysis and economic views of the Advisor, and are provided solely for the purpose of information, instruction and discourse. Prospectuses for the Hussman Strategic Growth Fund, the Hussman Strategic Total Return Fund, the Hussman Strategic International Fund, and the Hussman Strategic Dividend Value Fund, as well as Fund reports and other information, are available by clicking "The Funds" menu button from any page of this website. |
|||||||||||||||||||||||||
|
For more information about investing in the Hussman Funds, please call us at
1-800-HUSSMAN (1-800-487-7626) 513-326-3551 outside the United States Site and site contents © copyright Hussman Funds. Brief quotations including attribution and a direct link to this site (www.hussmanfunds.com) are authorized. All other rights reserved and actively enforced. Extensive or unattributed reproduction of text or research findings are violations of copyright law. Site design by 1WebsiteDesigners. |