|
|
||||||
|
|

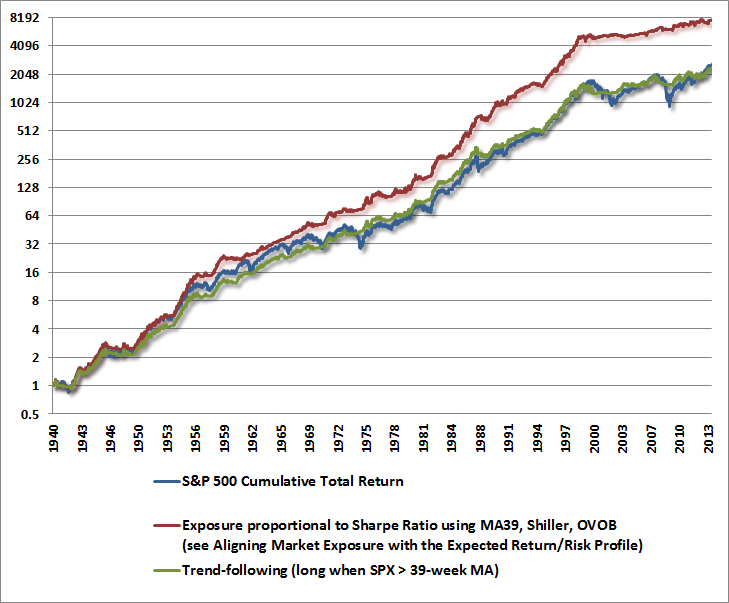
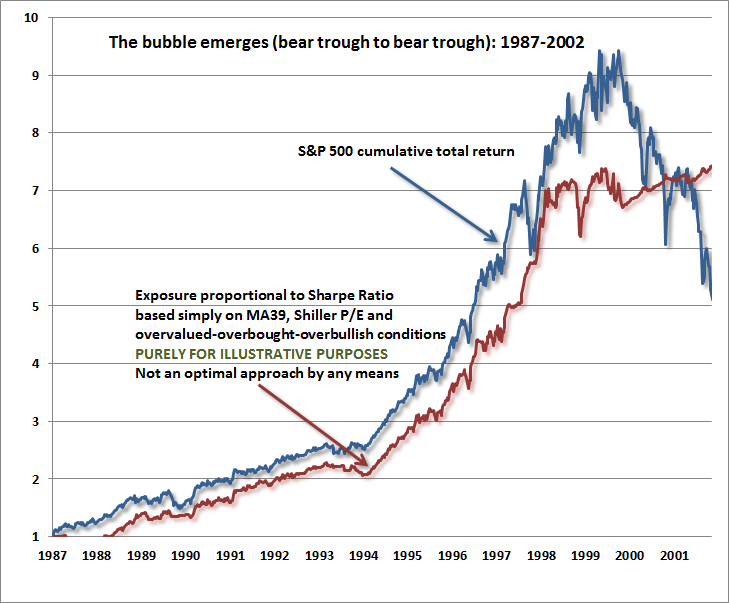
November 18, 2013 Chumps, Champs, and Bamboo “The seed of a bamboo tree is planted, fertilized and watered. Nothing happens for the first year. There´s no sign of growth. Not even a hint. The same thing happens – or doesn´t happen – the second year. And then the third year. The tree is carefully watered and fertilized each year, but nothing shows. No growth. No anything. Then the bamboo tree suddenly sprouts and grows thirty feet in three months.” ― Zig Ziglar This story is more than a quote about persistence – it’s actually a reasonable description of risk-managed investing. Over the years, I’ve observed that numerous simple risk-managed investment strategies have substantially outperformed the market over the complete market cycle – particularly those that accept market risk in proportion to the estimated return/risk profile associated with prevailing conditions at each point in time. What I may not have done sufficiently is to describe the profile of how that outperformance is typically achieved over the market cycle. As the workhorse here, let’s go back to the very simple model described in Aligning Market Exposure with the Expected Return/Risk Profile. What follows is not a description of the investment models we use in practice, which involve more numerous considerations and a much broader ensemble of models and methods. The measures presented here are very simple, and while even these conditions are associated with distinctly different average market outcomes, they’re nowhere close to the degree of separation that can be obtained and validated across history with a broader ensemble of evidence. Without reviewing every detail, recall that this model partitions market conditions based on whether the S&P 500 is above or below its 39-week smoothing (MA39) and whether the Shiller P/E (S&P 500 divided by the 10-year average of inflation-adjusted earnings) is above or below 18. When MA39 is positive and the Shiller P/E is above 18, conditions are further partitioned based on whether or not advisory sentiment (based on Investors Intelligence figures) has featured more than 47% bulls and fewer than 27% bears during the most recent 4-week period. Investment exposure is set in proportion to the average return/risk profile associated with a given set of conditions (technically we use the “Sharpe ratio” – the expected market return in excess of T-bill yields, divided by the standard deviation of returns). While a simple trend-following approach using MA39 alone (similar to following the 200-day moving average) has actually slightly underperformed the S&P 500 over time, that trend-following approach has had a fraction of the downside risk of a buy-and-hold strategy, with a maximum loss of about 25%, versus a maximum loss of 55% for a buy-and-hold. By contrast, the very simple Sharpe ratio strategy here has clearly outpaced a pure trend-following approach, with much smaller periodic drawdowns. Note that the chart below is on log-scale. Each horizontal bar represents a 100% difference in cumulative value.
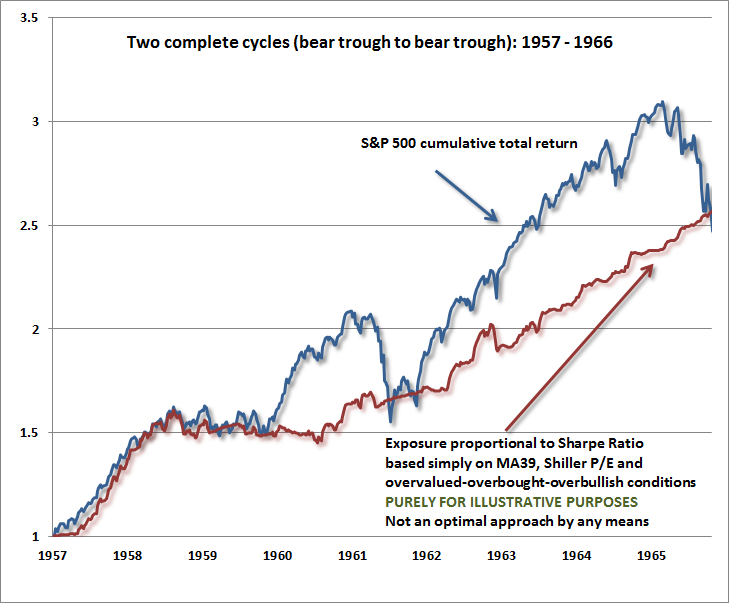
While we view the illustrative model shown here as simplistic and merely adequate, it nicely demonstrates that investors benefit over the long-term by being conscious of trend-following considerations, valuation considerations, and the periodic emergence of overvalued, overbought, overbullish conditions. To address the elephant in the room directly, I’ll note (as usual) that our own actual experience in 2009- 2010 differed significantly from this model as well as those we actually use in practice. This is because the unwise policy response to the credit crisis resulted in much deeper economic and employment losses than were ever observed in the post-war period, and I insisted on ensuring that we could navigate both post-war and out-of-sample Depression-era data (even though our existing methods had navigated the preceding years quite well). The resulting “miss” in the interim was not a reflection of models or strategy but rather what I saw as a fiduciary obligation. I should also note that overvalued, overbought, overbullish conditions have been entirely ignored by the markets since late-2011. Those two events – one self-imposed, and the other what I view as a temporary deferral of bad consequences – have left a mark in the rear-view mirror. Still, the windshield is clear, and the key issue is how investors should approach the markets going forward. With no need for further stress-testing in future cycles, and every expectation that overvalued, overbought, overbullish syndromes will continue to bite as sharply as they have in every other complete market cycle, I continue to believe that the future belongs to disciplined investors who adhere to historically-informed strategies. Full Cycle Profiles Part of the ability to sustain discipline comes from understanding the profile of returns from that discipline over time. For example, investors often become convinced late in a bull market that “the greatest risk is being out of the market.” The only antidote to that is an understanding of how critical those speculative moments are from the standpoint of full-cycle investment returns. Put simply, the majority of the outperformance from risk-managed investment approaches over time comes from the avoidance of severe initial losses following overvalued, overbought, overbullish conditions, and from the limitation of deep and extended losses as market action subsequently deteriorates. Though the market has advanced in the face of persistently overvalued, overbought, overbullish conditions since about late-2011, the result is a financial precipice that has become even more extreme and hazardous. To illustrate how the long-term outperformance of risk-managed strategies often accrues over the full course of the market cycle, I’ve divided the graph above into a number of segments spanning complete market cycles (measured trough to trough; measuring peak-to-peak would just shift these by a half-cycle). Again, I’ll emphasize that the model we’re using for illustration is quite simplistic – enough to adequately demonstrate the point, but nowhere near what a broader ensemble of considerations can achieve over the complete cycle. Consider first the two complete market cycles from the 1957 bear market low to the 1966 bear market low. While a simple risk-managed approach outperforms the S&P 500 over both complete cycles, with far smaller periodic losses, the long-term outperformance is owed to the repeated avoidance of severe losses.
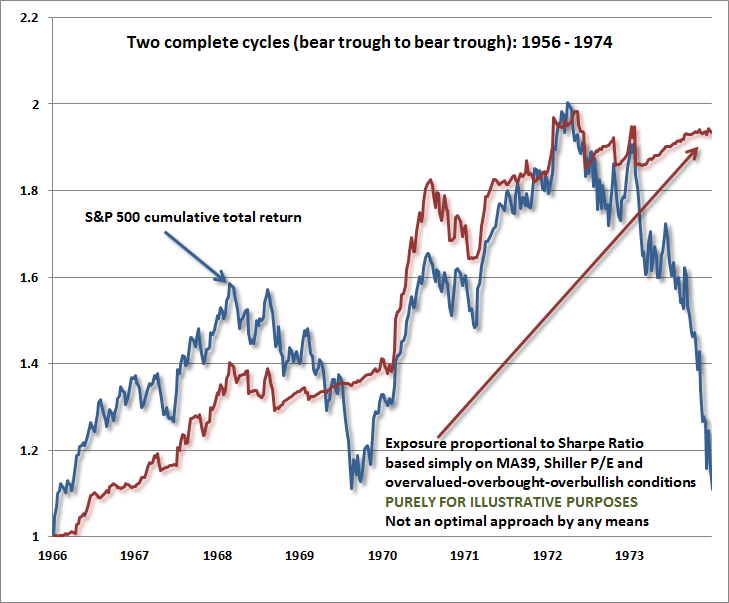
Note the 1961 and 1965 market peaks, where a buy-and-hold was clearly ahead for a while. It’s difficult to overstate my view that present market conditions largely recapitulate these instances. At bull market peaks, it often seems that the market is simply headed higher with no end in sight, and “buy-and-hold” appears superior to every alternative. Meanwhile, the reputation of value-conscious investors and risk-managers goes from “champ” to “chump.” Then, the bamboo tree suddenly sprouts, and the entire lag is often replaced by outperformance in less than a year. Only after the fact does the reputation of risk-managed strategies surge from “chump” to “champ.” By then, it’s unfortunately too late to be of help to many investors who capitulated in frustration at the peak. As Jeremy Grantham at GMO has observed, “we often arrive at the winning post with good long-term results and less absolute volatility than most, but not necessarily with the same clients that we started out with.” Value investor Jean Marie Eveillard puts it similarly – “I would rather lose half of our clients than half of our clients’ money.” On that note, it’s probably worth reviewing how compound returns work. In order to turn a 25% loss into a 55% loss (as the S&P 500 experienced in the 2007-2009 decline), one needs to compound the 25% loss with yet another loss of 40%. One might argue that missing a gain is just as bad as experiencing a loss, but in a repeated game, what matters over time is to stay aligned with the most probable outcomes, control the impact of the improbable ones, and to maintain discipline even in the face of individual outcomes that differ from expectations. Before one wagers one’s life savings in a casino, one has to make the distinction between the possibility of a temporary, speculative and unpredictable gain (as the Fed has recently encouraged), and the risk of a severe and largely predictable loss. The fact that speculation might work out for a while, in hindsight, doesn’t make it any less likely that the money will be lost if the gambling persists. From a portfolio standpoint, if you have a strategy with long-term, full-cycle expected returns that are competitive with a buy-and-hold approach, with less volatility and imperfect correlation with the S&P 500, a portfolio optimization will almost always give that strategy weight unless there are strong requirements that the portfolio should “track” the market. In practice, investors constantly chase strategies with strong recent returns and abandon those that have lagged, with no consideration of the market’s position in the cycle. This results in portfolios that are extremely sensitive to market fluctuations at tops, and that have limited sensitivity to market fluctuations at bottoms – exactly the opposite of what would produce successful outcomes going forward. The next chart shows the two market cycles spanning the period from the 1966 trough to the 1974 trough. Though a risk-managed approach got off to a rough start during the initial bull market advance, the 1970 bear market more than wiped out the differential, and ended at valuations depressed enough to strongly engage the next bull market (though a significant initial advance was required just to bring the S&P 500 above its 39-week smoothing – one reason we prefer to gauge market action based on a much broader range of market internals). Notice the fairly dramatic ending of the 1970-1974 market cycle as the S&P 500 lost half of its value. It’s important to recognize that present valuations far exceed the valuations at the 1972 peak, though we do presently observe the same rare and extreme syndrome of overvalued, overbought, overbullish, rising-yield conditions as in 1972 (see A Textbook Pre-Crash Bubble).
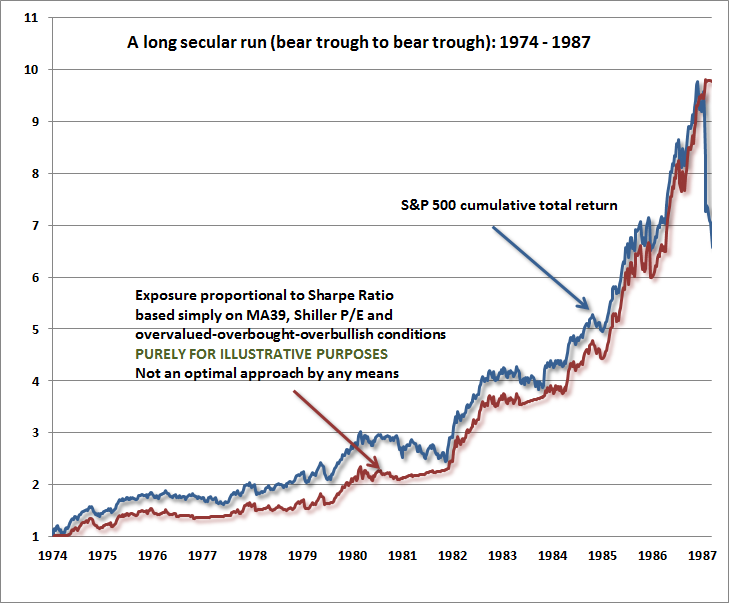
The next chart runs from the 1974 trough – the lowest point of what was a secular bear market – to the 1987 trough. By the 1987 peak, this risk-managed approach was neck-and-neck with a buy-and-hold approach, despite a few periods of lagging performance. Then the market abruptly crashed, and the benefit of risk-management became far more evident.
Moving ahead, the next chart runs from the 1987 bear market low all the way through the technology bubble, ending with the 2002 bear market low. Notice in particular what would have been an agonizing period between 1998 and 2000, where the active strategy actually lost value while the S&P 500 surged to record overvaluation. Once again, the full benefit of a risk-managed strategy emerged during the completion of the market cycle. Chump to champ. Somehow, despite extreme valuations, extreme bullishness, elevated profit margins, and overbought conditions, many investors were convinced that “this time” was different because of new technology, so the benefits of risk-management were entirely lost on them.
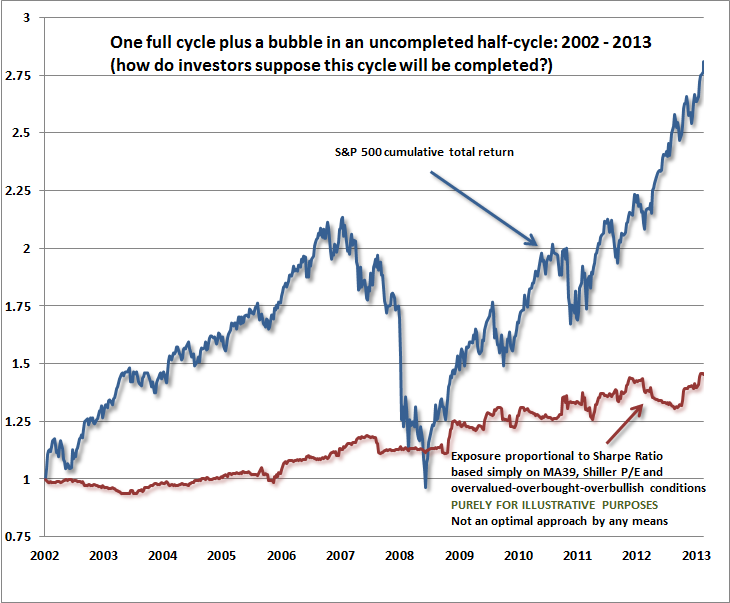
The point of a risk-managed investment strategy is to build long-term performance by capturing periods of “legitimate” investment merit and even rational speculation by focusing market exposure during periods where some combination of trend-following and valuation is favorable, but only until overvalued, overbought, overbullish features emerge. Late-stage, speculative market advances are avoided because they regularly prove vulnerable to steep losses with uncertain timing. Which brings us to the present cycle. Actually, since 2002 we’ve observed one complete market cycle, and one unfinished half-cycle. I emphasize the unfinished nature of the present market cycle as a reminder that this chart is not yet like the preceding ones, but I have no doubt that the tail end of this chart will look quite similar. A risk-managed approach has been helped neither by the persistently rich valuations during this period (outside of late-2008 and 2009), nor by the market's recent levitation in the face of extremely overvalued, overbought, overbullish conditions. It’s a great ride at the moment, but investors will probably find out soon enough that they’re actually on the El Diablo Stunt Coaster.
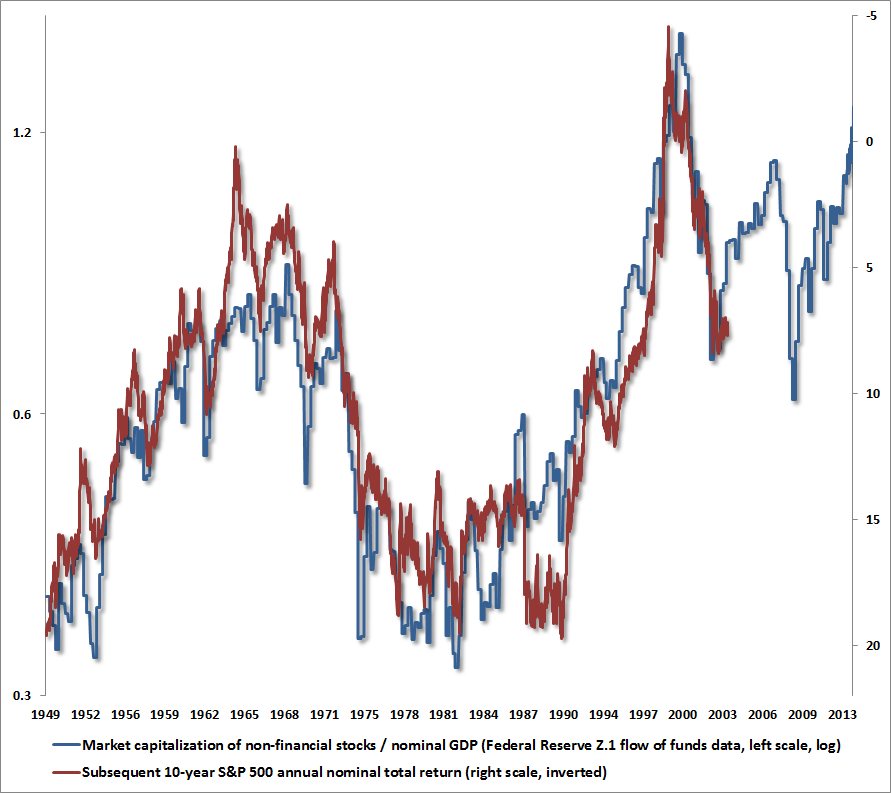
At present, we estimate 10-year nominal total returns for the S&P 500 averaging just 2.3% annually. Strikingly, the median price/revenue ratio of stocks in the S&P 500 is now above the level we observed in 2000. At an index level, the current price/revenue ratio of 1.63 eclipses the level of 1.60 observed at the 2007 peak, and is more than twice the average level observed for the S&P 500 in data prior to the late-1990’s market bubble. The Shiller P/E is now 25.4, which exceeds every pre-bubble observation in history except for the weeks of August 26, 1929 and September 3, 1929. Meanwhile, the ratio of market capitalization to nominal GDP significantly exceeds the 2007 level and is approaching the 2000 extreme. The Federal Reserve Z.1 data reports market capitalization for non-financial equities, but internal calculations that include financials are quite similar. We prefer to use the Z.1 figures because they are available to anyone who cares to examine the data. The chart below is updated based on market action through last week. Note the close relationship between market cap/GDP (left scale) and actual subsequent 10-year nominal total returns for the S&P 500 (right scale, inverted). Back in 2009, this measure was consistent with expected 10-year total returns for the S&P 500 of about 10% annually (though nowhere close to the near-20% total returns available at the 1950 and 1982 lows). Presently, this measure is consistent with negative total returns for the S&P 500 over the coming decade. If one factors in dividends, this very reliable indicator implies an S&P 500 about 20% lower, a decade from now, than it is today. Open note to the FOMC: It may be helpful to actually run the same chart for the “equity risk premium” estimates that you seem to embrace, so you understand how badly they correlate with subsequent market outcomes (see the “Tinker Bell” section of Investment, Speculation, Valuation and Tinker Bell to get some idea of what you’ll find, but there’s no need to take my word for it). The damage is already done, of course, and there’s really no way to prevent future outcomes from being as dismal as recent ones have been glorious. As Robert Shiller observed at the 2000 peak, “It’s just an unfortunate situation.” But at least the Fed will approach the next crisis with a better sense of what is evidence and what is dogma.
The Answers Are In The Data It’s quite correct to observe that the Shiller P/E was even higher at the 2000 bubble peak than it is today, provided that one also observes that the S&P 500 has achieved a nominal total return averaging just 3% annually since then. Moreover, even that 3% annual return has been achieved only by driving present valuations to what are again the highest levels in pre-bubble history. The Fed has done it again – and it doesn’t even realize it. We have another equity bubble on our hands – the third since 2000 – and the fallout will be enormous. Understand that we can actually test measures like the “equity risk premium” that Janet Yellen so blindly quoted last week as evidence that stocks are not in a bubble. We can listen to Yellen’s assertions to the Senate that QE has significantly lowered interest rates in support of economic activity, and actually observe that long-term yields are higher today than in October 2010 when QE2 was launched. We can (and do) estimate all sorts of valuation measures, and we can observe how they correlate with subsequent market returns (valuation measures should always be gauged in relation to how they explain subsequent returns). For various measures of the “equity risk premium”, the correlations are typically less than 30%, which means that they explain less than 9% of variations in 10-year returns. Meanwhile, we can also test the Fed model and raw price/forward operating earnings, and discover a similarly poor relationship with subsequent market returns. Then we can test market cap/GDP, price/revenue, and other valuation measures that normalize profit margins. The correlation here is on the order of 90%, which means that they explain about 81% of the variation in 10-year returns (see Investment, Speculation, Valuation and Tinker Bell for more on this). There’s a great deal to be learned from actually examining historical evidence and thinking carefully through how securities are priced. For example, we know that valuation measures that adjust for the cyclicality of profit margins have always and invariably been more tightly related to subsequent market returns than those that don’t. We know that bond yields and stock yields were negatively correlated prior to 1970, and have also been negatively correlated since about 1998. It’s important to think carefully about how cash flows are discounted and securities are priced. For example, we know that the benchmark 10-year Treasury bond has a duration of only 8.8 years, while the S&P 500 has a duration of about 50 years (mathematically, one can show that the duration of equities is inverse to the dividend yield). So while low 10-year Treasury yields may strongly impact the discounting at the front end of that duration, one can’t use the 10-year yield as a one-to-one valuation benchmark for equities unless one is convinced that inflation will be low and the economy will still be weak beyond 8.8 years from now, in which case one’s nominal growth assumptions collapse. Stock valuations are far less sensitive to 10-year Treasury yields than Wall Street seems to believe. It turns out that the presumed one-to-one relationship between the 10-year Treasury yield and equity yields (specifically the “forward operating earnings” yield) is nothing more than an artifact of a 16-year disinflationary period between 1982 and 1998, when bond yields declined diagonally and a secular bull market in stocks gradually morphed into a valuation bubble. Outside of that span, the tight relationship between stock yields and bond yields assumed by “Fed Model” has a laughably dismal record, and yet Wall Street and Janet Yellen appear to reference it as fact because they are evidently too convinced by the rules-of-thumb in their heads to actually examine the data (see the August 2007 piece Long Term Evidence on the Fed Model and Forward Operating P/E Ratios for a trip down memory lane, as I tried to disabuse the same beliefs at that market peak. Spoiler alert - nobody listened, and the market plunged by 55%). The bottom line here is that THE ANSWERS ARE IN THE DATA. Empirical questions about valuations and profit margins and wealth effects can be answered, often quite precisely. The empirical conclusion, unfortunately, is that investors are likely to pay dearly for the inattention to evidence that has enabled the present equity bubble. Bubble Update A brief update as to where this bubble stands – while I don’t believe that markets follow math, the course of price movement continues to bear an almost creepy similarity to the “log-periodic” structure that Didier Sornette described in Why Markets Crash (see A Textbook Pre-Crash Bubble). The fact that many other bubbles in history have fit this pattern still isn’t enough to put much confidence on this sort of dynamic, but the fact that so many bubbles have fit this pattern also forces us to consider it. Our best fit of Sornette’s dynamics based on recent price movements now pulls the finite-time singularity into December. So we have to allow for (not expect, not rely on, not predict) a further advance in the weeks ahead, just as we allow for wholesale losses in the market thereafter. A rather minimal expectation is that a run-of-the-mill completion to this market cycle will erase more than half of the recent bull market gains (which bear markets ordinarily do), so the prospect of 1100 on the S&P 500 should really not make investors blink from the standpoint of typical cyclical fluctuation. On a valuation basis, that sort of market loss (about 40% from present levels) would be required simply to restore run-of-the-mill valuations, while a decline of about 55% would put the market at valuations characteristic of run-of-the-mill bear market troughs (though certainly not secular lows like 1950 or 1982). These figures aren’t dissimilar to what I suggested at the 2000 and 2007 market peaks, and for good reason – my view is that valuations have rarely been more extreme, nor investment prospects more precarious, than they are at present. The tragic fallacy of investors here is the very widespread belief that at some point in the future, some recognizable signal or Fed policy change will allow them to exit with their gains by selling stocks near their highs. As investors imagine this opportunity to triumphantly sell when the bell rings, the question is “to whom?” Still, let’s not be shy about the elephant in the room. As I noted last week, one reason to ignore all of my concerns is that I’ve been wrong since 2009, first because I saw stress-testing as a fiduciary obligation (and missed returns in the interim that both our existing methods and the resulting methods could have captured), and later because persistently overvalued, overbought, overbullish extremes that have historically been followed by devastating market losses have instead been followed by further gains, particularly since late-2011 (see The Road to Easy Street for the record on this). The 2008-2009 crisis produced economic and market outcomes that were completely outside of post-war experience. In the Depression, reasonable valuations like those in early 2009 were still followed by a further two-thirds market loss, and many trend-following measures were devastatingly whipsawed. This half-cycle is what it is. For those inclined to abandon all of history in preference for advisors who shoot from the hip, have no sense of the data, make assertions that are testably wrong, or believe that this period represents a new reality, there’s really no need to read my stuff. I continue to view the faith in QE as largely superstitious. Want to know the cause-and-effect relationship that reliably links quantitative easing to the job growth, economic activity, and to financial instruments beyond short-term Treasury bills? So does the Fed. If one examines the data and transmission mechanisms carefully, it’s clear that QE lacks any mechanistic link to the economy, the stock market, or even long-term bond yields. The primary effect of QE is a purely psychological one: creating discomfort for low yields on risk-free investment alternatives, and creating a reach for yield that has driven the risk-premium of risky assets to zero (or worse). While we are allowing for the potential for a further “blowoff” advance, we also remain aware that the present overvalued, overbought, overbullish, rising-yield syndrome has been observed only a handful of times in history, including (exhaustively) 1929, 1972, 1987, 2000, 2007, 2011 (followed by an abbreviated 20% market decline before QEternity was launched by the Fed), and in 2013 (February, May, and today). The continued advance of the market in the face of conditions that have always been terminal for the market is not something that convinces us that “this time is different,” but only that we are climbing a higher cliff with a steeper drop. The average bear market wipes out more than half of the preceding bull market advance. Cyclical bear markets in “secular” bear market periods wipe out closer to 80% of the preceding advance. Every bear market in in history that started from valuations anywhere close to present levels was part of a secular bear market period. My expectations, from strong to weak, are these. Based on valuation estimates that have been strikingly reliable for a century (most recently, accurately projecting negative 10-year returns in 2000, warning of awful outcomes 2007, and indicating far stronger prospective returns in 2009), I am convinced that annual total returns for the S&P 500 will average somewhere between zero and 2.5% nominal (not real) over the coming decade. This suggests that the S&P 500 index itself is likely to be lower a decade from today. Looking out over the completion of this cycle, I strongly expect that the market will easily lose more than half of its recent bull market gains, with a reasonable likelihood that the S&P 500 will be 40-55% below present levels by the end of this cycle. Based on broad historical regularities (but ones that notably have not been useful since late-2011), my general statistical expectation is that the main downside risk for the market concentrates in the coming 18-month period. Finally, based on the log-periodic structure of the recent market bubble (which we don’t rely on and neither should you), my very weak impression is that we have to allow for a further market advance in the range of 6-8% - a pattern that would complete a mathematically beautiful Sornette-type bubble. Though Sornette-type crashes don’t seem to give reasons, I suspect that any subsequent crash would be the result not of Fed-tapering, but of some broader concern. As Sornette observed earlier this year, “equities are expensive, and prices have been propped up by central banks’ easing policies. But the big correction, when it comes, will be triggered by a major political or social event induced when bubbles, driven by the QE everywhere, reach maturity and global instability rises.” The foregoing comments represent the general investment analysis and economic views of the Advisor, and are provided solely for the purpose of information, instruction and discourse. Only comments in the Fund Notes section relate specifically to the Hussman Funds and the investment positions of the Funds. Fund Notes As of last week, Strategic Growth Fund remains fully hedged, with a staggered-strike position that places the strike prices of its index put options within a few percent of present levels. The Fund has also periodically held small index call option positions amounting to a fraction of a percent of assets, on recognition of the modest but unreliable potential for a further near-term market blowoff. Overall, our investment stance is firmly defensive, but we are aware of the increasingly frantic tone of Fed-induced speculation. Given the extremes we presently observe in valuations, bullish sentiment, overbought conditions, fervor for initial public offerings, extraordinary margin debt, and other textbook signs of major speculative peaks, we are necessarily defensive, and therefore necessarily uncomfortable, and small index call option positions have been helpful in muting this discomfort without accepting material downside risk. Strategic International remains fully hedged. Strategic Dividend Value is hedged at about 50% of the value of its equity holdings, and was at its high since inception last week. My view continues to be that new commitments from risk-free assets to Strategic Dividend Value should await better valuations, but I believe that now is an appropriate time to shift from unhedged equities to Strategic Dividend Value for investors who still desire a moderate exposure to equity market fluctuations. Strategic Total Return continues to carry a duration of just over 4 years (meaning that a 100 basis point move in bond yields would be expected to impact Fund value by about 4% on the basis of bond price fluctuations), with about 5% of assets in precious metals shares and about 4% in utility shares. --- The foregoing comments represent the general investment analysis and economic views of the Advisor, and are provided solely for the purpose of information, instruction and discourse. Prospectuses for the Hussman Strategic Growth Fund, the Hussman Strategic Total Return Fund, the Hussman Strategic International Fund, and the Hussman Strategic Dividend Value Fund, as well as Fund reports and other information, are available by clicking "The Funds" menu button from any page of this website. |
|||||||||||||||||||||||||
|
For more information about investing in the Hussman Funds, please call us at
1-800-HUSSMAN (1-800-487-7626) 513-326-3551 outside the United States Site and site contents © copyright Hussman Funds. Brief quotations including attribution and a direct link to this site (www.hussmanfunds.com) are authorized. All other rights reserved and actively enforced. Extensive or unattributed reproduction of text or research findings are violations of copyright law. Site design by 1WebsiteDesigners. |