|
|
||||||
|
|

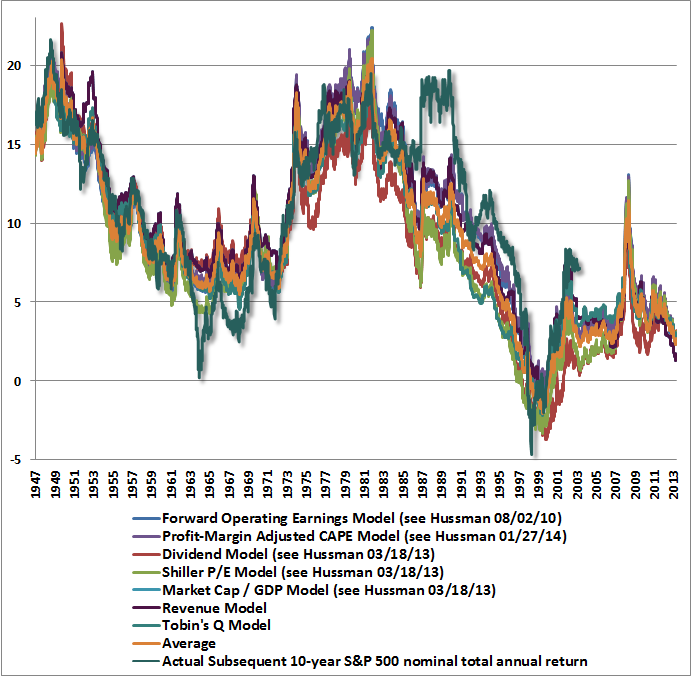
February 10, 2014 Double Trouble On the basis of a broad range of valuation measures that are tightly (nearly 90%) correlated with actual subsequent S&P 500 total returns over the following decade, we estimate that stock prices are about double the level that would generate historically adequate long-term returns. The chart below presents estimated versus actual 10-year S&P 500 total returns using a variety of methods that I’ve detailed in prior weekly comments, and including a few additional ones for good measure. We presently estimate 10-year S&P 500 nominal total returns of only about 2.7% annually over the coming decade, with negative returns on all horizons shorter than about 7 years.
These are, of course, the same methods that allowed us – in real time – to project negative 10-year total returns for the S&P 500 in 2000 even under optimistic assumptions, to identify severe overvaluation in 2007, and to quantify the shift to reasonable valuations in late-2008 and 2009 (our stress-testing response to the credit crisis was emphatically not based on valuation). Note also that valuations are not the sole driver of our investment stance, as should be clear from our shift to a favorable market outlook in early 2003, following the 50% market plunge in 2000-2002. Fortunately, the prospect of awful market returns and steep downside risk from present market levels certainly does not imply a lack of opportunities over time. Valuations adjust, and market conditions change. I fully expect to observe outstanding investment opportunities over the completion of the present market cycle and the next, even if a moderate retreat in valuations leaves them well above historical norms (as we saw in 2003). Now is not the moment to feel rushed to commit capital to a Fed-induced speculative carnival. Needless to say, Wall Street wishes investors to believe that valuations are just fine, and one can hardly watch CNBC for 10 minutes without some reference to stocks being “cheap on forward earnings.” There are clearly useful ways to use forward operating earnings to obtain useful estimates of prospective equity returns (as shown above). But investors should be aware of the profound inaccuracy of valuation estimates based on unadjusted price/forward operating earnings and the “Fed Model” (which largely underlie the “equity risk premium” claims of Greenspan, Bernanke, and Yellen). The fact is that the errors of those models can be predicted in advance from the level of profit margins at the time of the forecast. The higher the level of profit margins, the more these models tend to overestimate future returns, compared with how stocks actually perform in the following years. The glib confidence placed in these models in 2000 and 2007 is enjoying a full – and likely tragic – revival at present. While the 10-year Treasury yield is just 2.7%, that level is “low” primarily relative to the inflation-disinflation cycle from 1970 to 2000. A 2.7% yield is really not much different from the level that Treasury bonds provided throughout history prior to about 1970. More important to recognize is how weakly the 10-year Treasury yield is related to stock market returns. The correlation between the 10-year Treasury yield and reliable estimates of 10-year S&P 500 total returns (like those shown in the chart above) is only about 0.13. The correlation between the 10-year Treasury yield and actual subsequent 10-year total returns for the S&P 500 is also only about 0.13 (for geeks, that’s an R-squared of less than 0.02). There’s no question that sustained trends in interest rates can significantly impact stock prices, particularly when they are driven by unexpected inflation or deflation. But the initial level of 10-year Treasury yields explains virtually none of the variation in S&P 500 total returns in data since 1940. Examine the data and prove this to yourself before taking Wall Street’s bait. Economic Notes One of the seemingly confusing aspects of Friday’s employment report was the increase of 638,000 jobs in the household survey, which contrasted with the rather disappointing 113,000 jobs in the more widely followed payroll survey. What many of the talking heads called a troubling difference can be explained by a footnote in the report from the Bureau of Labor Statistics: “household survey data for January 2014 reflect updated population estimates.” The civilian labor force itself was revised higher by 523,000 individuals. Here’s how these revisions work (from Business Statistics of the United States, Strawser, 2012): “Official [current population survey] data are characterized by periodic discontinuities, which occur when benchmarks for Census measures of the total population are introduced. These updates take place in a single month – usually January – and the official data for previous months are typically not modified to provide a smooth transition... Such discontinuities occur throughout the history of the series.” One of the more notable examples of this is was in January 2000, when the household employment figure jumped by 2,036,000 jobs, while the civilian labor force jumped by 2,090,000. By comparison, the total non-farm payroll figure (establishment survey) increased only by 233,000. The nearly nine-fold difference between the household and establishment figures wasn’t some gross aberration or cause for alarm in the field of economic analysis. It simply reflected standard practice in adjusting the household data for changes in estimated population. Similarly, in January 2003, the household employment figure surged by 991,000 jobs, while the civilian labor force figure jumped by 871,000. In contrast, the total non-farm payroll figure increased by only 89,000 jobs. This simply reflected standard practice. There are certainly times when true inconsistencies in payroll figures can be informative, but where January benchmark revisions are concerned, there’s really nothing out of the ordinary here. The foregoing comments represent the general investment analysis and economic views of the Advisor, and are provided solely for the purpose of information, instruction and discourse. Only comments in the Fund Notes section relate specifically to the Hussman Funds and the investment positions of the Funds. Fund Notes The Hussman Funds continue to be strongly defensive toward equities. Strategic Growth continues to carry a “staggered strike” hedge that raises the strike prices of its index put options closer to market levels. As I’ve noted in recent weeks, depending on the frequency of opportunities to shift strike prices and expirations, we can expect some “give and take” from those index put options on a day-to-day basis as the indices fluctuate. Strategic Dividend Value Fund continues to hedge about 50% of its equity exposure. Strategic International remains fully hedged. Strategic Total Return Fund remains modestly constructive toward bonds and precious metals shares. Overall, we remain defensive here, and our investment stance will change in response to shifts in the return/risk profile we estimate. --- The foregoing comments represent the general investment analysis and economic views of the Advisor, and are provided solely for the purpose of information, instruction and discourse. Prospectuses for the Hussman Strategic Growth Fund, the Hussman Strategic Total Return Fund, the Hussman Strategic International Fund, and the Hussman Strategic Dividend Value Fund, as well as Fund reports and other information, are available by clicking "The Funds" menu button from any page of this website. |
|||||||||||||||||||||||||
|
For more information about investing in the Hussman Funds, please call us at
1-800-HUSSMAN (1-800-487-7626) 513-326-3551 outside the United States Site and site contents © copyright Hussman Funds. Brief quotations including attribution and a direct link to this site (www.hussmanfunds.com) are authorized. All other rights reserved and actively enforced. Extensive or unattributed reproduction of text or research findings are violations of copyright law. Site design by 1WebsiteDesigners. |