|
|
||||||
|
|

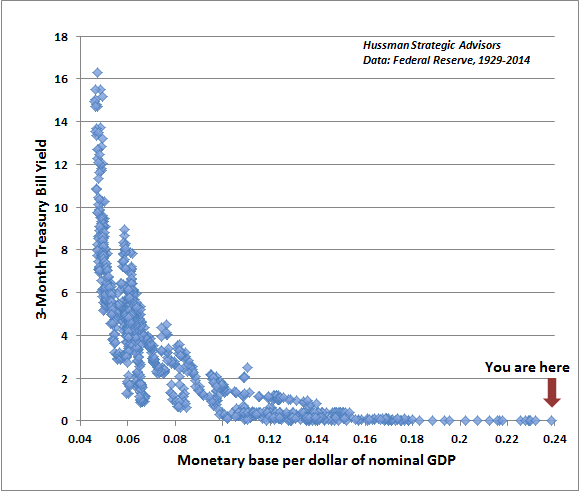
August 25, 2014 Broken Links: Fed Policy and the Growing Gap Between Wall Street and Main Street When the majority of Americans examine the world around them, they see a stock market at record highs and modest apparent improvement in the economy, but they also have the sense that something remains terribly wrong, and they can’t quite put their finger on it. According to a recent survey by the Federal Reserve, 40% of American families report that they are “just getting by,” and 60% of families do not have sufficient savings to cover even 3 months of expenses. Even Fed Chair Janet Yellen seemed puzzled last week by the contrast between a gradually improving unemployment rate and persistently sluggish real wage growth. We would suggest that much of this perplexity reflects the application of incorrect models of the world. Before the 15th century, people gazed at the sky, and believed that other planets would move around the Earth, stop, move backwards for a bit, and then move forward again. Their model of the world – that the Earth was the center of the universe – was the source of this confusion. Similarly, one of the reasons that the economy seems so confusing at present is that our policy makers are following models that have very mixed evidence in reality. Worse, when extraordinary measures don’t produce the desired results, the response is to double the effort without carefully asking whether there is a reliable, measurable cause-and-effect relationship in the first place. When there are broken links in the chain of cause-and-effect, “A causes B” may be true, and “C causes D” may be true, but if B doesn’t cause C, then all the A in the world won’t give you D. Let’s review some relationships in the data that are clear, and some that are not so clear at all. All data in the charts below are from the Federal Reserve Economic Database (FRED), and present relationships in post-war U.S. data except as otherwise noted. Quantitative easing and short-term interest rates First, the following chart shows the relationship since 1929 between the monetary base (per dollar of nominal GDP) and short-term interest rates. This is our variant of what economists call the “liquidity preference curve,” and is one of the strongest relationships between economic variables you’re likely to observe in the real world. After years of quantitative easing, the monetary base now stands at 24% of GDP. Notice that less than 16% was already enough to ensure zero interest rates, so the past trillion and a half dollars of QE have done little but increase the pool of zero-interest assets that are fodder for yield-seeking speculation. Notice also that unless the Fed begins to pay interest to banks on their idle reserves, the Fed would have to contract its balance sheet by about $1 trillion just to raise Treasury bill yields up to a fraction of one percent. So the primary policy tool of the Fed in the next couple of years will likely be changes in interest on reserves (IOR). Get used to that acronym. [The left scale shows the 3-month Treasury bill yield, in percent. For monetary base/GDP, note that as 0.24 is 24% and so forth, the horizontal axis is presented in decimal form].
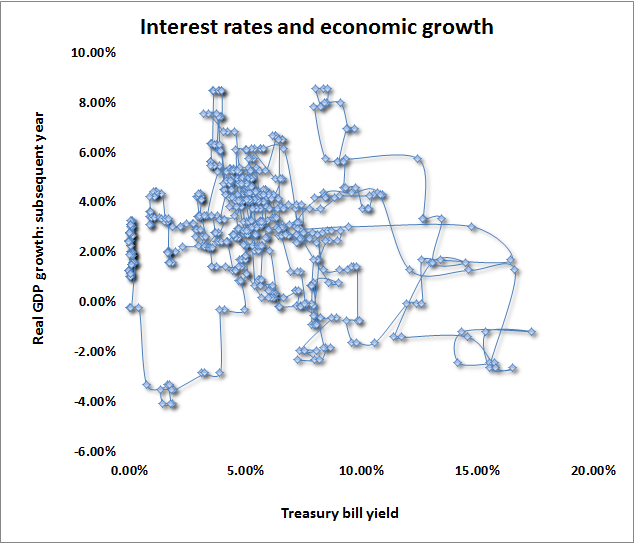
Interest rates, wealth effects, and economic growth Following this very strong economic relationship, let’s examine a very weak one. It should give pause to those who believe that low interest rates are naturally associated with stronger economic activity. The fact is that when productive opportunities to invest are available, strong economic activity and normal or even elevated interest rates are completely compatible, and those higher interest rates also raise the bar in a way that discourages borrowing for unproductive activities. When “natural” demand for loans is weak and legitimately productive opportunities to invest are not available, there is a temptation – clearly enticing to the Federal Reserve – to attempt to artificially stimulate demand for loans in hopes of provoking greater economic activity. The problem with repressing the financial system this way is that it lowers not only the bar on loan cost, but also the bar on loan quality. This is essentially what produced the global financial crisis. Artificially depressed interest rates punish savers and cause them to seek yield by channeling funds to more and more speculative areas of the economy, while encouraging already indebted borrowers to take on more debt so long as the debt can be serviced for now. The chart below should suffice as a reminder that interest rates and economic growth are both determined by a complex interplay of supply and demand, and that low short-term interest rates in themselves have no clear relationship to subsequent economic growth. The points on the chart show the 3-month Treasury bill rate on the horizontal axis, with the growth of real U.S. gross domestic product during the subsequent year on the vertical axis. The points are connected to trace their movement over time.
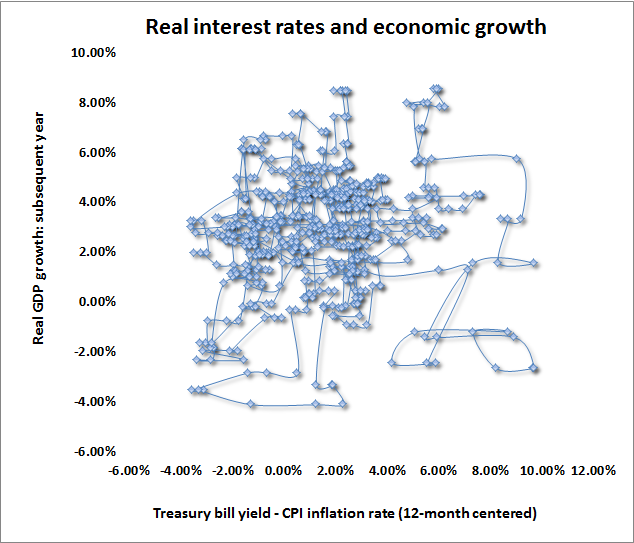
Now, there are certainly statistical tools that can be brought to bear to “identify” supply and demand, in order to show that lower interest rates do increase the demand for borrowed funds. It’s just that a policy of suppressing short-term interest rates in the hope of turning the world into a big, exploitable demand curve (where supply passively accommodates every policy change) is a fantasy born of partial-equilibrium thinking. It’s the same line of thinking that leads developing nations to put price controls on bread, only to discover that bread is cheap and yet nobody gets bread. The relationship doesn’t improve if we examine it in terms of real interest rates after inflation. The same point can be demonstrated with as many variations as one chooses to examine, but one chart should convey the idea. If anything (and one can show this better using cross-country data), higher real interest rates are generally accompanied by faster, not slower, subsequent real economic growth – largely because higher real interest rates reflect robust demand for loans and a desirable menu of productive investments with high expected rates of return. The points on the chart show the 3-month Treasury bill rate, after inflation, on the horizontal axis, with the growth of real U.S. gross domestic product during the subsequent year on the vertical axis. The points are connected to trace their movement over time.
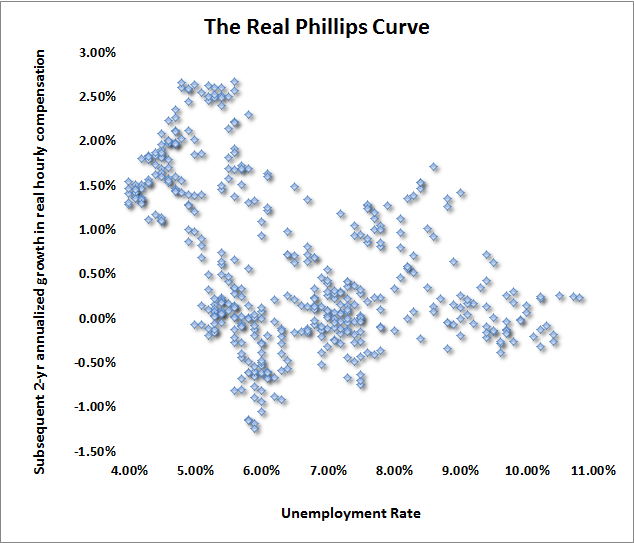
The most common problem with the model that people carry around in their heads – “lower interest rates stimulate economic growth” – is that it’s a pure demand-side argument and reduces the complexity of long-term investment decisions to nothing more than the interest rate. For most companies, the central decision in borrowing to invest is whether the long-term stream of future output resulting from the investment will be sufficiently demanded to profitably cover the cost of the investment, including but not limited to the interest payments. So what sort of decision does the Fed’s policy of suppressing interest rates encourage? Only those where the cost of funds is the primary cost of doing business: financial transactions. A few years ago, housing could be included as a major beneficiary of Fed-induced speculation not only among financial institutions but among ordinary investors. But that ship has sailed, crashed into the glacier, and sunk to the bottom of the deep blue sea. So what we now have is a financial sector amped up on more than four trillion tablets of amphetamine, and a real economic sector that remains at year-to-year growth rates that have historically marked the border between expansion and recession. Meanwhile, any historically informed and reasonably educated economist should have recognized that Bernanke's proposed "wealth effect" from stock prices to GDP was a canard from the instant that notion left his lips. Milton Friedman won a Nobel Prize in part by demonstrating that individuals consume off of what they conceive as their "permanent income," not based on fluctuations in volatile securities. Indeed, it's easy to show that a 1% change in the S&P 500 has historically been associated with a transitory change of only 3-5 hundredths of 1% in real GDP, with the bulk of that relationship being in the first few quarters of an expansion, as stocks typically turn up before GDP does. By encouraging speculators to drive stock prices to more than twice their pre-bubble valuation norms (on the measures most strongly correlated with actual subsequent market returns - see Setting the Record Straight), the Fed has managed to provoke a temporary response amounting to a few percent more GDP in this recovery than we might otherwise have enjoyed. But the economic payback may be unpleasant as this extreme market overvaluation unwinds. Further speculation will simply worsen that outcome. Now, before the financial crisis, there was a somewhat stronger "wealth effect" between housing values and consumption, but that's because house price appreciation did have a history of being reliably permanent. The housing bubble and crash changed that, and it may be some time until that link is restored. Stock price appreciation, on the other hand, has never had a record of being permanent, despite exciting advances like those that led to the 1929, 1972, 1987, 2000, and 2007 peaks - all which shared the same extreme overvalued, overbought, overbullish syndrome as we've observed, without consequence (yet), in the present advance. Put simply, the idea that suppressed short term interest rates are reliably "stimulative," and the concept of a material "wealth effect" from stock prices to the real economy are both among the broken links between things the Federal Reserve can affect (short-term interest rates, yield-seeking speculation) and those it wishes to affect (employment, GDP). Pushing harder on the accelerator pedal has simply caused a speculative bubble across nearly every class of risky assets, pulled consumption forward from the future, encouraged massive issuance of low-grade debt, and continues to starve the elderly, the disabled, and others who rely on interest income of any source of safe return. The real Phillips Curve and the phony one Next in the parade of overly simplified relationships is one that might be pulled directly from any randomly-selected thought bubble floating out of a window at the Federal Reserve: the Phillips Curve. What’s interesting about the Phillips Curve is that when A.W. Phillips wrote his original Economica paper in 1958 - The Relation between Unemployment and the Rate of Change of Money Wage Rates in the United Kingdom, 1861-1957 – he was looking at two things: one being wage inflation, and the other being wage inflation in a century of data where the United Kingdom was on the gold standard and general prices were quite stable. So what Phillips actually found, and what can be replicated in data across the globe, is a relationship between unemployment and real wage inflation. It’s actually a very straightforward scarcity relationship: when labor is scarce (unemployment is low), its price tends to rise relative to the price of other goods in the economy. The reverse is true when labor is plentiful. Here’s what that relationship looks like in data since the mid-1970’s (using average hourly compensation divided by the GDP deflator). It’s not a tight curve, but it essentially reflects what Phillips observed.
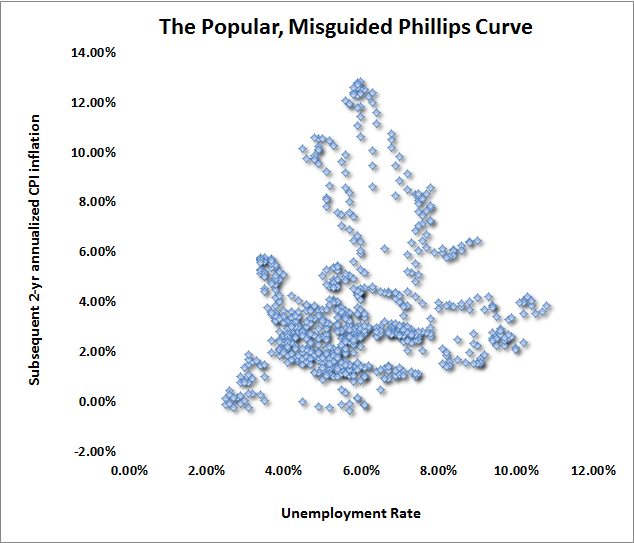
Over time, what the economics profession has done is to drop the words “real wage” and state the Phillips curve as a relationship between unemployment and general price inflation. A whole range of variations capture numerous equally bad assertions, ranging from the notion that one can obtain more jobs by “allowing” more inflation, to the idea that inflation risk need not be considered unless the rate of unemployment is “too low.” The chart below presents what’s probably the most popular variant – the idea that low unemployment triggers subsequent inflation, but you can demonstrate all of the other bad variants to yourself with an Excel spreadsheet over lunch, in the time it takes for the Fed to create another hundred million dollars of monetary amphetamine. Not quite a “curve,” is it?
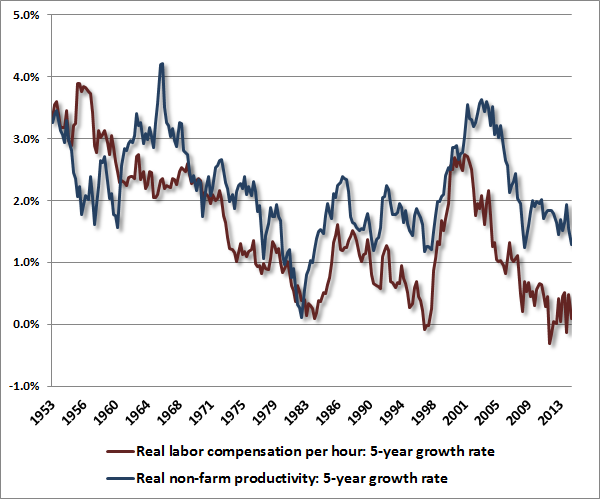
Probably the strongest feature of the foregoing chart is the tendency for inflation to move higher and lower in trends that have very little to do with unemployment, and for unemployment to move up and down in trends that have very little to do with inflation. Not to ruin a good theory with the facts, the failure of this misguided Phillips Curve formulation to describe the real world has resulted in a wide variety of ways to “augment” it using expectations, varying “natural” rates of unemployment, and so forth. The idea seems to be that using the right set of assumptions, we can make sense of the fact that the planets that circle around the Earth keep stopping and going backwards. We’re still far from the point that the Fed realizes, as Copernicus did, that the prevailing dogma is not descriptive of the world. The winner-take-all economy Several factors contribute to the broad sense that something in the economy is not right despite exuberant financial markets and a lower rate of unemployment. In our view, the primary factor is two decades of Fed-encouraged misallocation of capital to speculative uses, coupled with the crash of two bubbles (and we suspect a third on the way). This repeated misallocation of investment resources has contributed to a thinning of our capital base that would not have occurred otherwise. The Fed has repeatedly followed a policy course that sacrifices long-term growth by encouraging speculative malinvestment out of impatience for short-term gain. Sustainable repair will only emerge from undistorted, less immediate, but more efficient capital allocation. In recent years, the U.S. has experienced a collapse in labor participation and weak growth in labor compensation, coupled with an increasingly lopsided distribution of whatever benefits the recent economic recovery has generated. This is not well-explained by Phillips Curves or simplistic appeals to "insufficient demand," and it is unlikely to be improved by endless monetary “stimulus” (the targets that clearly occupy the Fed’s thinking). While our economic challenges can be largely traced to more than a decade of persistent Fed-enabled misallocation of capital, most of the costs of this misallocation have fallen on labor because of a) shifting composition of labor demand that has resulted from an increasing share of international trade with countries with heavy populations of relatively unskilled labor; and b) economic features that increasingly create a “winner-take-all” distribution of economic gains. One of the key results in international economics is that as trade opens up between nations, those nations will tend to export goods that intensely use the factor (skilled labor, unskilled labor, capital) with which they are relatively well-endowed. In a world where we have opened up trade with countries that are densely populated with unskilled workers, and where the U.S. is relatively better endowed with skilled labor and capital, the result has been something of a hollowing out of the middle class among households that aren’t themselves endowed with skilled labor or capital. Essentially, the U.S. obtains the services of low-skilled labor more cheaply from abroad than domestically. There is no great debate on this point. Meanwhile, transfer payments like welfare and unemployment compensation allow many households to maintain consumption despite being out of those jobs, and given the ability of households to take on debt, even if they are actually living paycheck to paycheck, the produced goods get purchased, companies make a profit, government runs a deficit, the Fed keeps interest rates low which allows all the debt to be serviced, and everyone is pleasantly, if unsustainably, happy. That’s particularly true as long as nobody asks how the debt will be repaid, which is certainly what Fed policy encourages. Now, looking at nations as a whole, academic economists proudly derive various theorems to prove that both nations actually benefit in aggregate from international trade. The problem, however, is in the distribution of those gains. This is particularly true in what might be called “winner-take-all” economies. Why do professional athletes, movie actors, and even some 23-year-old computer programmers earn so much more than teachers, nurses, and factory-line workers? The answer is simple. They’ve found a way to spread the impact of their efforts over a very large number of individuals, while the teachers, nurses, and factory-line workers can apply their efforts to a dramatically smaller number of “units,” be they students, patients, or boxes of Corn Flakes. For massive too-big-to-fail banks, the units are dollars. The downside is that as certain winners are able to spread their efforts over an enormous number of people, the required number of winners declines – ask anyone who has ever tried to become a movie actor or a pro-basketball player. International trade and internet communications, among other developments, have significantly increased that tendency toward winner-take-all outcomes. When that effect is expanded through international trade, the result is that yes, each country benefits in aggregate, but you also observe a “hollowing out” of the middle class, particularly for families that don’t have labor or capital that shares in the distribution. The following charts provide some insight into this shift in the distribution of economic gains. The first shows 5-year growth rates of real productivity and real wages across history. Think of these figures this way: productivity is the amount of output that an hour of labor produces, while real wages are the amount of output that an hour of labor can command. In the long-run, we know that the best way to produce a rising standard of living is to increase productivity through innovation and sound allocation of savings and resources. But notice that in recent years, labor has been getting less of the benefit. While non-farm productivity has grown at a sluggish 1.3% annual rate over the past 5 years, real wage growth has been trapped near zero. The widening gap between productivity growth and real wage growth is part of the reason Americans feel that there is something wrong.
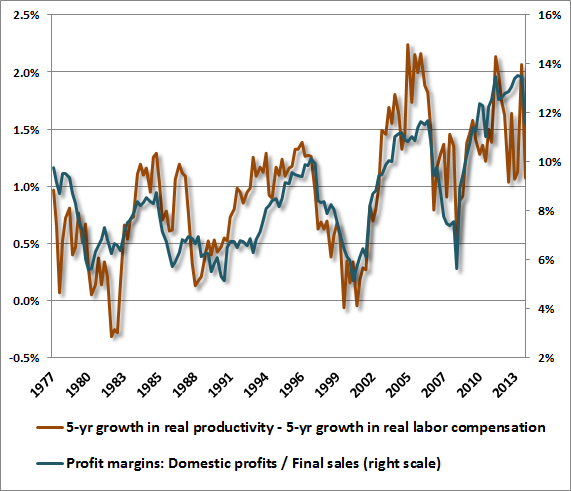
It shouldn’t take much thought to recognize that this gap is one of the reasons for the growing income disparity between ordinary Americans and those who have benefited from wide corporate profit margins and Fed-induced speculation. While competition tends to normalize profit margins over time, and is likely to do so even if some gap persists between productivity and real wages, corporate profits have benefited from an unusually wide gap in recent years, as well as low interest rates and poor capture of revenues from existing corporate tax treatment. (As a side note, stocks are financial instruments with roughly 50-year duration, not 3, 5, or 10 year duration – if you think these factors are enough to pay top dollar for current earnings because current profit margins can be “explained,” you’re kidding yourself). While we don’t believe that the present gap is likely to be sustained, it’s clear that Americans are right to feel that something is amiss. In the chart below, the orange line shows annual growth in real productivity in excess of real labor compensation over the preceding 5-year period (left scale), while the blue line shows domestic profits as a percentage of final sales (right scale). Note that profit margins tend to mirror the excess of real productivity growth over real labor compensation.
Rainforests and resilience How can policy makers help to build the economy from the middle-out, and slow the both the unproductive diversion and the lopsided distribution of resources in our economic system? First, we should begin by stopping the harm. Quantitative easing will not help to reverse this process. The dogmatic pursuit of Phillips Curve effects, attempting to lower unemployment with easy money, has done little to materially change employment beyond what is likely to have occurred without such extraordinary intervention, but has contributed to speculative imbalances and an increasingly uneven income distribution. Indeed, Fed policy does violence to the economy by helping to narrow it to what complex systems theorists call a “monoculture.” Nearly every minute of business television is now dominated by the idea that the Federal Reserve is the only thing that matters. Meanwhile, by pursuing a policy that distinctly benefits those enterprises whose primary cost is interest itself, the Fed’s policies have preserved and enhanced too-big-to-fail banks, financial engineering, and speculative international capital flows at the expense of local lending, small and medium-size banks and enterprises, and ultimately, economic diversity. In his book, Hidden Order, complex systems theorist John Holland (who originated the use of genetic algorithms in computing) observed that despite extremely poor soil in a tropical rain forest, even a single tree can harbor over 10,000 different species of life because “the forest departs from the simple version of a food web, in which resources are only passed upward to the top predator. Instead, cycle after cycle traps the resources so they are used and reused before they finally make their way to the river system. Agents that participate in cyclic flows cause the system to retain resources. The resources so retained can be further exploited – they offer new niches to be exploited by new kinds of agents. Parts of a complex adaptive system that exploit these possibilities, particularly parts that further enhance recycling, will thrive. Parts that fail to do so will lose their resources to those that do. This is natural selection writ large. It is a process that leads to increasing diversity through increasing recycling.” Thriving, resilient economies work the same way. Monocultures are the exact opposite. The economic equivalent of an adaptable system is one that discourages mammoth institutions, foreign outsourcing, large-scale financial distortions, and speculative capital flows, and instead creates a policy environment that helps to allocate scarce savings to productive investment, encourages small and medium size banks and enterprises, expands the availability of capital to small businesses, and enables the local “recycling” of capital and economic activity. This doesn’t have to be centrally planned, nor does it require trade protections. All it needs is an environment where capital and resources aren’t badly misdirected based on manipulated interest rates and policies that encourage speculation. Much of the harm comes from a Federal Reserve that appears singularly focused on “massive macro” – the epic and untargeted flooding of the financial system with liquidity to satisfy some dogmatic experiment focused on economic relationships that can’t even be clearly established in the data. The always observant Charles Hugh Smith puts it this way: “Diversity and adaptability go together; each is a feature of the other. The Federal Reserve has created an unstable monoculture of an economy. What should have triggered a ‘die off’ of one predatory species – the ‘too big to fail’ mortgage/commercial banks and the Wall Street investment banks – was redistributed to all other participants. In insulating participants from risk, fact-finding, and volatility, you make price discovery and thus stability impossible.” Rather than breeding a resilient economy by allowing the undistorted allocation of capital, rather than taking any lesson from a global financial crisis whose growing risks Yellen dismissed with “No, No, and No,” the Fed has created a food web that channels resources to the top predators, and ensures that scarce capital is diverted to the use of financial engineers and speculators. For someone who wants to help the middle class, the jobless, and ordinary Americans, Janet Yellen – as well meaning as we honestly believe she is – may inadvertently make matters quite a bit worse if her benign view of growing financial risk continues. Broken links in the chain of cause and effect The Federal Reserve’s prevailing view of the world seems to be that a) QE lowers interest rates, b) lower interest rates stimulate jobs and economic activity, c) the only risk from QE will be at the point when unemployment is low enough to trigger inflation, and d) the Fed can safely encourage years of yield-seeking speculation – of the same sort that produced the worst economic collapse since the Depression – on the belief that this time is different. From the foregoing discussion, it should be clear that this chain of cause and effect is a very mixed bag of fact and fiction. To be fair, we do believe that some components of the Fed’s thinking are well-supported by economic evidence. For example, in her presentation at Jackson Hole, Fed Chair Janet Yellen observed that real wage inflation remains low, and that this is an indication of ongoing slack in the labor market that isn’t well-captured by the rate of unemployment. On this point, we would completely agree. To the extent that the true Phillips Curve (which relates unemployment to real wage inflation) describes reality, it’s sensible to assert that low real wage inflation informs us that the unemployment rate has not declined to a level that reflects labor market scarcity – though we should also recognize that real wage growth would already be much higher if there was not such an extreme gap between real wage growth and productivity growth. Where we differ from Chair Yellen is in a variety of supposed cause-effect relationships that aren’t supported by evidence to any meaningful extent, and in the neglect of systemic risks that are undeniable if one has been paying any attention at all to the macroeconomy over the past 15 years. Let’s summarize the links in the chain of cause and effect. First, as demonstrated above, it’s clear that increasing the monetary base relative to nominal GDP will predictably and reliably lower short-term interest rates. This is true at least until the point that, as has occurred across history and across countries, inflation picks up rather uncontrollably – often following a supply shock coupled with government deficit spending – with very little at all to do with the prevailing unemployment rate. In any event, nearly a century of data provides very clear evidence of a tight link between monetary base/nominal GDP and the level of short-term interest rates. The next link in the chain is the assumption that suppressed short-term interest rates are somehow good for economic growth and job creation. Here, the cause-and-effect link is much weaker. It’s certainly true that suppressed short-term interest rates result in yield-seeking and the enhanced availability of loans to low-quality borrowers who offer higher yields than are available on safe alternatives. But it’s also clear that QE does not do much to stimulate real investment, where there are numerous costs and risks beyond the cost of money (and where hundreds of billions of idle dollars are available on corporate balance sheets even in the absence of further QE). Rather, QE primarily encourages speculation, leveraged finance, and other forms of financial “engineering” where interest represents the primary expense. The objective of these activities is not job creation, but leveraging the “spread” between the return on one financial asset and the interest that one must pay to acquire it with borrowed money. On Yellen’s inflation views, the argument that general price inflation will only follow real wage inflation is really an argument that general price inflation will only follow low unemployment. At best, this view is half right. There’s good evidence that low unemployment tends to result in higher real wage inflation (the real Phillips Curve), but it does not follow that real wage inflation is naturally associated with faster general price inflation. Indeed, because general prices are the denominator of real wages, faster general price inflation tends to reduce real wages in the absence of a spiral in all nominal prices where wages take the lead. That’s just arithmetic. Aside from some short-term cyclical pressures, we’re not terribly concerned about rapid inflation at present, but we also don’t find much evidence that unemployment, whether at current levels or lower levels, is the central factor that would determine inflation anyway. The most dangerous assumption of the Fed is that the primary risk of QE is inflation, and that QE is somehow a benign policy in the absence of inflation risk. Yes, we would love to see lower unemployment, and agree that stronger growth in real wages would likely result from that. It’s just that the transmission mechanism from QE and zero-interest rate speculation to lower unemployment is either nonexistent or so poorly defined that the policy can only be considered reckless. The Phillips Curve dogma of the Fed has created blinders that narrow its view of risk to some abstract “tradeoff” between inflation and unemployment. Meanwhile, the speculative pitch of the markets is contributing to a very real risk of steep financial disruptions, not only because risk-assets are overvalued, but because debt is increasingly being purchased on the basis of yield rather than the careful evaluation of repayment prospects. So the greatest risk of QE is not the inflation risk that may or may not emerge, but the financial distortion, overvaluation, and speculation that is already baked in the cake and is progressively worsening, in a manner quite similar to the 2000 and 2007 extremes, though less evident because the cyclical elevation of profit margins makes prices seem tolerable relative to current earnings. As I’ve frequently noted, based on equity valuation measures that are most reliably correlated with actual subsequent stock market returns, stocks are now more than double their pre-bubble historical norms, and presently suggest that the S&P 500 will be no higher a decade from now than it is today. We expect the current QE bubble to unwind no more kindly than the prior bubbles in 2000 and 2007. As in those instances, my view remains that speculators who successfully exit this bubble will do so through the eye of a needle, and that the exit signal most envision will be far noisier and less timely than they imagine. See Ockham's Razor and the Market Cycle and Yes, This is An Equity Bubble for additional background on these concerns. As for the U.S. economy, QE-induced speculation misallocates resources that might otherwise contribute to long-run growth, and while conditions could certainly be worse, the benefits of this economic recovery have been highly uneven. Again, 40% of families report that they are “just getting by,” with the majority essentially living paycheck to paycheck without enough savings to cover even a few months of expenses. We could be, and should be doing better, except that this complex adaptive system of ours responds to good incentives as well as bad ones, and has been repeatedly crippled by policies that have produced waves of malinvestment, bubble, and collapse. The economy is starting to take on features of a winner-take-all monoculture that encourages and subsidizes too-big-to-fail banks and large-scale financial speculation at the expense of productive real investment and small-to-medium size enterprises. These are outcomes that our policy makers at the Fed have single-handedly chosen for us in the well-meaning belief that the economy is helped by extraordinary financial distortions. The Federal Reserve is right to wind down quantitative easing, and would best terminate reinvestment of maturing holdings, ideally beginning in October or quickly thereafter. The issue is not whether the U.S. economy does or does not need “life support.” The issue is that QE is not life support in the first place. The foregoing comments represent the general investment analysis and economic views of the Advisor, and are provided solely for the purpose of information, instruction and discourse. Only comments in the Fund Notes section relate specifically to the Hussman Funds and the investment positions of the Funds. Fund Notes The Hussman Funds maintain a defensive stance in equities, with a modestly constructive stance toward Treasury bonds, and an increasingly constructive stance toward precious metals shares. --- The foregoing comments represent the general investment analysis and economic views of the Advisor, and are provided solely for the purpose of information, instruction and discourse. Prospectuses for the Hussman Strategic Growth Fund, the Hussman Strategic Total Return Fund, the Hussman Strategic International Fund, and the Hussman Strategic Dividend Value Fund, as well as Fund reports and other information, are available by clicking "The Funds" menu button from any page of this website. |
|||||||||||||||||||||||||
|
For more information about investing in the Hussman Funds, please call us at
1-800-HUSSMAN (1-800-487-7626) 513-326-3551 outside the United States Site and site contents © copyright Hussman Funds. Brief quotations including attribution and a direct link to this site (www.hussmanfunds.com) are authorized. All other rights reserved and actively enforced. Extensive or unattributed reproduction of text or research findings are violations of copyright law. Site design by 1WebsiteDesigners. |