|
|
||||||
|
|

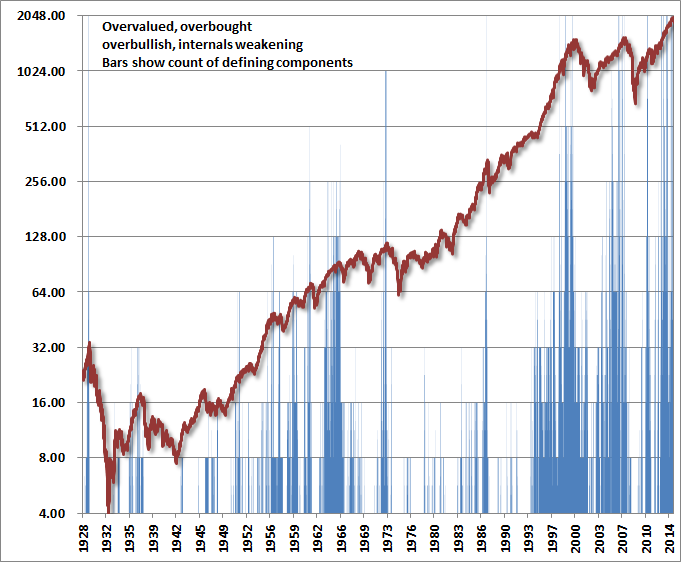
November 17, 2014 These Go to Eleven The current market environment joins the full range of ingredients that have characterized the most extreme market peaks – and preceded the deepest market plunges – in more than a century of history. On the basis of measures that are best correlated with actual subsequent market returns (and plenty of popular measures are not), we observe the richest market valuations in history with the exception of the 2000 peak. Even then, current levels on the best performing measures are only about 15-20% below the 2000 extreme. Current valuations now exceed those observed in 1901, 1929, 1937, 1972, 1987, and 2007. The 5-year market advance from the 2009 low, encouraged by yield-seeking speculation, now places the S&P 500 at more than double the level that we would associate with historically normal returns. Put another way, we presently estimate S&P 500 prospective nominal total returns of just 1.4% annually over the coming decade, with zero or negative average total returns out to roughly 2022. These valuations are coupled with extremely overbought conditions and the most lopsided bullish sentiment since 1987. Bearish sentiment is now down to 14.8% (Investor’s Intelligence), close to the low of 13.3% reached in September. Prior to this year, the last two times sentiment was nearly as lopsided were the April 2011 peak (just before a near-20% dive), and the October 2007 peak. Of particular note, extreme overvalued, overbought, overbullish conditions – which we’ve observed sporadically for quite some time now – have more recently been accompanied by widening credit spreads and deterioration in broad market internals. We have entered an environment in which extraordinarily thin risk premiums have been joined in recent weeks by a subtle shift toward increasing risk aversion. We don’t rule out the potential for market internals to improve in a way that could defer our concerns about immediate downside risk (though such a deferral would not imply that valuations were any less extreme), but the short-squeeze over the past month has not materially reversed the deterioration. As a result, present conditions couple every essential component of historically extreme and vulnerable market environments. As Nigel Tufnel of Spinal Tap described the volume knobs on his guitar amplifier – “You're on ten here, all the way up, all the way up, all the way up, you're on ten on your guitar. Where can you go from there? Where? Eleven. Exactly. One louder. These go to eleven.” The chart below presents a slightly different perspective than similar charts I’ve presented over time. Rather than showing discrete instances where a whole syndrome of overvalued, overbought, overbullish conditions has occurred (points with bullish sentiment at extremes, valuations historically rich, prices pushing upper Bollinger bands, etc), the vertical bars show a count of individual components, coupled with additional components that reflect deteriorating market internals. This gives a less binary view of these syndromes. The spikes (such as 1929, 1972, 1998, 2000, 2007, 2011, and the past year) show points when a preponderance of conditions – extreme valuation, lopsided bullish sentiment, overbought conditions, widening credit spreads, and at least some aspects of deteriorating market internals – have been observed in unison. The red line shows the S&P 500 Index (log scale).
As I noted in Air Pockets, Free-Falls and Crashes the lessons to be drawn from the recent market cycle are not that historically overvalued, overbought, overbullish extremes can be dismissed. Rather, the lessons to be drawn have to do with the criteria that distinguish when such extremes have little near-term impact from periods where they suddenly matter with a vengeance. Those criteria have a great deal to do with measures of market action that capture subtle shifts risk aversion, such as widening credit spreads and deteriorating market internals. Sometimes those subtle shifts are all the warning you get, and while the 1987, 1998 and 2011 instances were expressed rather quickly in market losses that then subsided, it’s just as typical for downside consequences to be sustained over a couple of years. The market has been dodging boomerangs, not bullets, and they are likely to come back harder for it. Importantly, rich valuations here cannot be “justified” by appeals to current interest rates or profit margins unless that justification carries with it the assumption that both zero interest rate policy and cyclically-elevated profit margins will be sustained for decades, coupled with the assumption that economic growth will proceed at historically normal rates. Even 3-4 more years of zero-interest rate policy would only be “worth” a 12-16% increase in valuations over and above their historical norms. No, this is a market that is priced for utter perfection, reflecting the Potemkin Village that Fed-induced speculation has built on Wall Street, even as Main Street struggles in its shadow. Could this time be different? There are numerous factors that aren't in place here, such as overt Fed tightening, but we also know that those factors have not historically been necessary for steep market retreats to occur (indeed, the 2000-2002 and 2007-2009 plunges occurred in an environment of persistent and aggressive Fed easing). Still, some features of the present environment can't be observed historically. For example, none of the market crashes in history occurred in an environment of quantitative easing and zero short-term interest rates, because such an environment never existed prior to the present half-cycle. As a result, one has to make a judgment about how zero interest rates should be expected to impact an overvalued, overbought, overbullish market. From a valuation standpoint, we can quantify the justified impact on valuations from the expectation of T years where short-term interest rates are at L% rather than N% [one can show using standard discounting methods that to a strong approximation, the impact is just T*(N-L)]. What’s harder to quantify is the psychological impact of zero interest rates. That’s really what quantitative easing has exploited: the willingness of investors to speculate, regardless of historically elevated valuations and extremely lopsided bullish sentiment, because of the discomfort that zero interest rates seem to offer “no other choice” but to take risk. On that front, I clearly underestimated the willingness of investors to dispense with the lessons of history in recent years, responding to zero short-term interest rates by piling into a massive speculative carry trade. Again, from our standpoint, the proper response has not been to join in discarding those lessons, but to identify the criteria that distinguish where overextended extremes have had little near-term impact from periods when those extremes matter with a vengeance. That’s why we’re focused on market internals here – the recent deterioration suggests a subtle shift toward increasing risk aversion, despite depressed short-term interest rates. Are we certain that these measures of market internals and related adaptations we’ve identified in recent years will identify a collapse from these overextended extremes? No – certainty about the future is not a luxury that any amount of market research can provide. What we’re quite certain of, however, is that the measures we are attending to would have effectively navigated risk taking and risk avoidance not only in historical market cycles in a century of history, not only during the tech bubble, not only during the housing bubble, and not only since the 2007 market peak, but also in the advancing period since the 2009 low. There will undoubtedly be points when our concerns about risk are strong but the market advances nonetheless, or where our willingness to accept risk is strong and but the market declines nonetheless. But we’ve adapted far more than is likely to be fully recognized until much later in the present market cycle or early in the next. We’ve got no interest in convincing anyone to adopt our views. Our responsibility is to those who trust us to identify and adhere to a value-conscious, historically-informed discipline, and to address what needs to be addressed when the need arises. We are confident that we’ve done so (See Formula for Market Extremes for an overview of the key lessons and adaptations that have emerged from our own work in the half-cycle since 2009). Meanwhile, as we learned back in 2000 and 2007, the full course of the market cycle was far more convincing about the validity of our concerns than any argument that we could have advanced at the peak. Again, an improvement in market internals would not make stocks any less richly valued or overextended, but because such an improvement would signal a resumed tendency toward yield-seeking speculation, the immediacy of our concerns would dial down considerably. Given present conditions, however, the dials do not move higher, and these go to eleven. The foregoing comments represent the general investment analysis and economic views of the Advisor, and are provided solely for the purpose of information, instruction and discourse. Please see periodic remarks on the Fund Notes and Commentary page for discussion relating specifically to the Hussman Funds and the investment positions of the Funds. --- The foregoing comments represent the general investment analysis and economic views of the Advisor, and are provided solely for the purpose of information, instruction and discourse. Prospectuses for the Hussman Strategic Growth Fund, the Hussman Strategic Total Return Fund, the Hussman Strategic International Fund, and the Hussman Strategic Dividend Value Fund, as well as Fund reports and other information, are available by clicking "The Funds" menu button from any page of this website. |
|||||||||||||||||||||||||
|
For more information about investing in the Hussman Funds, please call us at
1-800-HUSSMAN (1-800-487-7626) 513-326-3551 outside the United States Site and site contents © copyright Hussman Funds. Brief quotations including attribution and a direct link to this site (www.hussmanfunds.com) are authorized. All other rights reserved and actively enforced. Extensive or unattributed reproduction of text or research findings are violations of copyright law. Site design by 1WebsiteDesigners. |